

Abstract
Benzene is known to have toxic effects on the blood and bone marrow, but its impact at levels below the U.S. occupational standard of 1 part per million (ppm) remains uncertain. In a study of 250 workers exposed to benzene, white blood cell and platelet counts were significantly lower than in 140 controls, even for exposure below 1 ppm in air. Progenitor cell colony formation significantly declined with increasing benzene exposure and was more sensitive to the effects of benzene than was the number of mature blood cells. Two genetic variants in key metabolizing enzymes, myeloperoxidase and NAD(P)H:quinone oxidoreductase, influenced susceptibility to benzene hematotoxicity. Thus, hematotoxicity from exposure to benzene occurred at air levels of 1 ppm or less and may be particularly evident among genetically susceptible subpopulations.
Benzene causes toxicity to the hematopoietic system (hematotoxicity) and leukemia (1). Exposure to benzene occurs worldwide to workers in the oil, shipping, automobile repair, shoe manufacture, and other industries and to the general public from cigarette smoke, gasoline, and automobile emissions (2). In addition to ongoing concern about health effects at or below the current U.S. occupational standard of 1 ppm, high environmental exposures in cities (3) have led to regulatory consideration of the risks posed by benzene as an air pollutant.
Limitations in previous occupational studies evaluating hematotoxicity at low levels of benzene exposure led us to perform a large cross-sectional study with detailed exposure assessment that measured lymphocyte subsets and colony formation from progenitor cells in addition to the standard blood-count analyses reported in most previous investigations. Because benzene is thought to lower blood cell counts via metabolite effects on hematopoietic progenitor cells (4), we also evaluated the influence of genetic variants in cytochrome P4502E1 (CYP2E1) and myeloperoxidase (MPO), which metabolize benzene to toxic quinones and free radicals (5), and NAD(P)H:quinone oxidoreductase (NQO1), which protects against this toxicity (6, 7).
We compared 250 benzene-exposed shoe workers with 140 unexposed age- and sex-matched controls who worked in three clothes-manufacturing factories in the same region near Tianjin, China. Subjects were young (mean ± SD: 29.9 ± 8.4 years), about two-thirds were female (table S1), and shoe workers had been employed an average of 6.1 ± 2.9 years. For each subject, individual benzene and toluene exposure was monitored repeatedly up to 16 months before phlebotomy, and postshift urine samples were collected from each subject (8, 9). Subjects were categorized into four groups by mean benzene levels measured during the month before phlebotomy [controls, <1 ppm, 1 to <10 ppm, and ≥10 ppm (Table 1)], and more than 100 of the exposed workers had exposures below 1 ppm.
Table 1.
Peripheral blood cell counts in relation to benzene exposure level. There are up to 418 observations on 390 unique subjects (140 controls and 250 benzene-exposed workers). Data were obtained from 28 exposed subjects in both years (2000 and 2001) and are treated as independent observations in the summary data shown, distributing into benzene category on the basis of exposure level in the year that the blood sample was collected. Statistical analyses were adjusted for repeated measures by generalized estimating equations (22). Models were adjusted for age, sex, current smoking, current alcohol drinking, BMI, recent infections, and, where appropriate, ln toluene air level (which can competitively inhibit benzene’s metabolism) (9). Data shown here are from all subjects except one benzene-exposed subject with data for only CD4+/CD8+ ratio; two benzene-exposed subjects and one control with no benzene urine data; and two controls with no BMI data.
| Subject category (n)* | Controls (140) | <1 ppm (109) | 1 to <10 ppm (110) | ≥10 ppm (31) | P for <1 ppm vs. controls† | Ptrend’ all subjectsz†§ |
|---|---|---|---|---|---|---|
| Benzene exposure | ||||||
| Benzene air level (ppm)|| | <0.04 | 0.57 (0.24) | 2.85 (2.11) | 28.73 (20.74) | ||
| Benzene urine (μg/liter)¶ | 0.382 (1.24) | 13.4 (18.3) | 86.0(130) | 847(1250) | ||
| Peripheral blood cell counts # | ||||||
| White blood cells (WBC)** | 6480 (1710) | 5540 (1220) | 5660 (1500) | 4770 (892) | <0.0001 | <0.0001 |
| Granulocytes | 4110 (1410) | 3360 (948) | 3480 (1170) | 2790 (750) | <0.0001 | <0.0001 |
| Lymphocytes†† | 2130 (577) | 1960 (541) | 1960 (533) | 1800 (392) | 0.018 | 0.0014 |
| CD4+–T cells | 742 (262) | 635 (187) | 623 (177) | 576 (188) | 0.003 | 0.019 |
| CD8+–T cells | 553 (208) | 543 (212) | 564 (229) | 549 (160) | 0.75 | 0.97 |
| CD4+/CD8+ ratio | 1.46 (0.58) | 1.26 (0.41) | 1.22 (0.45) | 1.09 (0.35) | 0.015 | 0.024 |
| B cells | 218 (94) | 186 (95) | 170 (75) | 140 (101) | 0.003 | 0.0002 |
| NK cells | 586 (318) | 558 (299) | 566 (271) | 415 (188) | 0.56 | 0.0044 |
| Monocytes | 241 (92) | 217 (97) | 224 (93) | 179 (74) | 0.018 | 0.28 |
| Platelets | 230 (59.7) × 103 | 214 (48.8) × 103 | 200 (53.4) × 103 | 172 (44.8) × 103 | 0.023 | 0.0002 |
| Hemoglobin (g/dl) | 14.5 (1.6) | 14.7 (1.5) | 14.5 (1.7) | 13.6 (1.6) | 0.12 | 0.29 |
The 28 subjects studied in both the first (2000) and second (2001) year of the study are categorized based on the exposure assessment in 2000.
Controls versus exposed <1 ppm, by linear regression on ln of each endpoint.
Ptrend using ln air benzene as a continuous variable. All statistically significant endpoints were inversely associated with benzene exposure.
Comparison of subjects ≥10 ppm versus controls for endpoints without statistically significant trends: CD8+–T cells, P = 0.31; monocytes, P = 0.0006; hemoglobin P < 0.0001.
Benzene air level is the arithmetic mean (±SD) of an average of two measurements per subject collected during the month before phlebotomy (9). This time period was chosen because granulocytes have relatively short half-lives in peripheral blood.
Urinary benzene (mean ± SD) and mean individual air levels of benzene were strongly correlated (Spearman r = 0.88, P < 0.0001).
Unadjusted mean (±SD) cells/μl blood.
Supplementary analyses are shown in the SOM Text.
Absolute count.
All types of white blood cells (WBCs) measured in the Complete Blood Count and platelets (9) were significantly decreased in workers exposed to <1 ppm benzene compared to controls (Table 1). Lymphocyte subset analysis showed significantly decreased CD4+–T cells, CD4+/CD8+ ratio, and B cells. Hemoglobin concentrations were decreased only among workers exposed to ≥10 ppm. Tests for a linear trend using benzene air level as a continuous variable were significant for platelets and all WBC measures except monocytes and CD8+–T cells (Table 1). Adjustment for a range of potential confounders had a negligible effect on the strength of the associations (9).
We then restricted the linear-trend analyses to workers exposed to <10 ppm benzene, excluding controls and higher exposed workers, and found that inverse associations remained for total WBCs (P = 0.013), granulocytes (P = 0.02), lymphocytes (P = 0.045), B cells (P = 0.018), and platelets (P = 0.0016). To address the influence of past benzene exposure on these cell types, we examined workers exposed to mean benzene <1 ppm over the previous year (n = 60), and a subset who also had <40-ppm-years lifetime cumulative benzene exposure (n = 50), and found that the above cell types were decreased compared to controls (P < 0.05). Finally, to exclude the effect of other potential exposures on these associations, we identified a group of workers exposed to <1 ppm benzene with negligible exposure to other solvents (n = 30) (fig. S1) (9) and found decreased levels of WBCs, granulocytes, lymphocytes, and B cells compared to controls (P < 0.05). These findings, based on differentiated blood cell counts, provide evidence of hematotoxicity in workers exposed to benzene at or below 1 ppm.
Because benzene affected nearly all blood cell types, toxicity to progenitor cells was suspected. A fraction of hematopoietic progenitor cells circulate in the bloodstream in dynamic equilibrium with the bone marrow and can be cultured in colony-forming assays to measure their proliferative potential (10). Using peripheral blood from 29 benzene-exposed workers and 24 matched controls, we examined the dose-dependent effects of benzene on different types of progenitor cell colony formation (CFU-GM, BFU-E, CFU-GEMM) (9). Highly significant dose-dependent decreases in colony formation from progenitor cells were observed (Fig. 1). Further, benzene caused a greater proportional decrease in colony formation than in levels of differentiated WBCs and granulocytes (compare Fig. 1, B and C, to Fig. 1A), suggesting that early progenitor cells are more sensitive than are mature cells to the hematotoxic effects of benzene. This greater sensitivity of early progenitor cells is in agreement with previous findings in human cell cultures and mice (11, 12).
Fig. 1.
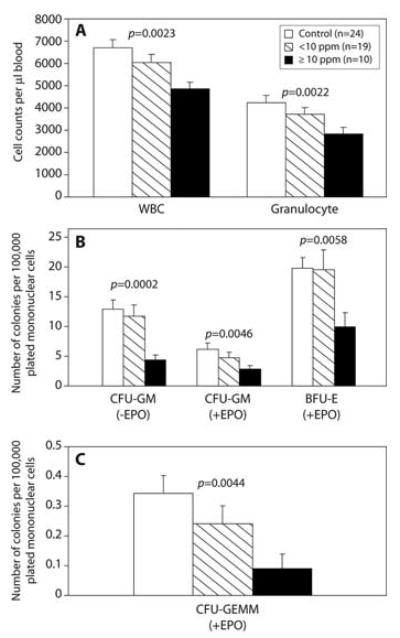
Effect of benzene exposure on (A) white blood cell (WBC) and granulocyte counts; (B) colonies from the colony-forming unit–granulocyte-macrophage (CFU-GM) and burst-forming unit–erythroid (BFU-E); and (C) colonies from the colony-forming unit–granulocyte, erythroid, macrophage, megakaryocyte (CFU-GEMM). Erythropoietin (EPO) was added to half of the cultures (9). Trends with benzene were tested by linear regression (WBC, granulocytes), negative binomial regression (CFU-GM, BFU-E), and unconditional logistic regression [CFU-GEMM, categorizing subjects into 0 or more than 0 colonies (92%, 74%, and 40% of subjects had >0 colonies among controls, <10 ppm, and ≥10 ppm, respectively)]. Models were adjusted for age and sex, and additionally for smoking, alcohol, recent infections, and body mass index (BMI) if significant (9). Strong, inverse trends between benzene and all cell types were present (Ptrend shown). There was a greater proportional decrease in colonies in workers exposed to ≥10 ppm versus controls for CFU-GM, BFU-E, and CFU-GEMM compared to the decline in WBCs (P < 0.011, 0.048, and 0.0078, respectively) and for CFU-GM and -GEMM compared to the decline in granulocytes (P = 0.026 and 0.0094, respectively) (9).
Genetic variation in enzymes responsible for activating and detoxifying benzene has been shown to confer susceptibility to benzene poisoning in highly exposed workers (6, 13, 14). We examined four nonsynonymous single-nucleotide polymorphisms (SNPs), with probable functional significance, in the CYP2E1, MPO, and NQO1 genes (9). Two genotypes significantly influenced WBC counts in benzene-exposed workers, MPO –463GG (rs2333227) (P = 0.04) and NQO1 465CT (rs4986998) (P = 0.014) (table S2). In exposed subjects who carry either one (n = 191) or both of the “at risk” genotypes (n = 11), there was a strong gene-dosage effect (Ptrend = 0.004) (table S3), which was also present among those exposed to <1 ppm (Ptrend = 0.003). Compared to a mean ± SD WBC count of 5980 ± 1420 cells/μl among subjects with neither “at risk” genotype, the WBC count was 5480 ± 1120 cells/μl among subjects with either “at risk” genotype (P = 0.006) and 4900 ± 1240 cells/μl (P = 0.039) for both genotypes, in subjects exposed to <1 ppm. Neither genotype was associated with WBC count in controls, either separately (table S2) or in combination (Ptrend = 0.94) (table S3), and the trends in exposed workers and controls were significantly different from each other (test for interaction, P = 0.03). Subjects with the MPO –463GG genotype have normal expression and had a greater decrease in WBC counts from benzene exposure compared to individuals with the GA or AA genotypes (the latter two being associated with reduced expression) (15). The functional significance of the NQO1 465C>T SNP is less clear, but it may increase alternative splicing and lower expression, thereby enhancing benzene hematotoxicity, as we observed. The other two SNPs [CYP2E1 –1053C>T (rs2031920) and NQO1 609C>T (rs1800566)] were not significantly related to WBCs (table S2).
There have been numerous studies of benzene-induced hematotoxicity (www.epa.gov/iris/toxreviews/0276-tr.pdf), but few have been able to study effects at low levels of exposure. Ward et al. (16) found no evidence of a threshold for hematotoxic effects of benzene and suggested that exposure to <5 ppm benzene could result in hematologic suppression. Occupational exposure decreased WBCs in petrochemical workers exposed to <10 ppm benzene (17), and Qu et al. reported that WBCs and other cell types were decreased in workers exposed to <5 ppm benzene (18). In contrast, Collins et al. (19, 20) and Tsai et al. (21) did not detect decreased blood cell counts based on routine monitoring of workers exposed to low levels of benzene.
The present study showed that total WBCs, granulocytes, lymphocytes, B cells, and platelets significantly declined with increasing benzene exposure and were lower in workers exposed to benzene at air levels of 1 ppm or less compared to controls. Our findings are particularly robust because we carried out extensive exposure assessment over a 16-month period (8) and linked individual air-monitoring data to the endpoints measured. Further, we showed that benzene exposure decreased colony formation from myeloid progenitor cells, and that these progenitors were more sensitive to benzene toxicity than were mature WBCs. Finally, genetic variation in MPO and NQO1 conferred susceptibility to benzene-induced lowering of WBC counts. Although confirmation of these findings in other studies is needed, these data provide evidence that benzene causes hematologic effects at or below 1 ppm, particularly among susceptible subpopulations.
Footnotes
Supporting Online Material
www.sciencemag.org/cgi/content/full/306/5702/1774/DC1, Materials and Methods, SOM Text, Fig. S1, Tables S1 to S3., References
References
- 1.Aksoy M. Environ Health Perspect. 1989;82:193. doi: 10.1289/ehp.8982193. [DOI] [PMC free article] [PubMed] [Google Scholar]
- 2.Gist GL, Burg JR. Toxicol Ind Health. 1997;13:661. doi: 10.1177/074823379701300601. [DOI] [PubMed] [Google Scholar]
- 3.Simon V, et al. Sci Total Environ. 2004;334–335:177. doi: 10.1016/j.scitotenv.2004.04.065. [DOI] [PubMed] [Google Scholar]
- 4.Yoon BI, et al. Exp Hematol. 2001;29:278. doi: 10.1016/s0301-472x(00)00671-8. [DOI] [PubMed] [Google Scholar]
- 5.Ross D. Eur J Haematol Suppl. 1996;60:111. doi: 10.1111/j.1600-0609.1996.tb01656.x. [DOI] [PubMed] [Google Scholar]
- 6.Rothman N, et al. Cancer Res. 1997;57:2839. [PubMed] [Google Scholar]
- 7.Bauer AK, et al. Cancer Res. 2003;63:929. [PubMed] [Google Scholar]
- 8.Vermeulen R, et al. Ann Occup Hyg. 2004;48:105. doi: 10.1093/annhyg/meh017. [DOI] [PubMed] [Google Scholar]
- 9.Materials and methods are available as supporting material on Science Online.
- 10.Kreja L, Greulich KM, Fliedner TM, Heinze B. Int J Radiat Biol. 1999;75:1241. doi: 10.1080/095530099139395. [DOI] [PubMed] [Google Scholar]
- 11.Smith MT, et al. Carcinogenesis. 2000;21:1485. [PubMed] [Google Scholar]
- 12.Abernethy DJ, Kleymenova EV, Rose J, Recio L, Faiola B. Toxicol Sci. 2004;79:82. doi: 10.1093/toxsci/kfh095. [DOI] [PubMed] [Google Scholar]
- 13.Wan J, et al. Environ Health Perspect. 2002;110:1213. doi: 10.1289/ehp.021101213. [DOI] [PMC free article] [PubMed] [Google Scholar]
- 14.Xu JN, et al. Zhonghua Lao Dong Wei Sheng Zhi Ye Bing Za Zhi. 2003;21:86. [PubMed] [Google Scholar]
- 15.Winterbourn CC, Vissers MC, Kettle AJ. Curr Opin Hematol. 2000;7:53. doi: 10.1097/00062752-200001000-00010. [DOI] [PubMed] [Google Scholar]
- 16.Ward E, et al. Am J Ind Med. 1996;29:247. doi: 10.1002/(SICI)1097-0274(199603)29:3<247::AID-AJIM4>3.0.CO;2-N. [DOI] [PubMed] [Google Scholar]
- 17.Zhang B. Zhonghua Yu Fang Yi Xue Za Zhi. 1996;30:164. [PubMed] [Google Scholar]
- 18.Qu Q, et al. Am J Ind Med. 2002;42:275. doi: 10.1002/ajim.10121. [DOI] [PubMed] [Google Scholar]
- 19.Collins JJ, et al. J Occup Med. 1991;33:619. [PubMed] [Google Scholar]
- 20.Collins JJ, Ireland BK, Easterday PA, Nair RS, Braun J. J Occup Environ Med. 1997;39:232. doi: 10.1097/00043764-199703000-00013. [DOI] [PubMed] [Google Scholar]
- 21.Tsai SP, et al. Regul Toxicol Pharmacol. 2004;40:67. doi: 10.1016/j.yrtph.2004.05.010. [DOI] [PubMed] [Google Scholar]
- 22.Zeger SL, Liang KY. Biometrics. 1986;42:121. [PubMed] [Google Scholar]
- 23.We thank the participants for taking part in this study. Supported by NIH grants RO1ES06721, P42ES04705, and P30ES01896 (M.T.S.), P42ES05948 and P30ES10126 (S.M.R.), and NIH contract N01-CO-12400 with SAIC-Frederick, Inc. M.T.S. has received consulting and expert testimony fees from law firms representing both plantiffs and defendants in cases involving exposure to benzene. G.L. has received funds from the American Petroleum Institute for consulting on benzene-related health research.