

Abstract
The Ca2+-sensitive photoprotein aequorin and the new green fluorescent protein-based fluorescent Ca2+ indicators ‘ratiometric-pericam’ were selectively expressed in the mitochondria, cytosol and/or nucleus of spontaneously beating ventricular myocytes from neonatal rats. This combined strategy reveals that mitochondrial [Ca2+] oscillates rapidly and in synchrony with cytosolic and nuclear [Ca2+]. The Ca2+ oscillations were reduced in frequency and/or amplitude by verapamil and carbachol and were enhanced by isoproterenol and elevation of extracellular [Ca2+]. An increased frequency and/or amplitude of cytosolic Ca2+ spikes was rapidly mirrored by similar changes in mitochondrial Ca2+ spikes and more slowly by elevations of the interspike Ca2+ levels. The present data unequivocally demonstrate that in cardiac cells mitochondrial [Ca2+] oscillates synchronously with cytosolic [Ca2+] and that mitochondrial Ca2+ handling rapidly adapts to inotropic or chronotropic inputs.
Keywords: aequorin/contraction/mitochondrial Ca2+/neonatal cardiac cells/pericam
Introduction
Although mitochondrial Ca2+ transport was discovered >30 years ago, only in recent years have the various aspects of this system and its importance in cell physiology become generally accepted (Duchen, 1999). In cardiac cells, however, the role of mitochondrial Ca2+ handling is still debated; in particular, its capacity to follow the beat-to-beat changes of cytosolic calcium concentration ([Ca2+]c). Two major factors have contributed to the controversy. First, given the low affinity of the mitochondrial Ca2+ uptake mechanism, it was difficult to envisage how these organelles could respond adequately to the relatively small amplitude of [Ca2+]c changes observed under normal physiological conditions (Fry et al., 1984). This objection has been largely overcome by the demonstration that in many cells, including cardiomyocytes, the strategic location of mitochondria close to the Ca2+ release channels (and therefore to micro-domains of very high [Ca2+]c), permits substantial mitochondrial Ca2+ uptake, despite modest average changes in [Ca2+]c (Rizzuto et al., 1993; Robert et al., 2001). In agreement with this, Ramesh et al. (1998) showed that in adult cardiac cells the Ca2+ release induced by caffeine generates micro-domains of elevated [Ca2+]c that can be high enough to be sensed by neighboring mitochondria even in the presence of high doses of a cytosolic Ca2+ buffer. Secondly, kinetic measurements obtained in isolated mitochondria suggested that the uniport/antiport system was too slow to respond in the 150–200 ms range that is typical of [Ca2+]c changes (Gunter et al., 1998). In addition, the newly discovered RaM system (rapid mode of uptake) required >60 s to recover after a Ca2+ pulse, thus rendering this mechanism inadequate for a rapid and repetitive transmission of cytosolic Ca2+ variations into mitochondria (Buntinas et al., 2001). In intact cardiac cells, measurements of mitochondrial calcium concentrations ([Ca2+]m), have led to conflicting results as to the possible beat-to-beat variations in [Ca2+]m, depending on the techniques and species used (Griffiths, 1999; for a recent review see Huser et al., 2000). Several groups showed that [Ca2+]m can be monotonically raised to 600–750 nM with combined β-adrenergic and electrical stimulations, but no repetitive oscillations were observed under these conditions (Miyata et al., 1991; Di Lisa et al., 1993; Griffiths et al., 1997). On the contrary, Isenberg et al. (1993) were the first to provide evidence for oscillatory changes in total mitochondrial calcium during the contraction–relaxation cycle using electron probe microanalysis. Their conclusions were later supported by experiments performed with fluorescent indicators (Chacon et al., 1996; Trollinger et al., 2000). Thus, while it is now largely accepted that mitochondrial Ca2+ transport can be activated in cardiac cells when either the sarcoplasmic reticulum Ca2+ release is pharmacologically stimulated or [Ca2+]c is continuously elevated above a threshold level, it still remains highly controversial whether [Ca2+]m can respond to the rapid [Ca2+]c changes occurring during each cycle of contraction (Huser et al., 2000). The major obstacle to reaching a definitive conclusion depends on the methodologies that have been employed to measure [Ca2+]m. In the studies mentioned above, fluorescent Ca2+ indicators have been loaded into cells and within mitochondria via their membrane- permeable AM esters. These dyes accumulate in mitochondria to different extents: indo-1 = fura-2 < rhod-2. Invariably these probes are also present in the cytosol and several approaches have been used to selectively remove them from the cytosolic compartment. In addition, the dyes accumulate in organelles other than mitochondria, hampering the interpretation of the fluorescence changes. These fluorescent dyes also present other problems, such as (i) their Ca2+-buffering capacity, (ii) possible effects of the AM hydrolysis products on mitochondrial physiology and (iii) movement artifacts (Takahashi et al., 1999).
Increases of [Ca2+]m are pivotal in the activation of mitochondrial dehydrogenases and thus are essential for adjusting ATP production to cardiac needs during contraction (Hansford et al., 1998; Jouaville et al., 1999). On the other hand, given that [Ca2+]c oscillates on a beat-to-beat basis, it remains unclear how this cytosolic information is transmitted to mitochondria. In other words, are the rapid cytosolic Ca2+ changes transmitted as slow tonic increases or as synchronous oscillations of [Ca2+]m?
In the present work we have sought to address two questions. First, do beat-to-beat [Ca2+]m changes occur? And, secondly, if so, are these capable of adapting to physiological changes in [Ca2+]c imposed by chronotropic and inotropic stimuli?
To this end, we adopted a novel methodological approach, combining genetically encoded targeted Ca2+ probes, aequorins and pericams, with spontaneously contracting neonatal cardiomyocytes in culture. The results obtained with this system demonstrate that: (i) mitochondria display repetitive oscillations in their [Ca2+]m; (ii) these oscillations are synchronous with [Ca2+]c changes; and (iii) the [Ca2+]m oscillations are sensitive to modulations of the amplitude and frequency of [Ca2+]c changes.
Results
Expression and subcellular distribution of recombinant aequorins in neonatal cardiac cells
A prerequisite of this study was finding a protocol that allowed the expression of aequorin chimeras at sufficiently high levels to obtain an acceptable signal-to-noise ratio in neonatal cardiac cells. Several classical transfection protocols (calcium phosphate, electroporation, liposomes, etc.) have been tested with unsatisfactory results. This difficulty was overcome by the use of FuGENE 6, a lipid-based, non-liposomal transfection reagent. With this procedure, we obtained ∼10% of transfected cells, the morphology and spontaneous contractions of which were indistinguishable from those of their non-transfected counterparts. We employed two aequorin constructs: the first, cyt-Aeq, localizes to the cytoplasm, whereas the other, mit-Aeq, is targeted specifically to the mitochondrial matrix (Rizzuto et al., 1993, 1996). The distribution of mitochondrial aequorin and of the untargeted aequorin was tested by immunocytochemistry with specific antibodies (data not shown) and also by transfecting the cells with constructs where the aequorin sequence was substituted by that encoding green fluorescent protein (GFP). We have previously shown that the subcellular localization of mit-GFP and mit-Aeq is identical (Rizzuto et al., 1996). As for all other cell types tested thus far, cytosolic GFP or aequorin were diffusely distributed in the cytosol and the nucleus (not shown). Figure 1A shows that cardiomyocytes transfected with the mitochondrial- targeted GFP expressed the fluorescent protein exclusively within elongated organelles with the characteristic morphology of mitochondria. Quantitative analyses of the confocal image showed that the fluorescent signal in regions corresponding to the cytosol or nucleus was indistinguishable from background (Figure 1B). The subcellular localization of mit-Aeq was further confirmed by biochemical and functional experiments. Treatment of cardiac cells transfected with mit-Aeq with 50 µM digitonin caused the release in the supernatant of most of the cytosolic marker enzyme, lactic dehydrogenase and trace amounts of both the mitochondrial enzyme marker, citrate synthase and aequorin. Subsequent treatment with Triton X-100 released in the second supernatant equal percentages of the mitochondrial marker citrate synthase and of the total aequorin content (Table I). Functional evidence for the localization of aequorin exclusively in the mitochondrial matrix was then explored (Figure 1). Cells expressing mitochondrial- or cytosolic-targeted aequorin were stimulated with angiotensin II. The peptide triggered a rapid and transient [Ca2+] increase in both compartments (Figure 1C and D). In the presence of the mitochondrial uncoupler FCCP the increase of [Ca2+]m was blocked while that of [Ca2+]c was unaffected. Based on these data, it can be concluded that the percentage of mitochondrial aequorin mistargeted to the cytosol is undetectable.
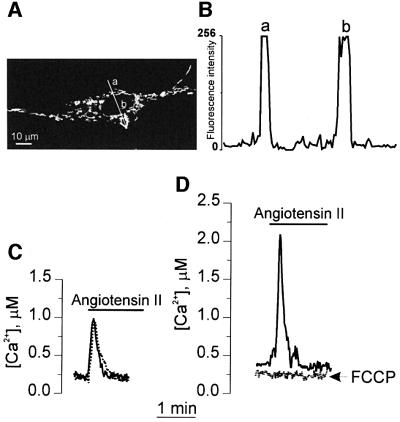
Fig. 1. Subcellular distribution of mitochondria-targeted aequorin. (A) Image of a cardiomyocyte expressing mit-GFP obtained by confocal microscopy (Rizzuto et al., 1996). The subcellular distribution of mit-GFP is indistinguishable from that of mit-Aeq. The profile of the fluorescent intensity along the line depicted in (A) is presented in (B); a and b are regions corresponding to the mitochondria as presented in (A). The level of fluorescence in regions of the cytoplasm devoid of mitochondria and in the nuclear region was indistinguishable from the level of fluorescence in non-transfected cells and was at least 50 (or more)-fold lower than in regions rich in mitochondria. The kinetics of [Ca2+]c (C) and [Ca2+]m (D) changes following stimulation with 1 µM angiotensin II are presented, in the presence (dotted trace) and absence (continuous trace) of 4 µM FCCP. In this experiment the cells were plated at low density to avoid the formation of a syncytium, the signal was integrated for 1 s and calibrated in terms of [Ca2+] as described by Brini et al. (1995). Under these conditions the oscillatory pattern of [Ca2+] is not evident.
Table I. Release of marker enzymes and mitochondrial aequorin by digitonin and Triton X-100.
| Supernatant after digitonin (% of total) | Supernatant after Triton (% of total) | |
|---|---|---|
| Lactate dehydrogenase | 91.6 ± 1.1 | 8.4 ± 0.8 |
| Citrate synthase | 4.9 ± 0.4 | 95.1 ± 2.1 |
| Aequorin | 4 ± 1 | 96 ± 2 |
The experimental conditions are described in Materials and methods. Values are expressed as percentage of enzymatic activity and aequorin content (n = 3).
Reconstitution efficiency of targeted aequorin
In order to obtain functional aequorin, the expressed apoprotein moiety must be reconstituted with its coenzyme, coelenterazine; this is added to the medium and freely diffuses into the cell. The efficiency of reconstitution depends not only on the incubation time and coelenterazine concentration, but also on the level of Ca2+ in the compartment where aequorin is localized (Robert et al., 2000). In all cell types tested thus far, reconstitution of the apoprotein in the cytosol and mitochondria is highly efficient in saline solutions or media containing physiological [Ca2+]; this is as expected, given the very low (100–200 nM) and stable levels of Ca2+ in these compartments under unstimulated conditions (Rizzuto et al., 1993). The situation in cardiomyocytes, however, is different. These cells undergo continuous spontaneous contractions, driven by transient increases in [Ca2+]c. In order to verify whether the efficiency of reconstitution could provide indirect information on the level of Ca2+ in the cytosol, two protocols of reconstitution with coelenterazine were compared; in one, a saline solution containing 1 mM CaCl2 was used, whereas in the other the CaCl2 was omitted and 100 µM EGTA was used instead. The two protocols were applied to two different cell types, HeLa cells and cardiomyocytes, i.e. cells whose resting [Ca2+]c is stable (HeLa) or oscillates (cardiomyocytes). Figure 2A shows the results obtained with cyt-Aeq. The total number of luminescence counts (reflecting the efficiency of reconstitution) was practically identical in HeLa cells, independent of the [Ca2+] in the medium. In the case of cardiomyocytes, these levels were significantly different; ∼30% lower in media containing 1 mM CaCl2.
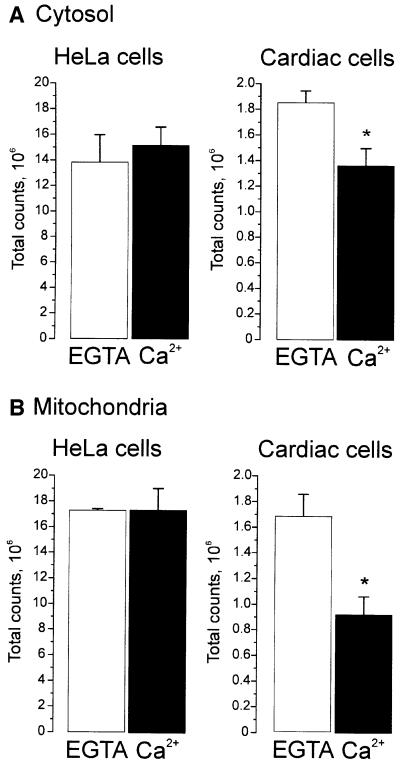
Fig. 2. Reconstitution efficiency of targeted aequorins. HeLa cells and cardiomyocytes were transfected with chimeras that encode aequorin targeted either to the cytosol (A) or to mitochondria (B). Reconstitution of the functional aequorin was carried out, as described in detail in Materials and methods, by incubating the cells with coelenterazine in saline medium containing either CaCl2 or EGTA. After 1 h of incubation, the total light output was measured by lysing the cells with digitonin, in the presence of 10 mM CaCl2. *p <0.05. Values are mean ± SD (n = 8).
The question then arises as to whether cells expressing mit-Aeq are subjected to a similar phenomenon. Figure 2B shows that the efficiency of reconstitution of mit-Aeq in HeLa cells was unaffected by the presence of extracellular Ca2+. In cardiac myocytes however, the total amount of luminescence obtainable was again reduced (this time by ∼45%) when cells were reconstituted in the presence of Ca2+ as compared with parallel batches of cells that were reconstituted in Ca2+-free solution.
Spontaneous repetitive elevations of [Ca2+]c and [Ca2+]m in beating cardiac cells
The reduced efficacy of reconstitution in contracting cells may reflect either a higher steady state level or beat-to-beat changes in [Ca2+]m. The direct approach to the problem would be to measure [Ca2+]m in single cells. This is technically very demanding and the level of recombinant photoprotein that can be obtained in cardiomyocytes is too low for this technique to be applicable with an adequate time resolution. To bypass this limitation, we took advantage of the fact that when cardiomyocytes are plated at confluence, the vast majority of cells contract synchronously (Kucera et al., 2000). Under these conditions, the cells behave as a syncytium and the average signal measured over the entire cell population closely reflects the behavior of each single cell. To confirm the validity of this system, we used cyt-Aeq to measure the well described Ca2+ oscillations in contracting cardiomyocytes. After the step of reconstitution with coelenterazine under Ca2+-free conditions, the light output of the whole population was analyzed without added stimuli; the light output was fairly constant, with a background noise of ∼10 counts/50 ms (Figure 3A). Addition of 1 mM CaCl2 resulted in a transient increase in photon emission. Following this initial peak, the average luminescence signal was characterized by rapid regular spikes, the amplitude and frequency of which varied slightly in different experiments. Figure 3B shows that the amplitude of these spikes increased if the extracellular [Ca2+] was raised from 1 to 2 or 4 mM. The kinetics of cytoplasmic Ca2+ changes were monitored in parallel batches of cells loaded with fura-2 and found to match the results obtained with cyt-Aeq (data not shown).
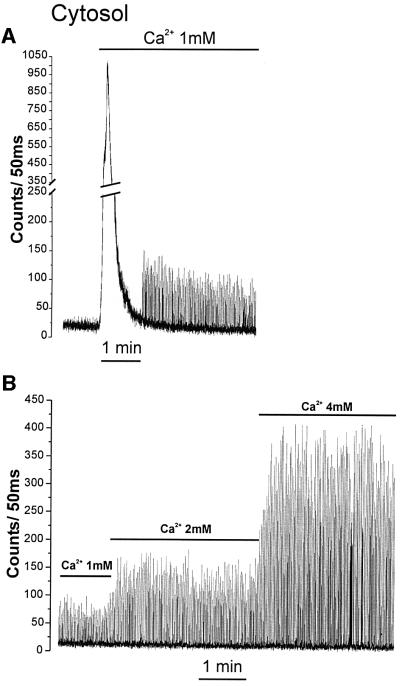
Fig. 3. Effect of extracellular [Ca2+] on cytosolic Ca2+ oscillations. Cells were transfected with cyt-Aeq. Reconstitution with coelenterazine was carried out in Ca2+-free medium. Where indicated, 1, 2 or 4 mM CaCl2 was added to the perfusion medium. On the ordinate, the aequorin luminescence (counts/50 ms) is presented.
A similar oscillatory behavior was displayed by cells expressing mit-Aeq. Addition of 1 mM CaCl2 resulted in a large luminescence peak, followed by spontaneous spikes (Figure 4A). Progressive elevation of extracellular [Ca2+] increased the amplitude of the Ca2+ spikes also in the mitochondria (Figure 4B). One aspect differentiates this pattern from that observed in the cytosol: there was an increased interspike luminescence level with increasing extracellular [Ca2+]; this was particularly evident when cells were perfused with 4 mM CaCl2. Both cytosolic and mitochondrial Ca2+ spikes were abolished by 20 µM verapamil (Figure 5). Representative traces are shown with an expanded time scale in Figure 6. In the case of cytosolic luminescence spikes, the peak was reached in ∼50–100 ms, while the decay phase took 100–150 ms. Given the time resolution of our measuring apparatus (1 data point every 50 ms) these values are only approximate. The mitochondrial spikes show somewhat slower kinetics; ∼100–150 ms to reach the peak and 200–300 ms to return close to basal levels. Increasing the extracellular [Ca2+] only marginally modified the kinetics of [Ca2+]m rise, but the decay time at high extracellular [Ca2+] showed a clear increase, thus accounting for the ‘diastolic’ increase in [Ca2+]m observed at 4 mM CaCl2. With the present system, it is difficult to correctly correlate luminescence and absolute Ca2+ concentrations. This is primarily due to the impossibility of determining the exact proportion of transfected cells that contract synchronously in individual experiments. If, however, one assumes that all transfected cells contract synchronously, a lower limit can be calculated. Given this assumption, we determined that at 2 mM CaCl2 in the medium the cytosolic and mitochondrial Ca2+ spikes reach values of 0.72 ± 0.09 µM and 0.36 ± 0.03 µM (n = 8), respectively. This latter value may be a further underestimate of the true [Ca2+]m peaks if, as reported in other cells, a microheterogeneity exists among mitochondria of individual cells (Montero et al., 2000).
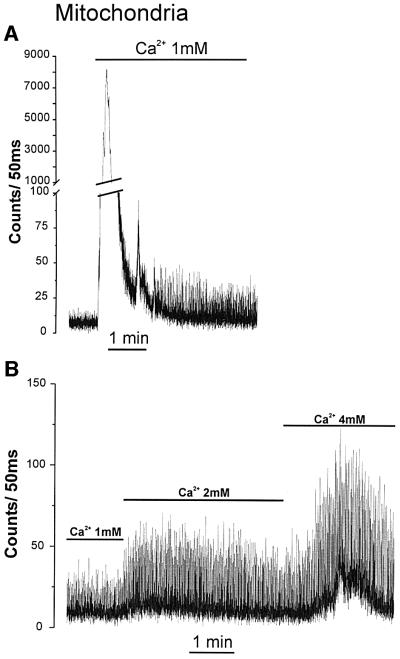
Fig. 4. Effect of extracellular [Ca2+] on mitochondrial Ca2+ oscillations. Cells were transfected with mit-Aeq. Other conditions are as in Figure 3.
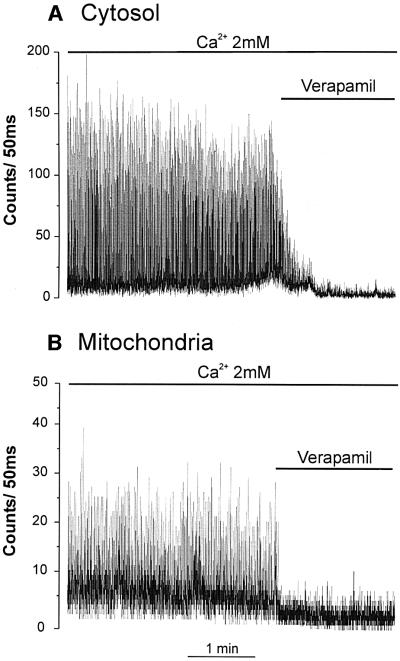
Fig. 5. Effect of verapamil on cytosolic (A) and mitochondrial (B) Ca2+ oscillations. The perfusion buffer contained 2 mM CaCl2. Where indicated, 20 µM verapamil was added.
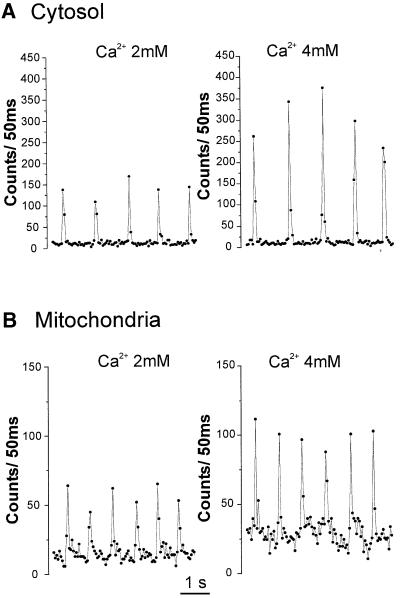
Fig. 6. Fast kinetic analysis of cytosolic (A) and mitochondrial (B) Ca2+ oscillations. The data are details of the kinetics shown in Figure 4 and are presented on an expanded time scale.
Inhibitors of the uniporter such as Ruthenium Red or Ru360 were totally inefficient in intact cells. Upon permeabilization of the plasma membrane with digitonin, however, both drugs completely blocked mitochondrial Ca2+ uptake. This implies that, unlike their adult counterparts, neonatal cardiomyocytes are impermeant to these drugs (Matlib et al., 1998). Uncouplers in the absence or presence of oligomycin resulted in a complete block not only of mitochondrial spiking but, after a delay of a few seconds, also of the cytoplasmic oscillations (data not shown).
Effects of inotropic and chronotropic stimuli on [Ca2+]m
One major question is whether mitochondrial Ca2+ spikes could be modulated by physiological stimuli that modify the amplitude or the frequency of the contraction– relaxation cycles. To this end, we first recorded the effect of isoproterenol, a β-adrenergic agonist that displays positive inotropic and chronotropic effects. Cells transfected either with cyt-Aeq or mit-Aeq (and perfused with 2 mM CaCl2), showed an augmentation of both spike amplitude and frequency when treated with isoproterenol (Figure 7). In mitochondria, the increase in frequency was always accompanied by an increase in the interspike level. Statistical analyses of different cell preparations showed that the average frequency of the spikes in unstimulated conditions was ∼1 Hz for both compartments; the increase in frequency induced by isoproterenol (∼50%) was again indistinguishable in the two compartments (Figure 8). As for the changes in spike amplitude caused by isoproterenol, the average increase observed in the cytosol was >2-fold, whereas in mitochondria a more modest increase (∼70%) was seen (data not shown). The effect of carbachol, a muscarinic agonist that evokes negative chronotropic and inotropic effects, was then explored. Figure 9 shows that carbachol reduced the amplitude and frequency of both cytoplasmic and mitochondrial Ca2+ oscillations.
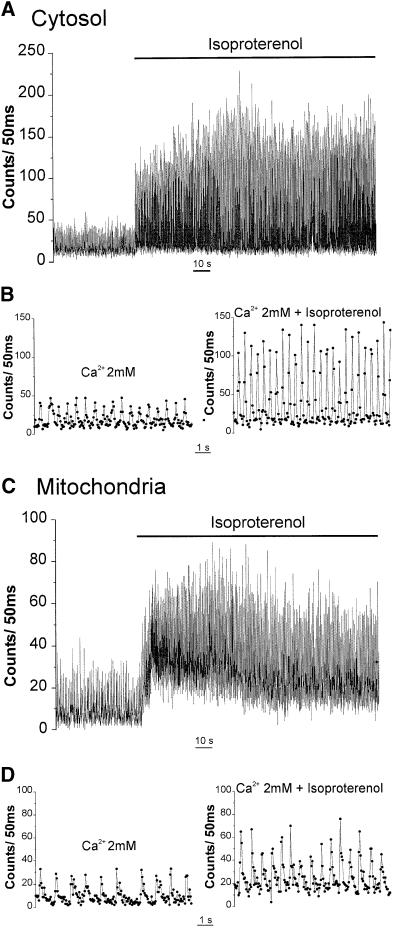
Fig. 7. Effect of isoproterenol on cytosolic (A and B) and mitochondrial (C and D) Ca2+ oscillations. In (B) and (D) part of the kinetics of (A) and (C), respectively, are presented on an expanded time scale. Where indicated, 1 µM isoproterenol was added. The medium contained 2 mM CaCl2.
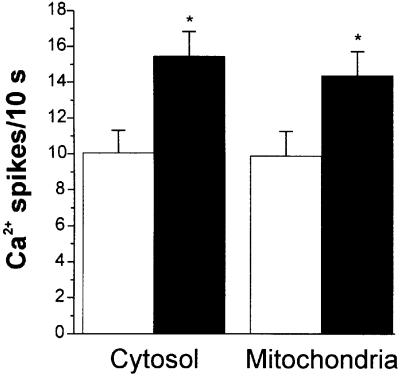
Fig. 8. Average frequency of cytosolic and mitochondrial Ca2+ spikes before (white column) and after (black column) isoproterenol (1 µM) addition. Values are mean ± S.D. (n = 8). *p <0.05.
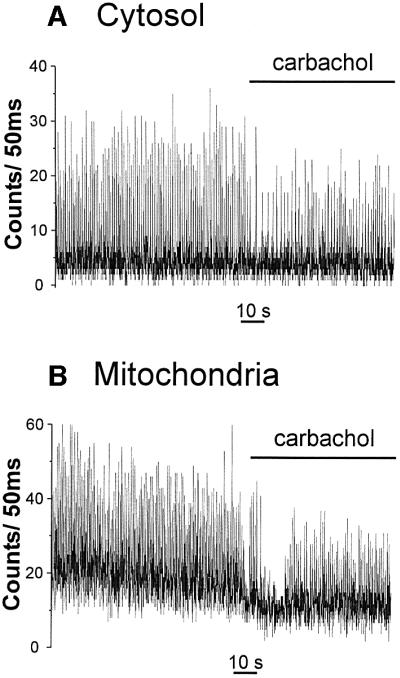
Fig. 9. Effect of 500 nM carbachol on cytosolic (A) and mitochondrial (B) Ca2+ oscillations. The medium contained 2 mM CaCl2. Other conditions are as in Figures 3 and 4.
Cytoplasmic and mitochondrial Ca2+ oscillations in single cells
The major limitation of aequorin in our conditions is the necessity of comparing mitochondrial and cytosolic Ca2+ oscillations in parallel batches of cells. To overcome this problem, we took advantage of a new family of GFP- derived Ca2+ indicators called pericams, recently described by Nagai et al. (2001). These probes are genetically encoded and can be targeted with high selectivity to different compartments, including the mitochondrial matrix. One of the pericams, called ‘ratiometric-pericam’ changes its excitation spectrum upon Ca2+ binding and can be used as a ‘ratiometric’ probe. Correct localization of the mitochondrial Ca2+ probe was verified by morphometric analysis (Figure 10A). The frequency of mitochondrial Ca2+ oscillations (on average 1 Hz), as measured in single cells, was indistinguishable from that measured with aequorin, although the decay of the [Ca2+]m spike toward basal level was less sharp than that revealed by aequorin (Figure 1B). To directly prove that the oscillations of cytosolic and mitochondrial [Ca2+] are synchronous, cells were cotransfected with two ratiometric-pericams, one targeted to the mitochondria and the other to the nucleus. A nuclear pericam was preferred to a cytoplasmic one because the signals coming from the two compartments can be monitored simultaneously and are not spatially overlapped. It has been previously shown in several cell types that the kinetic delay between nucleoplasmic and cytoplasmic [Ca2+] changes is very short (Lipp et al., 1997) and we have confirmed this observation in cardiomyocytes using fura-2 (not shown). The [Ca2+] of both compartments oscillated in close synchronicity. The effect of verapamil, EGTA, carbachol and isoproterenol was also studied in cells expressing the pericams and the results were identical to those obtained with aequorin.11
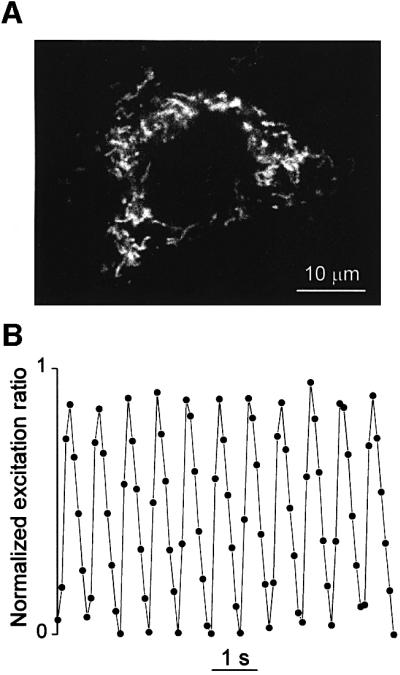
Fig. 10. Spontaneous [Ca2+] oscillations measured with ‘ratiometric-pericams’ targeted to the mitochondria. Typical image of a neonatal cardiac cell expressing the ratiometric-pericam targeted to the mitochondria (A). The cell was illuminated at 415 nm for 200 ms. (B) The cells were illuminated in sequence for 50 and 20 ms at 415 and 490 nm. The emitted light (at 510 nm) was collected and the ratio between the intensities of the two images (415/490) was calculated off line. On the left side the normalized fluorescence emission ratio is presented. Normalization was carried out by setting the minimum value to 0 and the maximum peak of the 415/490 ratio to 1.
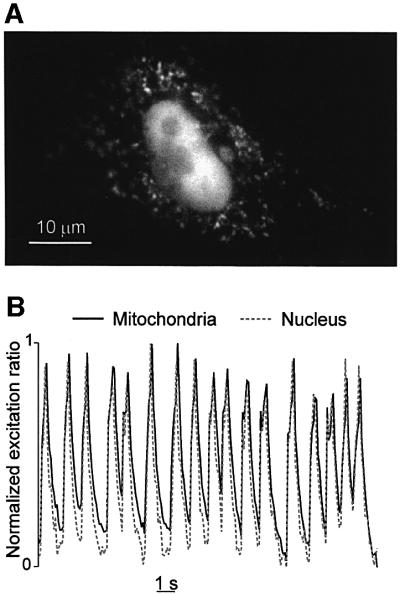
Fig. 11. Spontaneous [Ca2+] oscillations measured with ‘ratiometric-pericams’ targeted to the nucleus and the mitochondria. (A) Typical image of neonatal cardiac cells expressing both the nuclear and mitochondrial ratiometric-pericam. The cells were illuminated at 415 nm for 200 ms. (B) Time course of the 415/490 (normalized) ratio changes in both compartments. The kinetics of a region of interest taken over mitochondria or nucleus are presented as continuous or dotted lines, respectively (B). Other conditions as in Figure 10B.
Discussion
The question of whether the regulation of mitochondrial Ca2+-dependent dehydrogenases depends on tonic, low amplitude [Ca2+]m increases or on frequency modulation of [Ca2+]m spiking may have profound consequences on our understanding of the control of energy balance in physiology and possible alterations in pathology.
Given that the conflicts between models are to a large extent due to the limitations of the techniques used so far, we approached the question from a different experimental angle. To this end, we took advantage of two genetically encoded Ca2+ probes, aequorins and ratiometric-pericams, targeted to defined cellular compartments (Pozzan et al., 1994; Nagai et al., 2001). Targeted aequorin and pericam offer two main advantages compared with the classical Ca2+ indicators employed in this field: (i) they are selectively localized (the totality of the probe is confined to the mitochondrial matrix; in the case of fluorescent probes used in previous studies only a proportion of the dye labels this organelle); (ii) they minimize movement artifacts. However, the aequorin system presents one major difficulty, i.e. measuring [Ca2+] changes at the single cell level with high temporal resolution. This was overcome by the use of neonatal cardiomyocytes plated at confluence. In this condition the cells form synchronously contracting cell monolayers, driven by a focal pacemaker (Kucera et al., 2000). In practical terms, this system allows a large number of cells in culture to be treated as a single spontaneously contracting cell. In addition, it also avoids the necessity for external stimulation or the use of a stimulating electrode. The validity of our experimental model was verified by the use of an aequorin targeted to the cytosol, where the kinetics of [Ca2+]c changes are well established. The results obtained with aequorin in a cardiac cell population were complemented by those obtained at the single cell level with the recently described GFP-based Ca2+ probe ‘ratiometric-pericam’. This new genetically encoded probe is strongly fluorescent, allowing imaging of [Ca2+] changes at the single cell level. The availability of ratiometric-pericams allowed us to determine in a more direct way and in the same cells, the synchronicity between nucleoplasmic, and thus cytoplasmic oscillations, based on the observation that there is a very short delay between changes in cytoplasmic and nuclear [Ca2+] and mitochondrial [Ca2+] oscillations. Taken together, the experiments carried out with aequorin- and ratiometric-pericam-expressing cells demonstrate that [Ca2+]m oscillates in parallel with [Ca2+]c.
The observation that mitochondrial Ca2+ oscillations are modulated in frequency and amplitude by β-adrenergic and muscarinic stimulations is of major relevance. It demonstrates that mitochondrial Ca2+ transport is responsive to the most important stimuli that control inotropic and chronotropic inputs. In addition to the possibility of controlling mitochondrial Ca2+ spikes both in amplitude and frequency, this system shows a third level of control: increase of mitochondrial ‘diastolic’ [Ca2+]. This occurs when the extracellular [Ca2+] is increased, or upon isoproterenol stimulation. Cytoplasmic diastolic Ca2+ levels, on the other hand, are only marginally affected. This discrepancy between cytosolic and mitochondrial responses may be explained by the relatively slow rate of the mitochondrial efflux pathway; when the spike amplitude and/or frequency is increased this results in an incomplete Ca2+ extrusion from mitochondria during each spike and the consequent diastolic [Ca2+]m increase.
The key physiological question is the advantage conferred by such a sophisticated coupling of mitochondrial and cytosolic Ca2+. At the moment we can only speculate. The data presented show that cardiac cells possess three modes of Ca2+ communication between the cytosol and mitochondria; variations in both frequency and peak amplitude of Ca2+ spikes, as well as [Ca2+]m diastolic levels. The system is thus highly versatile, enabling these cells to respond accurately to different demands.
Frequency-encoding of the Ca2+ signal is often the preferred language of both excitable and non-excitable cells and many Ca2+-sensitive targets are designed to decode signals that vary both in frequency and in amplitude (Hajnoczky et al., 1995; Dolmetsch et al., 1998). For cardiac cells, the decoding of an increased frequency of cytosolic Ca2+ oscillations is much faster (practically within one beat) than a change in steady state amplitude (which would require several beats). Indeed the diastolic mitochondrial [Ca2+] also appears to adapt (but more slowly), to larger amplitude cytosolic Ca2+ spikings. In other words, the energy requirements imposed by a rapid and transient increase in chronotropism could hardly be coupled to an increased activity of the intramitochondrial dehydrogenases if [Ca2+]m were to vary slowly, that is, tonically, to achieve a new steady state. In addition, it can not be excluded that the local uptake by strategically located mitochondria of the Ca2+ released from the sarcoplasmic reticulum (or entering through Ca2+ channels) might be relevant for the feedback regulation by Ca2+ of the channels themselves; a similar scenario has been suggested for InsP3 receptors or CRAC channels in other model systems (Hoth et al., 1997; Hajnoczky et al., 1999).
The present results resuscitate an old question: do mitochondria contribute to the cytosolic Ca2+ buffering in beating cardiac cells (Affolter et al., 1976)? If this is the case, then mitochondrial Ca2+ uptake and release might modify excitation–contraction coupling and, thus, the mechanical activity of cardiomyocytes. At present, the available data can not provide an answer to this question, because: (i) Ca2+ probes measure the free Ca2+ within the mitochondrial matrix, but the amount of calcium sequestered by mitochondria cannot be assessed in the absence of information concerning the ratio between the free and total forms of this cation within mitochondria; (ii) owing to impermeability of these cardiomyocytes to Ruthenium Red, the contribution of mitochondria can not be eliminated experimentally. This limitation is reinforced by the wide range of cellular effects, well beyond the inhibition of Ca2+ transport, elicited by mitochondrial inhibitors or uncouplers.
Finally, the data presented here are also of relevance not only for cardiac physiology but, in general terms, for a better understanding of the role of mitochondrial Ca2+ accumulation in cell physiology. Up until now, mitochondrial Ca2+ handling has been shown to be involved in relatively slow processes such as stimulation of G protein-coupled receptors or prolonged opening of Ca2+ channels (Rizzuto et al., 1993; Montero et al., 2000; Szalai et al., 2000). The present findings directly demonstrate that brief, physiologically relevant stimuli, such as cardiac action potentials, result in a significant Ca2+ accumulation by mitochondria. They also reveal that the frequency and amplitude of mitochondrial Ca2+ changes can be modulated by physiological stimuli. In light of this, the kinetics of mitochondrial Ca2+ handling appear perfectly suited to cope with the rapid [Ca2+]c changes (in the few millisecond range) that occur not only in cardiomyocytes, but also in many other excitable cells, primarily neurones.
Materials and methods
Cell culture
Cultures of cardiomyocytes were prepared from ventricles of Wistar rats (0–3 days after birth) as previously described (Dostal et al., 1992). The heart was removed and rapidly placed in ice-cold HEPES-buffered saline containing 116 mM NaCl, 0.8 mM NaH2PO4, 5.3 mM KCl, 0.4 mM MgSO4, 5 mM glucose and 20 mM HEPES pH adjusted to 7.35. Atria were discarded and ventricles were submitted to four subsequent digestions with 0.45 mg/ml collagenase and 5% pancreatin. The first supernatant containing cell debris and blood cells was discarded. Cell suspensions from the three subsequent digestions (20 min each) were centrifuged and the pellet was resuspended in 2 ml of newborn calf serum. Cells were pooled and resuspended in a complete medium DMEM/Medium 199 (4:1) supplemented with 2 mM glutamine, penicillin (100 U/ml), streptomycin (100 mg/ml), 5% newborn calf serum and 10% horse serum. Cells were then incubated for 1 h at 37°C, allowing a selective attachment of non-myocytes. The unattached cells were plated at a density of 0.6 × 10⁶ cell/ml onto 13 or 24 mm diameter coverslips coated with laminin (1 µg/cm2). The first day of culture, cells were washed and maintained in DMEM/Medium 199 (4:1) medium containing 5% horse serum and 0.5% newborn calf serum for 3 days. HeLa cells were grown in DMEM medium supplemented with 10% fetal calf serum in 75 cm2 Falcon flasks. Two days before transfection, cells were seeded onto 13 mm diameter coverslips to be used for Ca2+ measurement.
cDNA constructs and transfection
The different constructs have been described in detail previously (Rizzuto et al., 1993, 1996; Nagai et al., 2001). Transfections were carried out on the first day of culture using the FuGENE 6 reagent (Roche). For a 13 mm diameter coverslip, 1.5 µg of DNA was mixed with 3 µl of Fugene reagent. All the volumes were doubled for transfection of cells plated onto 24 mm diameter coverslips. All the experiments were then performed at day 3 after transfection.
Aequorin measurements
For the cells transfected with the cyt-Aeq and the mit-Aeq constructs, reconstitution of the functional aequorin was carried out in a modified Krebs–Ringer buffer (125 mM NaCl, 5 mM KCl, 1 mM Na3PO4, 1 mM MgSO4, 5.5 mM glucose and 20 mM HEPES pH 7.4) in the presence of either 100 µM EGTA or 1 mM CaCl2 supplemented with 1% serum and 5 µM coelenterazine for 1 h at 37°C. After the reconstitution step, the cells were placed in a perfused, thermostated chamber in close proximity to a low noise photomultiplier, with a built in amplifier discriminator. The output of the discriminator was captured by a Thorn-EMI photon counting board and stored in an IBM compatible computer for further analysis. Aequorin photon emission was calibrated off line into [Ca2+] values using a computer algorithm based on the Ca2+ response curve, as described previously (Brini et al., 1995). While in previous experiments light output was integrated for 1 s, in all the present experiments (except those shown in Figure 1C and D) the maximum speed of data collection of the apparatus was employed, i.e. collection every 50 ms. The calibration was modified accordingly. When typical traces are presented they are representative of experiments carried out on at least three different cell cultures. Possible interference of oxygen radicals on aequorin luminescence was verified by treating the cells with the cell permeant antioxidant Trolox (10 µM) that has been proven previously to prevent oxygen radical effects on indo-1 fluorescence (Scheenen et al., 1996). No effect of this compound on the kinetics of aequorin luminescence was observed.
Determination of the subcellular distribution of recombinant aequorin
After reconstitution with coelenterazine according to the standard protocol, the cells were treated for 5 min with 50 µM digitonin in Ca2+-free medium containing 1 mM EGTA and the first supernatant was collected. The same cells were further treated for 15 min with 0.1% Triton X-100 and the second supernatant was collected. The aequorin and the enzyme markers released in each supernatant were measured according to standard procedures. The activity of lactate dehydrogenase and of citrate synthase were followed spectrophometrically (Martin and Denton, 1970). Light emission of aequorin was measured with a Labtech luminometer after the addition of 2 mM CaCl2.
Determination of [Ca2+] changes with the ratiometric-pericams
Cells expressing the mitochondrial and nuclear ratiometric-pericams were analyzed by videoimaging using the Till Photonics GmbH system. Cells were illuminated alternatively for 40 and 20 ms at 415 and 480 nm and the emitted light was filtered at 510 nm. The ratio images were calculated off line (1 ratio image every 92 ms) in different regions of interest corresponding to groups of mitochondria and/or the nucleoplasm.
Immunocytochemistry and GFP fluorescence
Cells plated on gelatin-coated glass coverslips were fixed with 4% formaldehyde for 30 min. Fixed cells were permeabilized with Triton X-100 0.5% for 5 min and were subsequently labeled with the anti-HA1 mouse monoclonal antibody 12CA5 (Balco, Berkeley CA) and the rabbit anti-mouse FITC (Vector Laboratories, Burlingame CA). Immunostained cells or cells expressing GFP were observed with a Bio-Rad confocal microscope.
Statistical analysis
Data are reported as means ± S.D. Statistical differences were evaluated by a one-tailed Student’s t-test, with a p value <0.05 being considered statistically significant.
Acknowledgments
Acknowledgements
We are grateful to M.Zaccolo and P.Magalhães for help with microscope analyses and helpful discussions. We thank M.Colella, R.Menabo, G.Ronconi and M.Santato for technical assistance, F.Marotte for advice on the preparation of neonatal cardiac cells, and J.Alvarez for providing the computer program used in the analysis of aequorin light emission. This work was supported by grants from Telethon numbers 845 and 1226, from the Italian Association for Cancer Research (AIRC) ACC990092 and 98130471, the UE (2000–934), the Italian Minister of University and Scientific Research (MURST), the Italian CNR ‘Target Project Biotechnology’, the Armenise Harvard Foundation, and the European Society of Aldosterone Council to Tullio Pozzan and a grant from Italian CNR 9902453.CT04 to F.d.L.
References
- Affolter H., Chiesi,M., Dabrowska,R. and Carafoli,E. (1976) Calcium regulation in heart cells. The interaction of mitochondria and sarcoplasmic reticulum with troponin-bound calcium. Eur. J. Biochem., 67, 389–396. [DOI] [PubMed] [Google Scholar]
- Brini M., Marsault,R., Bastianutto,C., Alvarez,J., Pozzan,T. and Rizzuto,R. (1995) Transfected aequorin in the measurement of cytosolic Ca2+ concentration [Ca2+]c: a critical evaluation. J. Biol. Chem., 270, 9896–9903. [DOI] [PubMed] [Google Scholar]
- Buntinas L., Gunter,K.K., Sparagna,G.C. and Gunter,T.E. (2001) The rapid mode of calcium uptake into heart mitochondrial (RaM): comparison to RaM in liver mitochondria. Biochim. Biophys. Acta, 1504, 248–261. [DOI] [PubMed] [Google Scholar]
- Chacon E., Ohata,H., Harper,I.S., Trollinger,D.R., Herman,B. and Lemasters,J.J. (1996) Mitochondrial free calcium transients during excitation–contraction coupling in rabbit cardiac myocytes. FEBS Lett., 382, 31–36. [DOI] [PubMed] [Google Scholar]
- Di Lisa F., Gambassi,G., Spurgeon,H. and Hansford,R.G. (1993) Intramitochondrial free calcium in cardiac myocytes in relation to dehydrogenase activation. Cardiovasc. Res., 27, 1840–1844. [DOI] [PubMed] [Google Scholar]
- Dolmetsch R.E., Xu,K. and Lewis,R.S. (1998) Calcium oscillations increase the efficiency and specificity of gene expression. Nature, 392, 933–936. [DOI] [PubMed] [Google Scholar]
- Dostal D.E., Rothblum,K.N., Conrad,K.M., Cooper,G.R. and Baker,K.M. (1992) Detection of angiotensin I and II in cultured rat cardiac myocytes and fibroblasts. Am. J. Physiol., 263, C851–C863. [DOI] [PubMed] [Google Scholar]
- Duchen M.R. (1999) Contribution of mitochondria to animal physiology: from homeostatic sensor to calcium signalling and cell death. J. Physiol., 516, 1–17. [DOI] [PMC free article] [PubMed] [Google Scholar]
- Fry C.H., Powell,T., Twist,V.W. and Ward,J.P. (1984) Net calcium exchange in adult rat ventricular myocytes: an assessment of mitochondria calcium accumulating capacity. Proc. R. Soc. Lond. B Biol. Sci., 223, 223–238. [DOI] [PubMed] [Google Scholar]
- Griffiths E.J. (1999) Species dependence of mitochondrial calcium transients during excitation–contraction coupling in isolated cardiomyocytes. Biochem. Biophys. Res. Commun., 263, 554–559. [DOI] [PubMed] [Google Scholar]
- Griffiths E.J., Stern,M.D. and Silverman,H.S. (1997) Measurement of mitochondrial calcium in single living cardiomyocytes by selective removal of cytosolic indo 1. Am. J. Physiol., 273, C37–C44. [DOI] [PubMed] [Google Scholar]
- Gunter T.E., Buntinas,L., Sparagna,G.C. and Gunter,K.K. (1998) The Ca2+ transport mechanisms of mitochondria and Ca2+ uptake from physiological-type Ca2+ transients. Biochim. Biophys. Acta, 1366, 5–15. [DOI] [PubMed] [Google Scholar]
- Hajnoczky G., Robb-Gaspers,L.D., Seitz,M.B. and Thomas,A.P. (1995) Decoding of cytosolic calcium oscillations in the mitochondria. Cell, 82, 415–424. [DOI] [PubMed] [Google Scholar]
- Hajnoczky G., Hager,R. and Thomas,A.P. (1999) Mitochondria suppress local feedback activation of inositol 1,4,5-trisphosphate receptors by Ca2+. J. Biol. Chem., 274, 14157–14162. [DOI] [PubMed] [Google Scholar]
- Hansford R.G. and Zorov,D. (1998) Role of mitochondrial calcium transport in the control of substrate oxidation. Mol. Cell. Biochem., 184, 359–369. [PubMed] [Google Scholar]
- Hoth M., Fanger,C.M. and Lewis,R.S. (1997) Mitochondrial regulation of store-operated calcium signaling in T lymphocyte. J. Cell Biol., 137, 633–648. [DOI] [PMC free article] [PubMed] [Google Scholar]
- Huser J., Blatter,L.A. and Sheu,S.S. (2000) Mitochondrial calcium in heart cells: beat-to-beat oscillations or slow integration of cytosolic transients? J. Bioenerg. Biomemb., 32, 27–33. [DOI] [PubMed] [Google Scholar]
- Isenberg G., Han,S., Schiefer,A. and Wendt-Gallitelli,M.F. (1993) Changes in mitochondrial calcium concentration during the cardiac contraction cycle. Cardiovasc. Res., 27, 1800–1809. [DOI] [PubMed] [Google Scholar]
- Jouaville L.S., Pinton,P., Bastianutto,C. and Rizzuto,R. (1999) Regulation of mitochondrial ATP synthesis by calcium: evidence for a long-term metabolic priming. Proc. Natl Acad. Sci. USA, 96, 13807–13812. [DOI] [PMC free article] [PubMed] [Google Scholar]
- Kucera J.P., Heuschkel,M.O., Renaud,P. and Rohr,S. (2000) Power-law behaviour of beat-rate variability in monolayer cultures of neonatal rat ventricular myocytes. Circ. Res., 86, 1140–1145. [DOI] [PubMed] [Google Scholar]
- Lipp P., Thomas,D., Berridge,M.J. and Bootman,M.D. (1997) Nuclear calcium signaling by individual cytoplasmic calcium puffs. EMBO J., 16, 7166–7173. [DOI] [PMC free article] [PubMed] [Google Scholar]
- Martin B.R. and Denton,R.M. (1970) The intracellular localization of enzymes in white-adipose-tissue fat cells and permeability properties of fat-cell mitochondria. Biochem. J., 117, 861–877. [DOI] [PMC free article] [PubMed] [Google Scholar]
- Matlib M.A. et al. (1998) Oxygen-bridged dinuclear ruthenium amine complex specifically inhibits Ca2+ uptake into mitochondria in vitro and in situ in single cardiac myocytes. J. Biol. Chem., 273, 10223–10231. [DOI] [PubMed] [Google Scholar]
- Miyata H., Silverman,H.S., Sollott,S.J., Lakatta,E.G., Stern,M.D. and Hansford,R.G. (1991) Measurement of mitochondrial free Ca2+ concentration in living single rat cardiac myocytes. Am. J. Physiol., 261, H1123–1134. [DOI] [PubMed] [Google Scholar]
- Montero M., Alonso,M.T., Carnicero,E., Cuchillo-Ibanez,I., Abillos,A., Garcia,A.G., Garcia-Sancho,J. and Alvarez,J. (2000) Chromaffin-cell stimulation triggers fast millimolar mitochondrial Ca2+ transients that modulate secretion. Nature Cell Biol., 2, 57–61. [DOI] [PubMed] [Google Scholar]
- Nagai T., Sawano,A., Park,E.S. and Miyawaki,A. (2001) Circularly permuted green fluorescent proteins engineered to sense Ca2+. Proc. Natl Acad. Sci. USA, 98, 3197–3202. [DOI] [PMC free article] [PubMed] [Google Scholar]
- Pozzan T., Rizzuto,R., Volpe,P. and Meldolesi,J. (1994) Molecular and cellular physiology of intracellular calcium stores. Physiol. Rev., 74, 595–636. [DOI] [PubMed] [Google Scholar]
- Ramesh V., Sharma,V.K., Sheu,S.S. and Franzini-Armstrong,C. (1998) Structural proximity of mitochondria to calcium release units in rat ventricular myocardium may suggest a role in calcium sequestration. In Cardiac Sarcoplasmic Reticulum Function, Regulation of Contractility. Annals of the New York Academy of Sciences, New York, NY, pp. 341–345. [DOI] [PubMed]
- Rizzuto R., Brini,M., Murgia,M. and Pozzan,T. (1993) Microdomains with high Ca2+ concentration that are sensed by neighboring mitochondria. Science, 262, 744–747. [DOI] [PubMed] [Google Scholar]
- Rizzuto R., Brini,M., De Giorgi,F., Rossi,R., Heim,R., Tsien,R.Y. and Pozzan,T. (1996) Double labelling of subcellular structures with organelle-targeted GFP mutants in vivo. Curr. Biol., 6, 183–188. [DOI] [PubMed] [Google Scholar]
- Robert V., Pinton,P., Tosello,V., Marsault,R., Rizzuto,R., and Pozzan,T. (2000) Recombinant aequorin as tool for monitoring calcium concentration in subcellular compartments. Methods Enzymol., 327, 440–456. [DOI] [PubMed] [Google Scholar]
- Robert V., Massimino,M.L., Tosello,V., Marsault,R., Cantini,M., Sorrentino,V. and Pozzan,T. (2001) Alteration in calcium handling at the subcellular level in mdx myotubes. J. Biol. Chem., 276, 4647–4651. [DOI] [PubMed] [Google Scholar]
- Scheenen W.J., Makings,L.R., Gross,L.R., Pozzan,T. and Tsien,R.Y. (1996) Photodegradation of indo-1 and its effect on apparent Ca2+ concentrations. Chem. Biol., 3, 765–774. [DOI] [PubMed] [Google Scholar]
- Szalai G., Csordas,G., Hantash,B.M., Thomas,A.P. and Hajnoczky,G. (2000) Calcium signal transmission between ryanodine receptors and mitochondria. J. Biol. Chem., 275, 15305–15313. [DOI] [PubMed] [Google Scholar]
- Takahashi A., Camacho,P., Lechleiter,J.D. and Herman,B. (1999) Measurement of intracellular calcium. Physiol. Rev., 79, 1089–1125. [DOI] [PubMed] [Google Scholar]
- Trollinger D.R., Cascio,W.E. and Lemasters,J.J. (2000) Mitochondrial calcium transient in adult rabbit cardiac myocytes: inhibition by ruthenium red and artifacts caused by lysosomal loading of Ca2+ indicating fluorophores. Biophys. J., 79, 39–50. [DOI] [PMC free article] [PubMed] [Google Scholar]