

Abstract
Novel yeast histone mutations that confer Swi–Snf independence (Sin–) were used to investigate the mechanisms by which transcription coactivator complexes relieve chromatin repression in vivo. Derepression of the flocculation gene FLO1, which is normally repressed by the Tup1–Ssn6 corepressor, leads to its identification as a constitutive Swi–Snf-dependent gene. We demonstrate that Tup1–Ssn6 is a chromatin remodelling complex that rearranges and also orders nucleosomal arrays on the promoter and over 5 kb of upstream intergenic region. Our results confirm that the Swi–Snf complex disrupts nucleosome positioning on promoters, but reveal that it can also rearrange nucleosomes several kilobases upstream from the transcription start site. The antagonistic chromatin remodelling activities of Swi–Snf and Tup1–Ssn6 detected in an array of 32 nucleosomes upstream of FLO1 extend far beyond the scale of promoter-based models of chromatin-mediated gene regulation. The Swi–Snf coactivator and Tup1–Ssn6 corepressor control an extensive chromatin domain in which regulation of the FLO1 gene takes place.
Keywords: chromatin remodelling complexes/gene regulation
Introduction
The genome of eukaryotes is compacted into chromatin in the cell nucleus. This highly ordered structure of histone proteins and DNA consists of fibres of supercoiled nucleosomes in which the strands of DNA are tightly coiled around core octamers composed of two copies of histones H2A, H2B, H3 and H4. Since the evolution of eukaryotic genes has taken place within this largely inaccessible chromatin context, regulation mechanisms have evolved to overcome the repressive effects of chromatin structure. Gaining access to the DNA and its binding sites for transcription factors constitutes the primary level of gene regulation, without which the activation and transcription of many genes cannot occur.
An estimated 10% of the 6000 open reading frames (ORFs) in Saccharomyces cerevisiae are dedicated to transcription (Mewes et al., 1997). Genetic and biochemical evidence has pointed to an abundance of gene products accumulating at the transcription pre-initiation site, associating into several large, multiprotein regulatory complexes of up to 20 polypeptides each. Each of these megadalton-sized complexes has a distinct function such as mRNA transcription, RNA polymerase II phosphorylation, mediator and adaptor functions, but also histone acetylation and chromatin remodelling. Thus, in part, the complexity of the control of gene expression in eukaryotes is a reflection of the extra regulation that takes place at the level of chromatin architecture.
Chromatin remodelling complexes such as Swi–Snf (Cairns et al., 1994; Peterson et al., 1994) are transcription coactivators that act on particular subsets of genes. Their modular construction permits the incorporation of developmental stage-specific or tissue-specific components in higher eukaryotes, resulting in different subset coverage. On the other hand, related but biochemically distinct complexes can utilize the same modules: both the yeast RSC (remodels the structure of chromatin) and Swi–Snf complexes contain the actin-related Arp7 and Arp9 subunits (for a review see Muchardt and Yaniv, 1999).
The multiprotein regulators offer multiple sites for protein–protein interactions. Co-purifications and immunoprecipitations have physically tied the chromatin-modifying complexes to the process of transcription initiation (reviewed by Grant and Workman, 1998), and a picture is emerging of transcription initiation involving a succession of multiple interactions between multiprotein regulators and chromatin (reviewed by Struhl, 1999). The question remains of how these interactions between the RNA polymerase II holoenzyme, transcription factors, chromatin remodelling complexes and the chromatin itself determine gene activity.
The initiation events at the promoter prior to gene transcription do not take place in isolation. First, the dynamic network of associations may be connected further through actin-related proteins to the physical network of the nuclear matrix and its specialized compartments (reviewed by Wade and Wolffe, 1999). Furthermore, whereas Swi–Snf and related complexes have been shown to remodel nucleosomes in vitro, facilitating access of DNA-binding factors (Côté et al., 1994; Kwon et al., 1994), the nucleosomal array is not alone in suppressing gene activity in vivo. Specialized multiprotein and multimeric corepressors exist that associate with the chromatin structure and render genes even less accessible. Examples of chromatin-mediated repressors include the heterochromatin-inducing Polycomb group and yeast Sir proteins, methylated DNA-binding proteins and the Tup1-related WD-repeat repressors of transcription. It is not known how the remodelling activators overcome these additional repression mechanisms, or whether they can be recruited to such repressed regions of the genome.
In yeast, the Tup1–Ssn6 corepressor has widespread functions in glucose repression, the repression of mating type-specific genes, hypoxic genes and other gene sets (reviewed by Smith and Johnson, 2000). It is a 1.4 MDa complex composed of the TUP1 and SSN6 gene products in a 4:1 ratio (Varanasi et al., 1996). The Tup1–Ssn6 complex has no DNA-binding capacity, but can be recruited to chromatin through DNA sequence-specific factors, such as Mig1 at glucose-repressible genes (Treitel and Carlson, 1995). Tup1 interacts directly with histones H3 and H4 (Edmondson et al., 1996) and can also make contact with the RNA polymerase II holoenzyme com ponent Srb7p (Gromöller and Lehming, 2000).
As repressed chromatin structures are likely to extend beyond promoters, we decided that a long-range dissection of the chromatin remodelling and correlated expression of the Saccharomyces cerevisiae FLO1 gene could provide clues to the regulation of its repressed and activated chromosomal states. Employing yeast histone sin mutant strains and various deletions, we are able to demonstrate that long-range antagonistic remodelling activities of the Tup1–Ssn6 and Swi–Snf complexes organize an extensive chromatin domain, which contributes to FLO1 gene regulation.
Results
Two novel sin mutations of histone H4
Swi–Snf-independent (Sin–) histone variants may bypass the requirement for the Swi–Snf complex in gene activation by mimicking its nucleosome remodelling activity. The sin mutations could facilitate access of transcription factors to nucleosomal DNA by destabilizing interactions between the histone H3–H4 tetramer and the H2A–H2B dimers or by destabilizing the path of the DNA around the octamer (Kruger et al., 1995).
To study the relationship between Sin– modifications of the nucleosome structure and Swi–Snf nucleosome remodelling, single amino acid substitutions were introduced into the Sin– domains of S.cerevisiae histone H4 by site-directed mutagenesis. The H4 Ser47 surface residue, close to the DNA near the dyad of the nucleosome (Flaus et al., 1996), was converted to a cysteine (S47C). This highly conserved residue is adjacent to known sin mutations that are proposed to disrupt histone–DNA contacts (Kruger et al., 1995). Additionally, Thr73 was converted to a cysteine (T73C). This substitution also occurs as a natural variant (see Makalowska et al., 1999), but resides next to conserved tyrosine residues associated with sin mutations perturbing the dimer–tetramer interface (Santisteban et al., 1997). Yeast strains expressing the S47C mutant as their sole source of histone H4 (Kim et al., 1988) display pleiotropic phenotypes including slow growth, temperature sensitivity (Figure 1A and B) and cell aggregation, which were not observed with the T73C mutation.

Fig. 1. Histone H4 sin mutants cause pleiotropic phenotypes. (A) Growth curves showing slow growth of the H4 S47C mutant strain (AFH42, diamonds) compared with wild-type (AFH41, circles) and H4 T73C mutant strains (AFH43, triangles). (B) Plate assay on YEPD agar at 30 and 37°C showing that the H4 S47C mutation (and to a lesser extent T73C) causes temperature sensitivity in yeast. (C) Serial dilutions (by a factor 100.5) of strains spotted on plates containing either glucose (YEPDextrose) or raffinose (YEPRaffinose), with antimycin A as an electron transport inhibitor. Growth on raffinose as a carbon source requires invertase (Suc2p), which is absent in the ‘snf2’ strain (AFH44). Wild-type and histone H4 mutations T73C and S47C are compared with the archetypal H4 sin mutations R45H (SPR45H) and R45C (SPR45C) for growth and partial suppression of the Swi–Snf defect on SUC2 expression. The latter was tested in the double mutant strains ‘snf T73C’ (AFH46), ‘snf2 S47C’ (AFH45), ‘snf2 R45H’ (SPsR45H) and ‘snf2 R45C’ (SPsR45C). The growth of these double mutants on raffinose shows that the histone H4 T73C and S47C mutants have strong Sin– phenotypes for SUC2 function, as does the R45C mutant (slightly lower colony numbers are due to cell clustering of this strain), but not the very slow growing R45H mutant.
A snf2 deletion abolishing the primary ATPase activity as well as the integrity of the Swi–Snf complex (Peterson et al., 1994) was introduced into the HHF2+ (H4+) strain and both mutant H4 strains. When plated on media containing raffinose as sole carbon source, both mutations partially suppressed the defect in transcription of the SUC2 gene, which encodes invertase, and supported growth in the absence of Swi–Snf (Figure 1C). They could also restore INO1 inositol auxotrophy (data not shown). Both mutant H4 alleles therefore qualify as Sin– alleles, as they obviate the need for the Swi–Snf complex in activation of Swi–Snf-dependent genes. For comparison, the plate assay of Figure 1C also includes the archetypal H4 sin mutants R45H and R45C, which have strong Sin– phenotypes for HO gene function (Wechser et al., 1997). In the genetic background used in this study, the H4 R45C mutation reproducibly suppressed the snf2 defect to a similar if somewhat lower extent compared with the S47C and T73C substitutions. However, in contrast to the S47C substitution, the very slow growth caused by the R45H mutation was not alleviated in the double mutant, and its SUC2 Sin– phenotype was very weak (Figure 1C). This shows that the levels of Swi–Snf independence conferred by histone H4 sin mutations can vary between different Swi–Snf-controlled genes, as also observed with other H4 sin mutations (Santisteban et al., 1997).
Differences in H4 Sin– chromatin accessibility do not affect gene transcription
The effects of the Sin– alleles of H4 on nucleosome structure were investigated in nuclei isolated from H4 mutants and wild-type strains. Chromatin was digested with micrococcal nuclease and bulk DNA fragments were visualized on an ethidium bromide-stained agarose gel (Figure 2A).
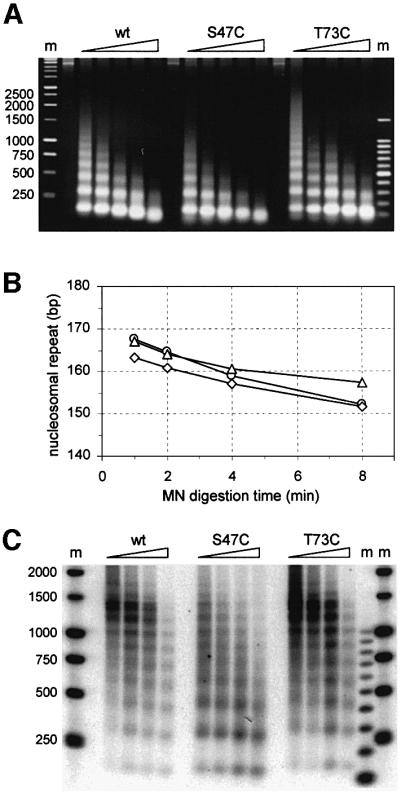
Fig. 2. Histone H4 sin mutant chromatin structure and accessibility of S47C chromatin to nucleases. (A) Agarose gel showing micrococcal nuclease digestions of yeast nuclei prepared from the strains indicated. Shorter nucleosome ladders in the H4 S47C lanes are a reproducible observation. Markers (m) are a ‘500 bp’ ladder and a 100 bp ladder. (B) Graph plotting the nucleosome repeat length as deduced from micrococcal nuclease cleavage ladders such as shown in (A). Average values from two data sets (calculated as described in the text) for H4 mutants ‘S47C’ (diamonds) and ‘T73C’(triangles) do not differ significantly from wild type (circles). (C) Southern blot of nucleosome digestion ladders separated on an agarose gel, probed for the yeast actin gene. ACT1 chromatin shows an increased nuclease sensitivity in H4 S47C strains (transcription of this gene is not affected, see Figure 3A and C).
We compared the nucleosomal spacings of the different chromatins by determining the apparent base pair length per nucleosome from the digestion ladders by linear regression. The values found for consecutive time points in the digestion kinetics were extrapolated to near-zero digestion. The calculated nucleosome repeat length was not significantly different between the strains (Figure 2B) and centred around 165 bp per nucleosome, as expected for yeast (see van Holde, 1988). As described below, there were also no differences in histone H4 gene transcription between the wild-type and mutant H4 strains.
The normal appearance of the chromatin structure in the histone H4 sin mutants notwithstanding, the H4 S47C mutant chromatin was consistently more sensitive to digestion than either H4 T73C mutant or wild-type chromatin. The nucleosomal ladders from the H4 S47C Sin– strain typically consist of shorter oligonucleosomes, with the digest preceding that of wild type by about one digestion time point in Figure 2A. A similar higher sensitivity to micrococcal nuclease was reported for the H4 R45H sin mutant and was shown to be due to an increased chromatin accessibility (Wechser et al., 1997).
The global increased sensitivity to nucleases caused by the H4 S47C mutation can also be observed to varying degrees at the level of individual genes. The chromatin organization over the actin gene ACT1, for instance, is reproducibly more susceptible to micrococcal nuclease in H4 S47C mutants (Figure 2C). Importantly, transcriptional activity of this housekeeping gene is not affected in the H4 S47C yeast strain (see Figure 3A and C). In contrast, the FLO1 gene (reprobed on the same blots; not shown) showed only minor differences in digestion, although this gene is up-regulated in the S47C mutant (see below). The increased chromatin sensitivity in itself is, therefore, not responsible for differences in transcription. This is in agreement with the conclusion of Macatee et al. (1997) with respect to chromatin sensitivity caused by mutation of the mediator complex component Sin4p.

Fig. 3. H4 S47C mutation causes derepression of the FLO1 gene. (A) Northern blot probed for FLO1 mRNA, showing partial derepression in H4 S47C strains compared with repressed wild-type and fully derepressed ssn6 strains (AFH47). This derepression is not observed for the SUC2 gene (strains grown in 2% glucose). PHO11 and ACT1 mRNA levels are unaffected. Analysis of HHF2 (H4) mRNA shows that expression is unaltered in the H4 mutant (S47C) and ssn6 strains (with ACT1 mRNA serving as loading control). (B) Agarose gel showing quantitative RT–PCR of TUP1 and SSN6 mRNA levels from a dilution series of cDNA (ACT1 calibration curves are not shown). Both genes have low-copy-number transcripts. No significant differences are apparent between wild-type and H4 S47C mutant strains. The SSN6 transcript is absent in the ssn6 strain. (C) The hypothetical ORF YAR047c upstream from FLO1 is not transcribed in wild-type or the mutant yeast strains used in this study. Top: quantitative RT–PCR of YAR047c mRNA levels using increasing amounts of undiluted cDNA. Positive controls include an RT–PCR amplification of ACT1 (a), and amplification with YAR047c primers from genomic DNA (d). The control ACT1 RT–PCR series below is at a 20-fold cDNA dilution of the panel above. Bottom: northern blot analysis of ACT1 and YAR047c expression in wild-type and additional mutant strains, showing the absence of YAR047c transcript in all strains.
A H4 sin mutant derepresses the FLO1 gene
The H4 S47C mutant displays a clumpy growth phenotype. Treatment of H4 S47C cultures with EDTA dispersed the cell aggregates, suggesting that the non-sexual calcium-dependent process of flocculation was active in the mutant. Flocculation is general to non-laboratory yeasts and essential to brewing strains. The phenotype is attributed to the expression of the FLO genes, which encode lectin-like cell wall proteins. In the laboratory strains in which this phenotype is repressed, flocculation can be induced by defects at the TUP1 and SSN6 genes (Treitel and Carlson, 1995).
Derepression (activation) of FLO1, the dominant and best characterized flocculation gene (Teunissen et al., 1995), was examined by northern hybridization (Figure 3A). Total RNA, prepared from S47C and wild-type H4 strains as well as from an ssn6 null strain positive control, was probed with a FLO1-specific sequence. Activation of FLO1 in the H4 S47C strain was confirmed, with expres sion levels independent of growth phase and below the full derepression observed in ssn6 strains, in accordance with the less severe flocculation phenotype.
We verified that the derepression observed in the S47C mutant was not an indirect effect of an altered histone H4 gene dosage or decreased transcription of TUP1 and/or SSN6. Northern hybridization analyses and RT–PCR, respectively (Figure 3A and B), showed that mRNA levels of HHF2, SSN6 and TUP1 in each instance were the same in the S47C cells as in the strain expressing wild-type H4.
Expression of PHO11, a gene proximal to the telomere from FLO1, and expression of the actin gene ACT1 were not influenced by the histone mutation (Figure 3A). This indicates that the genome-wide H4 amino acid substitution has specific effects on gene expression, affecting only a subset of genes. This is in keeping with observations from other sin mutants (Wechser et al., 1997).
We also examined whether YAR047c, a short ORF of unknown function 1.5 kb upstream of FLO1, was affected by the histone mutation. As demonstrated in Figure 3C, no transcript from this ORF could be detected in wild type or in any of the mutant strains used in this study.
Gene derepression is not due to interference with Tup1–Ssn6 repression
The products of the TUP1 and SSN6 genes form a complex that is also responsible for the glucose repression of fermentation genes, including SUC2 (Treitel and Carlson, 1995). We determined whether the H4 S47C mutation allowed a derepression at SUC2 similar to that at FLO1. No difference in SUC2 mRNA levels could be detected in the S47C strain compared with the wild-type H4 control when the gene was glucose repressed (Figure 3A) or derepressed (not shown). As regards the SUC2 gene, Tup1–Ssn6-mediated repression therefore appears to be unaffected in the S47C strain.
The H4 S47C ssn6 double mutant strain has more severe growth defects than produced by either of these mutations alone, indicating that the two defects act in non-overlapping ways. In this context, Tup1p is known to interact with H4 and H3 (up to two molecules of Tup1p may bind per nucleosome; Ducker and Simpson, 2000), but this interaction was localized to the N-terminal tails (Edmondson et al., 1996) rather than the histone H4 globular domain in which the S47C mutation occurs.
FLO1 gene expression is dependent on the Swi–Snf complex
Figure 4 shows a northern blot analysis of FLO1 mRNA expression in wild-type and mutant H4 strains in conjunction with single snf2, ssn6 and double snf2 ssn6 mutant backgrounds. The results reveal that the derepressed FLO1 gene activity observed in the H4 S47C mutant is Swi–Snf dependent, as expression is abolished in a snf2 background (Figure 4, compare ‘S47C’ and ‘S47C snf2’). High transcription from FLO1 is apparent in ssn6 strains (no Tup1–Ssn6 complex) in all histone H4 backgrounds (lanes marked ‘ssn6’) with possible additive effects of the S47C mutation (Figure 4B, ‘S47C ssn6’). However, when snf2 is disrupted additionally, this expression is abolished in the wild-type histone H4 background (Figure 4, ‘wt snf2 ssn6’), again demonstrating Swi–Snf dependence. These results secure a place for FLO1 in the subset of genes controlled by Swi–Snf activation. Unlike the other inducible gene members of this subset studied so far, the FLO1 gene is either constitutively on or off. This suggests that the role of the Swi–Snf activator at this gene is not limited to inducing access to established chromatin.

Fig. 4. Effects of Tup1–Ssn6 and Swi–Snf regulation and the H4 mutations on expression of the FLO1 gene, showing Swi–Snf dependence of FLO1 expression except in S47C snf2 ssn6 strains. (A) Northern blot analysis of FLO1 expression (control ACT1 mRNA was probed on the same filter). Mutations of SSN6, SNF2 and HHF2 (H4) were tested in the combinations indicated [additional strains: S47C ssn6 (AFH48); T73C ssn6 (AFH49); wt snf2 ssn6 (AFH410); S47C snf2 ssn6 (AFH411); T73C snf2 ssn6 (AFH412)]. (B) FLO1 mRNA expression in the strains indicated relative to the derepressed signal from the wt ssn6 strain. FLO1 mRNA levels in total RNA were normalized to the levels of ACT1 mRNA as measured by phosphoimaging. An ssn6 strain additionally mutated in the FLO1 TATA box (‘tata ssn6’; AFH415) shows an ∼7-fold reduction in expression.
In contrast, in the S47C mutant background, FLO1 transcription is still evident upon ssn6 snf2 disruption (Figure 4, ‘S47C snf2 ssn6’). In other words, the H4 S47C mutation allows transcription of the FLO1 gene when Tup1–Ssn6 repression is relieved without further requirement for Swi–Snf. This Swi–Snf independence at FLO1 again qualifies S47C as a sin mutation. However, the T73C mutation, which satisfied the Sin– criteria at SUC2 (Figure 1C), does not appear to confer significant Swi–Snf independence at this gene (Figure 4, ‘T73C snf2 ssn6’). We note that equally, the T73C mutation does not lead to derepression of the FLO1 gene when the corepressor and coactivator complexes are intact (Figure 4, ‘T73C’).
It appears that the H4 S47C mutation has consequences at two levels of regulation, requiring Swi–Snf under Tup1–Ssn6 repression but obviating the need for Swi–Snf in the absence of Tup1–Ssn6. This provides a first suggestion that it is the balance between the Swi–Snf and Tup1–Ssn6 complexes that ultimately regulates this gene, and that this interplay is disturbed by the H4 mutation. In accordance with this conclusion, FLO1 mRNA expression is markedly affected by knocking out either the Swi–Snf or the Tup1–Ssn6 complex, but the absence of both these complexes has little impact on mRNA levels (Figure 4A, compare the first and last three lanes).
Swi–Snf remodels chromatin at the FLO1 promoter
As the involvement of Tup1–Ssn6 and Swi–Snf pointed to a chromatin-mediated gene regulation mechanism, we investigated whether FLO1 gene activity was accompanied by nucleosome remodelling over the promoter. Using micrococcal nuclease digestion and indirect end-labelling analysis on nuclei and naked DNA controls, we probed from a restriction site 1 kb upstream of the FLO1 transcription start site to resolve the nucleosomal organization in this region (Figure 5A). The results reveal a cleavage pattern consistent with an ordered nucleosomal array covering the promoter in the wild-type strain (Figure 5A, lanes ‘wt’ and ‘DNA’). In the H4 S47C mutant, which expresses FLO1, these cleavage sites are reproducibly less defined, with more smearing between the bands (Figure 5A, lanes ‘S47C’; Figure 5B). In the highly expressing ssn6 null strain, cleavage at specific sites is reduced and replaced by an extensive smear indicative of a gross disruption of the nucleosomal array and loss of positioning (lanes ‘wt ssn6’). A new pattern is nevertheless visible with cutting at the normally protected regions between cleavage sites B and C, and C and D, corresponding to sites that appear to be partially accessible in the S47C mutant. Overall, this pattern is consistent with rearrangement of two positioned nucleosomes in the absence of Tup1–Ssn6, and the establishment of alternative nucleosome positions (Figure 5B).

Fig. 5. Chomatin organization and remodelling of the FLO1 promoter. (A) Micrococcal nuclease cleavage sites were mapped by indirect end-labelling relative to a (–1168) DraI restriction site in wild-type strains and strains carrying mutations of SSN6, SNF2, HHF2 (H4) and the FLO1 TATA box, in the combinations indicated. The band marked (*) in the control digest (DNA) and other lanes is from an uncut restriction fragment. Markers (m) are a ‘500 bp’ ladder and a 100 bp DNA ladder. Gene activity of the strains is indicated below. Reprobing of the filter on the left relative to the (–1737) DraI site upstream of SUC2 showed banded patterns, confirming that the smears observed in the ‘wt ssn6’ lanes were not due to degradation of nuclear DNA (not shown). The ‘ssn6 tata’ strain additionally mutated in the FLO1 TATA box shows a similar diffuse cutting pattern, indicating that the disruption of the nucleosome array in ssn6 strains is not caused primarily by the process of transcription itself. (B–D) Phosphoimager scans of the third lane of each digest in (A) showing: (B) Swi–Snf-dependent nucleosome remodelling on the promoter (note the reversal of the cutting pattern in ‘wt ssn6’); (C) more random nucleosome positioning in the S47C H4 mutant in the absence of remodelling complexes; and (D) stabilization of S47C mutant nucleosomes by Tup1–Ssn6 (note the restoration of the ‘wt’-like pattern in ‘S47C snf2’). Scans show the region from –900 bp upstream (left) to the start of the FLO1 gene (right). See also Figure 8 for an overview of the region probed.
In contrast, the chromatin in the wild-type H4 background in the absence of both Tup1–Ssn6 and Swi–Snf is characterized by a strong nucleosomal ladder (Figure 5A, lanes ‘wt snf2 ssn6’; Figure 5C). This suggests that the disruption seen in the ssn6 null strain is attributable to Swi–Snf and may represent the chromatin remodelling activity required for FLO1 transcription. We examined the effect of the high transcriptional activity of the FLO1 gene on the disruption of the nucleosomal array in ssn6 strains. An additional TATA box mutation in this strain reduced expression 7-fold (Figure 4B; a putative secondary TATA box may initiate the residual activity). Disruption of the nucleosomal array was still evident in excess over any effect of residual transcription (Figure 5A, compare lanes ‘wt ssn6’ and ‘tata ssn6’ with ‘wt’), indicating that, overall, this is a genuine remodelling effect of Swi–Snf.
The S47C mutant chromatin in the double mutant snf2 ssn6 background reproducibly presents a poor digestion pattern in association with partial expression of the gene [Figure 5A, ‘S47C snf2 ssn6’ (only the last two lanes should be considered to compensate for lower digestion; Figure 5C]. In contrast, clear cutting sites are evident in the S47C snf2 mutant background (no Swi–Snf complex), indicating a stabilizing effect of Tup1–Ssn6 repression on nucleosome arrays (Figure 5A, lanes ‘S47C snf2’; Figure 5D).
Tup1–Ssn6 organizes the nucleosomal array in upstream intergenic regions
We next investigated the extent of Tup1–Ssn6 chromatin repression beyond the promoter by determining its effects on the nucleosomal organization further upstream of the FLO1 gene. FLO1 is ideally isolated from the regulatory effects of neighbouring genes in a chromosomal region that, for yeast, is exceptionally sparse in genes. Since we could not demonstrate any transcription from the hypothetical ORF YAR047c at –1.5 kb (Figure 3C), nor find evidence of gene activity in published databases, the gene-free region upstream from FLO1 potentially extends 7 kb up to the OSH1 gene (YAR044w).
Micrococcal nuclease-digested nucleosome arrays from various genetic backgrounds were mapped relative to unique restriction sites 2 and 3 kb upstream of the coding sequence. As shown in Figure 6A, further major rearrangement of the nucleosomal array upstream from the FLO1 gene is observed in ssn6 strains up to 1.5 kb upstream from the promoter. Deletion of SNF2 does not restore the array, implying that it is the Tup1–Ssn6 complex that normally directs these nucleosomal positions (Figure 6A, ‘wt ssn6’ and ‘wt snf2 ssn6’; Figure 6B and C). The rearrangement in ssn6 strains of five nucleosomes in this upstream region adjoins the disruption of five nucleosomes over the promoter region (Figure 5). However, instead of the precise positioning being lost as in the diffuse digestion patterns of the promoter, these nucleosomes are repositioned to distinct different locations (shifted band patterns, compare Figure 6A, lanes ‘wt’ and ‘wt ssn6’). Some nucleosomes occupy the original linkers, as illustrated by the reversal of nuclease cutting patterns (Figure 6B). These results reveal a long-range nucleosomal rearrangement capability of the Tup1–Ssn6 complex.

Fig. 6. Chromatin organization and remodelling in the intergenic regions upstream from FLO1. (A) Indirect end-labelling analysis of micrococcal nuclease cleavage sites relative to a (–2193) BsrBI restriction site, in the strains indicated. Markers (m) are ‘500 bp’ and 100 bp DNA ladders. Lane ‘c’ is an unrestricted chromatin ladder. Lane ‘s’ is a control for hybridization specificity. The double-headed arrow indicates the part of the gel for which traces are shown relative to the start of FLO1 (on a 1 kb scale). (B–D) Phosphoimager scans of one lane of digests shown in (A), highlighting (B and C) long-range Tup1–Ssn6 remodelling [differences (t) between ‘wt snf2 ssn6’ and ‘wt snf2’] and Swi–Snf remodelling [differences (s) between ‘wt snf2 ssn6’ and ‘wt ssn6’]. Similarity between ‘wt’ and ‘wt snf2’ indicates dominant effects of Tup1–Ssn6. The ‘wt’ nucleosome array in this upstream region from approximately –1950 bp (left) to –900 bp (right) is represented schematically by grey ovals (see also Figure 8). (D) S47C-specific more diffuse nucleosome positioning in the absence of Tup1–Ssn6 (‘S47C snf2 ssn6’ and ‘S47C ssn6’) and apparent restoration of the ‘wt’-like pattern in the presence of Tup1–Ssn6 (‘S47C snf2’). (E) Indirect end-labelling relative to a (–3185) HindIII site, showing nucleosomes positioned in the –2000 to –3000 bp upstream region. (F) Indirect end-labelling relative to a (–2918) BsrBI site, showing a nucleosome array in the –3000 to –5500 bp upstream region. (G and H) Phosphoimager scans of the lanes of matching digestion times shown in (E), highlighting long-range Tup1–Ssn6 remodelling of the array and the modulating effect of Swi–Snf. The scans show the region from approximately –2950 bp (left) to –1900 bp (right) upstream of FLO1. (I) Phosphoimager scans of the digests shown in (F), showing waning effects of long-range Tup1–Ssn6 and Swi–Snf remodelling in the region shown from approximately –5350 bp (left) to –3200 bp (right) upstream of FLO1.
Swi–Snf chromatin remodelling is not limited to gene promoters
Closer inspection of the snf2 ssn6 nucleosomal array upstream of the FLO1 gene not only reveals that the major remodelling in ssn6 strains is due to the relief of Tup1–Ssn6-directed nucleosome positioning, but it also highlights significant differences in positioning between the snf2 ssn6 and ssn6 strains, which differ only in the presence of the Swi–Snf complex (Figure 6C, see changes marked ‘s’ and ‘t’). This means that the Swi–Snf complex itself is responsible for repositioning nucleosomes at long distances from the promoter. Like the Swi–Snf-dependent nucleosome disruption over the promoter, the upstream repositioning of nucleosomes reflects a direct impact of the Swi–Snf complex on chromatin structure. These alterations do not persist in the wild-type array, which is dominated by the Tup1–Ssn6 complex to the extent that a snf2 deletion has no effect. Thus, Swi–Snf remodelling is observed in the absence, but not the presence of the Tup1–Ssn6 complex on intergenic regions and the normally repressed FLO1 promoter. The S47C mutation by itself does not show significant effects on the chromatin in this region (Figure 6A). However, in the additional absence of the Tup1–Ssn6 complex, the banding patterns are less distinct than their wild-type counterparts (Figure 6A, compare ‘S47C ssn6’ with ‘wt ssn6’ and traces in Figure 6D with C), which may indicate more diffuse nucleosome positioning [note that the similar effect in the ‘S47C snf2 ssn6’ scan (Figure 6D) may, to some extent, be due to lower loading].
In the 2–3 kb upstream region (Figure 6E) and beyond (Figure 6F), further effects of the Tup1–Ssn6 complex on the nucleosome array are observed. In a striking example of nucleosome remodelling at a distance of kilobases from the promoter, removal of the Swi–Snf complex causes the apparent loss of two nucleosomes at –2250 and –2600 bp upstream of FLO1 (Figure 6E, compare lanes ‘wt’ and ‘wt snf2’, and loss of nuclease protection in Figure 6G). The Tup1–Ssn6 complex is responsible for this disappearance, as the effect is absent in snf2 ssn6 double mutants. The impact of Swi–Snf on the nucleosomal array in this region consists of counteracting the effects of Tup1–Ssn6, which is no longer dominant here, rather than direct effects on nucleosome positioning itself (Figure 6H, no difference between the ‘wt ssn6’ and ‘wt snf2 ssn6’ patterns).
Further upstream, remodelling effects seem more intermittent, with a final significant incident of remodelling occurring 5 kb upstream of FLO1 (Figure 6F). Here, in the absence of the Swi–Snf complex, Tup1–Ssn6 is reponsible for the movement of two neighbouring nucleosomes, thus narrowing a dinucleosome size protection in the nuclease cutting pattern (Figure 6I at ‘10 mm’). In both examples of far upstream chromatin remodelling, the antagonistic activities of the two remodelling complexes seem to result in a more ordered wild-type nucleosomal array structure with clearly defined cutting patterns.
High resolution analysis confirms nucleosome remodelling 2.5 kb upstream of FLO1
The intriguing loss of nuclease protection in snf2 chromatin at two nucleosome positions in the 2.5 kb upstream region (Figure 6G) was investigated further using the high resolution primer extension method. The micrococcal nuclease cleavage sites in chromatin from wild-type and snf2 strains, as well as in naked DNA, were analysed in the region from –2100 to –2800 bp upstream of the FLO1 start site (Figure 7A and B). Figure 7C shows the cleavage patterns (black trace) converted to a linear base pair scale and superimposed on the patterns from the lower resolution indirect end-labelling analysis (white trace). The high and low resolution data are in marked agreement, as the white trace faithfully envelops most of the peaks of the black trace. This is consistent with the conclusion from the comparative study by Tanaka et al. (1996) that a low resolution map is an accurate representation of the chromatin structure.

Fig. 7. High resolution analysis confirms remodelling of two nucleosomes in the 2.5 kb region upstream of FLO1. Primer extension mapping of micrococcal nuclease cleavage sites from primers starting at –2339 bp (A) and –2033 bp (B). Markers ‘m’ are a 5′-end-labelled φX174 HinfI digest and a 3′ filled-in pBR322 MspI digest with one nucleotide added. (C) Gel traces of wild-type ‘wt’, ‘snf2’ chromatin and naked DNA ‘D’ digestions as shown in (A) and (B) were plotted (black) on a linear base pair scale relative to the start site of transcription. The gel migration distances in each trace were recalculated to base pairs, using the equation for the DNA standard curve determined by polynomial regression analysis of the bands from the two markers. The corresponding traces from the indirect end-labelling analysis (Figure 6G) were plotted similarly on a linear base pair scale (white). Duplicate ‘wt’ data from independent experiments are shown. Alignment with the high resolution trace was within 10 bp; this was corrected for maximum fit. Also shown are the locations of the primers (arrowheads A and B) used in the extension reactions of gels (A) and (B), and putative nucleosome positions assigned on the basis of the digestion patterns.
In addition, the high resolution patterns show that at neither of the two sites of increased nuclease accessibility does the loss of nuclease protection reflect a simple reversal to the naked DNA cutting pattern (Figure 7C). We cannot exclude the possibility that this accessibility, incompatible with the presence of a normal nucleosome, may signify a remodelled nucleosome state. However, considering that the wild-type nucleosome boundary peaks at –2180 and –2320 bp are much reduced in the snf2 pattern, another likely interpretation is that neighbouring nucleosomes have invaded space not occupied by a nucleosome, leaving a wide boundary around –2250 bp. While the increased accessibility at –2600 bp is similarly accompanied by a relatively reduced boundary from –2450 to –2490 bp, the remaining shared characteristics in the digestion patterns in this region indicate that the wild-type and snf2 nucleosomal arrangements are not mutually exclusive in these respective nucleosome populations. In conclusion, nucleosome remodelling in the –2.5 kb region is confirmed by the high resolution primer extension analysis, which is indicative of substantial rearrangements at sites that may be conducive to alternative nucleosomal organizations.
Chromatin remodelling in upstream regions determines the chromosomal state of a gene
From the reproducible nucleosome digestion patterns over a total of nearly 6 kb of sequence upstream from FLO1, a linear map was generated (Figure 8). Nucleosome positions could be assigned by comparison of the chromatin and free DNA digestion traces, which differ substantially and indicate a repeating nucleosomal protection. We note that our long-range indirect end-labelling analysis does not address the possible microheterogeneity of closely overlapping alternative positions clustered into these assigned ‘nucleosomes’. On the basis of our map, we propose the occurrence of a 32 nucleosome array upstream of the FLO1 gene in wild-type strains. The average nucleosome spacing within this array is 176 bp, which is significantly higher than the 165 bp repeat length for bulk chromatin in this yeast strain (Figure 3B). As summarized in Figure 8, a variety of chromatin remodelling activities can be detected over an extensive region that includes not only the FLO1 promoter but also kilobases of intergenic sequence. This requires a significant expansion of models of chromatin remodelling previously thought to be limited to gene promoters. We propose that the Swi–Snf-dependent remodelling of the promoter nucleosome array with concomitant high levels of transcription is the culmination of antagonistic remodelling events with corepressors in the upstream intergenic region determining the chromosomal state of a gene.

Fig. 8. (A) Composite map of the wild-type array of positioned nucleosomes in the extensive intergenic region upstream of the FLO1 gene, with a schematic of the nucleosome remodelling activities of Swi–Snf and Tup1–Ssn6. Gel traces of wild-type chromatin and naked DNA digestion ladders as shown in Figures 5 and 6 were converted as in Figure 7 and plotted on a linear bp scale relative to the start site of transcription [also shown are the probes (arrows) and restriction sites relative to which indirect end-labelling was performed]. For chromatin, the coinciding traces from two independent experiments are shown to demonstrate reproducibility. Low band intensities in the –3200 bp region are due to low hybridization signal at the end of two joined traces. At the other junctions (–1900 bp and –800 bp), this was corrected by the overlap between traces. Grey ovals representing nucleosome core particles of 145 bp are centred on the minima between strong sites of the micrococcal nuclease cutting pattern where such minima were not present in the DNA pattern or contained peaks not found in chromatin. Chromatin and DNA patterns were identical between two strong cuts in the –4300 bp region, and a nucleosome (white) was assigned arbitrarily to this position. The dinucleosome sized gap at –4700 bp was assigned arbitrarily with two nucleosomes. The mapping of the nucleosome array stops at the FLO1 coding region and towards the upstream OSH1 gene (represented by white overlapping ovals). Nucleosome remodelling by Swi–Snf and Tup1–Ssn6 is summarized above the wild-type trace; to see the mutant traces, refer to the figures indicated by the brackets below. (B) Diagram of nucleosome remodelling in yeast mutants ‘snf2’ (no Swi–Snf complex), ‘ssn6’ (no Tup1–Ssn6 complex) and ‘snf2 ssn6’ (neither complex), compared with the wild-type nucleosome array. Black ovals represent repositioned nucleosomes; gaps indicate nucleosome loss. Uncertain positions are indicated by overlapping ovals. The ssn6 strain promoter nucleosomes depicted are the weak positions in the overall disrupted pattern.
Discussion
The Swi–Snf dependence of genes and H4 Sin mutations: properties that depend on the chromatin environment
Gene repression in eukaryotes is exerted primarily through chromatin structure. The nucleosome structure itself limits access to the DNA in general, but it is mainly through corepressors such as Tup1–Ssn6 in yeast that the repression of specific subsets of genes is functionally maintained. The Tup1–Ssn6 complex also represses the FLO1 gene by an as yet unknown mechanism. We demonstrate that the novel histone H4 S47C Sin mutation derepresses FLO1, a gene active in non-laboratory yeast but normally repressed in our strains, which we characterize as being under strong control due to its chromatin organization. The S47C H4 and ssn6 defects do not simply overlap phenotypically, and Tup1–Ssn6 repression was found to operate normally with mutant histones at the SUC2 gene.
As we discovered, expression of the FLO1 gene is entirely dependent on the Swi–Snf coactivator. Thus, like the SUC2 gene, the FLO1 gene is under the control of the Tup1–Ssn6 corepressor as well as the Swi–Snf coactivator. In the absence of both chromatin-mediated repression and activation, the FLO1 gene is inactive. In contrast, the H4 S47C mutation leads to gene activation when the chromatin context is pared down to this default state nearer to the level of just histone octamers and DNA, suggesting that it causes an alteration in the nucleosome core that mimics Swi–Snf action. Interestingly, when Tup1–Ssn6 repression is in place, this same ‘Swi–Snf-independent’ mutation still allows expression of FLO1, but now requires Swi–Snf action for activation.
The fact that FLO1 expression in H4 mutant strains is Swi–Snf dependent in the presence, but not the absence of the Tup1–Ssn6 complex indicates that apart from remodelling nucleosomes, Swi–Snf has a role in counteracting the repressive effect of Tup1–Ssn6, or vice versa. This may also explain why similar levels of FLO1 expression are observed in these strains either when the chromatin-mediated repression and activation are normally in place, or when both are removed.
There is no documented evidence to date of a direct interaction between Tup1–Ssn6 and Swi–Snf, but co-immunoprecipitation between Swi–Snf subunits and Hir WD repressor proteins has been reported (Dimova et al., 1999). The interplay between Tup1–Ssn6 and Swi–Snf at SUC2 has been proposed to involve a separate chromatin remodelling activity (Gavin and Simpson, 1997). Alternatively, as both the Tup1–Ssn6 and Swi–Snf complexes influence chromatin structure (reviewed by Kingston et al., 1996), the interplay between repression and activation could take place directly at the chromatin level. The transcriptional activation of a number of genes has been correlated with nucleosome remodelling at their promoters. However, the literature suggests that these large complexes act at different levels of the chromatin structure: Tup1–Ssn6 on nucleosome positioning (Cooper et al., 1994) and Swi–Snf on nucleosome conformation (Côté et al., 1994; Kwon et al., 1994) and mobility (Whitehouse et al., 1999).
The antagonism between Tup1–Ssn6 and Swi–Snf activities operates at the chromatin level
Our characterization of the nucleosomal organization of the FLO1 gene covers the activity of the Tup1–Ssn6 and Swi–Snf complexes not only on the promoter but also in the extensive intergenic region upstream of this gene, and is summarized in Figure 8.
The FLO1 gene promoter is organized into an ordered array of nucleosomes. Full FLO1 derepression in the absence of Tup1–Ssn6 is accompanied by the disruption of the array and the establishment of alternative nucleosome positions. This disruption over the active promoter is due to remodelling by the Swi–Snf complex rather than to the high transcriptional activity of the gene. In the absence of both remodelling complexes, an ordered nucleosome pattern is present.
In the H4 S47C mutant, an intermediate organization may be present with partial nucleosome remodelling, in accordance with FLO1 expression levels. Our triple mutant strain S47C snf2 ssn6 indicates that in the absence of corepressor and coactivator, the S47C mutation by itself produces a less defined nucleosome array. Thus, the Sin– phenotype of the S47C mutation may be characterized by less synchronized nucleosome positioning over the FLO1 promoter, as is also produced by Swi–Snf in the absence of repression, and similarly cause gene expression. Alternatively, the mutation may have more indirect effects on chromatin, or prevent the interaction of other factors. Although Tup1–Ssn6 has no apparent influence on nucleosome positioning over this promoter other than antagonizing Swi–Snf, the H4 S47C snf2 strain reveals that it stabilizes or restores order in the array of mutant nucleosomes to the level of wild-type patterns (Figure 5D), which is accompanied by the shutdown of transcription.
Thus, direct antagonistic effects of Swi–Snf and Tup1–Ssn6 on chromatin determine the nucleosomal organization and activity of the promoter. A general observation of our study is that the individual effects of Tup1–Ssn6 and Swi–Snf in remodelling the wild-type nucleosome array are only revealed in the absence of the other complex, suggesting a possible exclusion mechanism. On the normally repressed FLO1 promoter, Tup1–Ssn6 dominates the organization of the nucleosome array.
Tup1–Ssn6 and Swi–Snf remodel chromatin at long distances from the promoter
In addition to its effects at the promoter, we show that the Tup1–Ssn6 complex is responsible for substantially rearranging the nucleosomal array over a distance of several kilobases upstream from the FLO1 gene. We cannot exclude the possibility that a remodelling activity other than Swi–Snf is in some cases causing these nucleosomes to change positions once Tup1–Ssn6 is removed. However, overall, the observed remodelling is in support of Tup1–Ssn6 exerting direct activities at the chromatin level. Our results expand and are consistent with the reported capacity of the Tup1–Ssn6 repressor to organize arrays of positioned nucleosomes near α2/MCM1 operators, which are disrupted upon derepression (Cooper et al., 1994). The extensive long-range repositioning of nucleosomes we observe as well as the stabilizing effects over the promoter define the Tup1–Ssn6 complex as a chromatin remodelling complex.
Contrary to current models, we find that nucleosome remodelling by the Swi–Snf complex is by no means limited to the promoter. At least 1.5 kb upstream from the gene, evidence can be found of its action in the nucleosome positioning of the various deletion strains. These effects are not detected in snf2 single mutants because of the dominant control of the Tup1–Ssn6 corepressor over the chromatin organization in this region. They are revealed by the considerable differences in nucleosome positioning between snf2 ssn6 and ssn6 mutants, which differ only in the presence of the Swi–Snf complex. Taken together with the differences between the patterns from snf2 ssn6 and snf2 mutants, which highlight the effects of Tup1–Ssn6 (Figure 6C), we conclude that both Tup1–Ssn6 and Swi–Snf complexes actively modify chromatin upstream from FLO1. Further into the intergenic region, where such direct effects on the nucleosomal array are not apparent, Swi–Snf still counteracts Tup1–Ssn6 remodelling. This includes the nucleosome remodelling around –2.5 kb, which was confirmed by high resolution analysis.
Dual effects of the Swi–Snf coactivator and Tup1–Ssn6 corepressor on chromatin structure
In its effects on chromatin structure, we can distinguish between the capacities of the Tup1–Ssn6 complex for altering specific nucleosome positions and for stabilizing or promoting more order in nucleosome arrays. We also find two types of remodelling for the Swi–Snf coactivator. One remodelling activity, which is not limited to promoters, can alter the positions of specific nucleosomes over large distances of DNA. This influence on nucleosome positioning upstream from genes is likely to be independent of the associations of the complex with the transcription pre-initiation complex. The other remodelling function of Swi–Snf, which is limited to gene promoters, reduces the ‘phasing’ within arrays, leaving the nucleosome positions less in register with respect to the DNA sequence. This could be due to less strict nucleosome positioning, or to ATP-enhanced nucleosome sliding (Whitehouse et al., 1999), with movements beyond the natural short-range mobility of nucleosomes on DNA (Pennings et al., 1991; Meersseman et al., 1992). Particularly in this last aspect, Tup1–Ssn6 and Swi–Snf seem to counteract each other, whereas they are not always directly opposed with regard to the specific nucleosomes they reposition. Interestingly, the H4 S47C mutation mimics the ‘reduced phasing’ by Swi–Snf, but this is not limited to promoters and can be counteracted fully by Tup1–Ssn6. Furthermore, it does not copy the Swi–Snf nucleosome rearrangements. In contrast, the T73C H4 mutation, which fits the classic sin criteria but does not derepress the FLO1 gene, has no chromatin remodelling effects at this locus (not shown). No single sin mutation may mimic the many Swi–Snf functions fully nor act as its substitute at all Swi–Snf-dependent genes.
We note that the S47C mutation has also been introduced in Xenopus histone H4 and derivatized in reconstituted nucleosomes to create a nucleosomal cleavage reagent (Flaus et al., 1996). It is unclear if this mutation would cause Sin– effects in the chromatin of higher eukaryotes, as the yeast histone H4 sequence differs slightly from that of Xenopus H4 (see Makalowska et al., 1999).
A close link between gene activation and repression
This study has shown that the nucleosomal organization over extensive chromosomal regions can be controlled by the antagonistic Tup1–Ssn6 and Swi–Snf activities. We demonstrate the full magnitude of the remodelling activities in an array of 32 nucleosomes upstream of FLO1 (Figure 8). This array, which occurs in a 7 kb potentially gene-free region, has a significantly longer nucleosome average repeat length than yeast bulk chromatin and could be considered as the yeast equivalent of inactive chromatin. However, the upstream remodelling activities nucleated in this array could ultimately determine the accessibility of the gene promoter and gene activity. The very long-range nucleosome remodelling that we observe for the gene-sparse region around the FLO1 gene seems incompatible with the typical gene density in yeast. Our mapping of chromatin remodelling in the SUC2 gene region confirms the long-range effects we report here, but also shows that these can be delimited by nearby genes (A.B.Fleming and S.Pennings, in preparation).
Together, Tup1–Ssn6 and Swi–Snf may produce a buffering effect for the nucleosomal organization. Mainly due to the stabilizing effects of Tup1–Ssn6, the H4 S47C mutant nucleosomal cutting pattern looks more like ‘wild type’ in the presence of both remodelling complexes than in their absence, although this does not prevent partial FLO1 gene derepression. The long-range nucleosome positions observed when coactivator and corepressor are jointly present may be the result of a continuous steering by both of these regulators, or alternatively they may be determined by whichever activity is dominant. Our data are more in support of the second model, since in all cases one regulator seems to dominate the positioning of nucleosomes in the array.
Both the Swi–Snf and Tup1–Ssn6 complexes appear to be present in the yeast nucleus in low numbers not exceeding the number of genes they control (Côté et al., 1994). Consequently, remodelling complexes may be recruited to a series of discrete sites and may be capable of controlling the nucleosomal organization over a long distance. This control could be indirect, involving other factors or histone acetylation. Tup1p has also been reported to bind along the entire STE6 domain (Ducker and Simpson, 2000). The observed perturbations in the nucleosomal array far upstream of the gene are consistent with models in which promoter accessibility and activity are determined at the level of chromatin domains. The discovery of actin-related subunits in the Swi–Snf complex (see Wade and Wolffe, 1999) suggests that this could be achieved by nuclear relocalization. Alternatively, control by Swi–Snf could be asserted through large loop domain formation (Bazett-Jones et al., 1998) and the generation of superhelical torsion (Havas et al., 2000). The Tup1p WD-protein structure has an equally extensive potential for protein–protein interactions (reviewed in Smith et al., 1999). Our finding that Tup1–Ssn6 brings more order to nucleosome arrays could mean that this complex directs a higher order chromatin structuration.
Our results are consistent with the recent finding that promoter-targeted histone acetylation occurs in a background of acetylation/deacetylation of extensive chromosomal regions (Vogelauer et al., 2000). It is interesting to note that the boundary of chromatin remodelling at 5 kb upstream of the FLO1 gene coincides with the occurrence of a putative autonomously replicating sequence (ARS). ARS elements bind specifically to the yeast nuclear scaffold (Amati and Gasser, 1988) and may function as matrix or scaffold attachment regions (MARs or SARs), thus delimiting chromosomal domains. Further studies will aim to clarify the interaction of Tup1–Ssn6 and Swi–Snf complexes with the chromatin and the mechanism of their antagonism.
Materials and methods
Strains and media
Yeast strains used were UKY403 [MATa ade2-101 his3Δ200 leu2-3,112 lys2-801 trp1-Δ901 ura3-52 GAL thr– tyr– arg4-1 hhf1Δ::HIS3 hhf2Δ::LEU2/pUK421 (TRP1,GAL1p/HHF2)] (Kim et al., 1988), AFH41 [UKY403 pUK499 (URA3/HHF2) replaces pUK421], AFH42 [UKY403 pSKP1 (URA3/hhf2-S47C) replaces pUK421], AFH43 [UKY403 pSKP2 (URA3/hhf2-T73C) replaces pUK421], SPR45C [UKY403 pCP326 (URA3/hhf2-R45C) replaces pUK421], SPR45H [UKY403 pCP328 (URA3/hhf2-R45H) replaces pUK421], AFH44 (AFH41 snf2Δ::TRP1), AFH45 (AFH42 snf2Δ::TRP1), AFH46 (AFH43 snf2Δ::TRP1), SPsR45C (SPR45C snf2Δ::TRP1), SPsR45H (SPR45H snf2Δ::TRP1), AFH47 (AFH41 ssn6Δ::kanMX4), AFH48 (ABF405 ssn6Δ::kanMX4), AFH49 (ABF406 ssn6Δ::kanMX4), AFH410 (AFH44 ssn6Δ::kanMX4), AFH411 (AFH45 ssn6Δ::kanMX4), AFH412 (AFH46 ssn6Δ::kanMX4) and AFH415 (BJ5465 ssn6Δ::kanMX4 flo1Δ96).
Yeast strains were transformed by the lithium acetate procedure (Gietz and Woods, 1994). Media and standard methods were according to Ausubel et al. (1994–2000).
Construction of hhf2-S47C and hhf2-T73C
Codons Ser47 and Thr73 of yeast histone H4 (HHF2) were mutagenized to cysteine residues according to Ho et al. (1989). To generate S47C, plasmid pUK499 was used as template in two PCRs using the following primer pairs: HHFA (5′-CGTATCACGAGGCCCTTTCG-3′) with Ser-sen (5′-GCGTATTTGTGGTTTGATCTAACG-3′); and HHFB (5′- GTATGGCAGGACGTTCTGGG-3′) with Ser-anti (5′-CGTAGATCAAACCACAAATACGC-3′). The products were used as template in a third PCR in the presence of primers HHFA and HHFB to yield the H4 gene with a single base pair substitution. To mutagenize the Thr73 codon, the procedure was repeated with primers Thr-sen (5′-CTCTGTTACTTACTGTGAACACG-3′) and Thr-anti (5′-GTTCACAGTAAGTAACAGAGTCC-3′) replacing Ser-sen and Ser-anti. The S47C and T73C constructs were cloned into the EcoRI–HindIII sites of pUK499 to create plasmids pSKP1 and pSKP2, respectively. The mutations were confirmed by sequencing. The constructs were transformed into UKY403 and strains were cured of pUK421 to prevent recombination. The H4 R45C and R45H mutants were constructed as above using plasmids pCP326 and pCP328 (Wechser et al., 1997).
Gene disruptions
SNF2. Plasmid pBD3 was digested with BglII at positions –899 and +4763 of the cloned SNF2 sequence, and the region replaced with a BglII–TRP1 fragment from pFL45 (Bonneaud et al., 1991) to create pAD4. A linear 3.8 kb SphI–XhoI fragment from pAD4 was used to disrupt SNF2 by homologous recombination.
SSN6. The method of Wach et al. (1994) was used to disrupt the SSN6 locus using the following oligonucleotides: SsnKNA (5′-GCAGCAGTTCCTCAGCAGCCACTCGACCCATTAACACAATCAGCTGAAGCTTCGTACGC-3′) and SsnKNB (5′-AACAGAAGCTGCTTTGGTAGCTTCTTCAGCAGGACTAGCTGCATAGGCCACTAGTGGATCTG-3′), and pFA6-kanMX4 as template.
FLO1. The FLO1 promoter region at –96 to –91 was replaced by an NsiI site via a two-step allele replacement procedure using a transitorily integrated URA3 marker. A FLO1 fragment (–1060 to –51) produced by PCR of genomic DNA using oligonucleotides RepFluora1 (5′- TGCCAATTGTGTGCATAGC-3′) and RepFluora2 (5′-AGAGAGCTTACATCAACGAGCAAGAGTGAAATATGTTCCTATGCATAGCTCAAAAATTTTCGACATCATGCCTTC-3′; the NsiI site is underlined), was used to transform the URA+ strain. Cells were plated onto 5-fluoro-orotic acid (5-FOA) medium to select for the replacement event. Disruption of SSN6 completed the strain construction (AFH415). Each disruption event was confirmed by Southern blot analysis (Ausubel et al., 1994–2000).
Chromatin structure analysis
Yeast nuclei were isolated according to Ausubel et al. (1994–2000). Nuclei (500 µl) were incubated at 37°C with micrococcal nuclease (Worthington; 1 U/ml) for 1, 2, 4 and 6 min, and the reaction stopped with 1% SDS, 5 mM EDTA (final concentrations). The DNA was purified and 10 µg samples were resolved by electrophoresis in 1.5% agarose gels. The Southern-blotted gel in Figure 2C was probed with an ACT1 DNA probe encompassing ACT1 ORF positions +411 to +1421.
For indirect end-labelling analysis of the FLO1 promoter and upstream region, DNA purified from micrococcal nuclease-treated nuclei was digested to completion with DraI, BsrBI or HindIII, and 20 µg samples resolved in a 1.25% agarose gel. The DNA was transferred to Zetaprobe GT membrane (Bio-Rad) and hybridized to random-primed 32P-labelled probes (–1146 to –775) in Figure 5, (–2177 to –1781) in Figure 6A, (–2815 to –3182) in Figure 6E and (–2923 to –3277) in Figure 6F. A 20 µg aliquot of control naked DNA control samples was digested with 0.1 and 0.5 U of micrococcal nuclease in 100 µl of digestion buffer for 2 min at 37°C and digested with the appropriate restriction enzyme. Band intensities were determined by phosphoimager analysis (FujiFilm FLA2000 FluoroImager).
Primer extension analysis was performed according to Shimizu et al. (1991). DNA was prepared from micrococcal nuclease-digested nuclei as described above. Primer extensions were carried out using Vent Polymerase (New England Biolabs) and analysed in 6% polyacrylamide–8 M urea sequencing gels. The primers used were ‘A’ (5′-TTTTTCTGAAGCTCCCATCGTTGAG-3′) and ‘B’ (5′-ATACCAGCAATACAGGTGGTGGTTC-3′).
Northern blot analysis
Total RNA was extracted from cells and 15 µg samples were analysed by northern blot analysis after electrophoresis through a 1% agarose– formaldehyde gel (Ausubel et al., 1994–2000). The FLO1 DNA probe is an EcoRV fragment from plasmid pYY105. The SUC2 DNA probe contains SUC2 ORF sequences between +119 and +1222. ACT1, INO1, YARO47c and PHO11 (+ PHO12) transcripts were identified with probes corresponding to ORF positions +411 to +1422, +74 to +754, +1 to +315 and +430 to +1302, respectively.
RT–PCR analysis
Total RNAs (1 µg) from the strains indicated were treated with RNase-free DNase RQ1 (Promega) and reverse transcribed using the Ready To Go T-primed first-strand kit (Pharmacia Biotech). cDNAs were serially diluted and subjected to PCR amplification to determine the linear range for product formation. Aliquots of 1, 2, 4, 6 and 8 µl from 10-fold dilutions of cDNAs were amplified (35 cycles) for SSN6. Amplification (25 cycles) for ACT1 and TUP1 used 1, 2, 4 and 8 µl of 20-fold cDNA dilutions. Amplification of YARO47c (25 cycles) was from 1, 2, 4 and 8 µl of undiluted cDNAs. The products correspond to positions +2255 to +2660 of SSN6, +1634 to +2098 of TUP1 and +1059 to +1422 of ACT1. The DNA product of YAR047c corresponds to positions +1 to +315. PCRs were analysed in 1.5% agarose gels, stained with ethidium bromide and scanned using a FujiFilm FLA 2000 FluoroImager. A control PCR of total RNA was performed alongside each RT–PCR.
Acknowledgments
Acknowledgements
We thank Richard Meehan, Jim Allan, Colin Davey, Alan Boyd and members of the chromatin labs for discussions. Yeast strains and plasmids were kindly provided by Michael Grunstein, Craig Peterson, Alan Boyd and Yde Steensma. Thorsten Allers and Aimée Davidson contributed early on in the project. We thank John Pantling for technical assistance. This work was funded by the Wellcome Trust. S.P. is a Wellcome Trust Senior Research Fellow in Basic Biomedical Sciences.
References
- Amati B.B. and Gasser,S.M. (1988) Chromosomal ARS and CEN elements bind specifically to the yeast nuclear scaffold. Cell, 54, 967–978. [DOI] [PubMed] [Google Scholar]
- Ausubel F.M., Brent,R., Kingston,R.E., Moore,D.D., Seidman,J.G., Smith,J.A. and Struhl,K. (eds) (1994–2000) Current Protocols in Molecular Biology. John Wiley & Sons, New York, NY.
- Bazett-Jones D.P., Côté,J., Landel,C.C., Peterson,C.L. and Workman,J.L. (1999) The SWI/SNF complex creates loop domains in DNA and polynucleosome arrays and can disrupt DNA–histone contacts within these domains. Mol. Cell. Biol., 19, 1470–1478. [DOI] [PMC free article] [PubMed] [Google Scholar]
- Bonneaud N., Ozier-Kalogeropoulos,O., Li,G.Y., Labouesse,M., Minvielle-Sebastia,L. and Lacroute,F. (1991) A family of low and high copy replicative, integrative and single-stranded S.cerevisiae/E.coli shuttle vectors. Yeast, 7, 609–615. [DOI] [PubMed] [Google Scholar]
- Cairns B.R., Kim,Y.-J., Sayre,M.H., Laurent,B.C. and Kornberg,R.D. (1994) A multisubunit complex containing the SWI1/ADR6, SWI2/SNF2, SWI3, SNF5 and SNF6 gene products isolated from yeast. Proc. Natl Acad. Sci. USA, 91, 2905–2908. [DOI] [PMC free article] [PubMed] [Google Scholar]
- Cooper J.P., Roth,S.Y. and Simpson,R.T. (1994) The global transcriptional regulators, SSN6 and TUP1, play distinct roles in the establishment of a repressive chromatin structure. Genes Dev., 8, 1400–1410. [DOI] [PubMed] [Google Scholar]
- Côté J., Quinn,J., Workman,J.L. and Peterson,C.L. (1994) Stimulation of GAL4 derivative binding to nucleosomal DNA by the yeast SWI/SNF complex. Science, 265, 53–60. [DOI] [PubMed] [Google Scholar]
- Dimova D., Nackerdien,Z., Furgeson,S., Eguchi,S. and Osley,M.A. (1999) A role for transcriptional repressors in targeting the yeast Swi/Snf complex. Mol. Cell, 4, 75–83. [DOI] [PubMed] [Google Scholar]
- Ducker C.E. and Simpson,R.T. (2000). The organized chromatin domain of the repressed yeast cell-specific gene STE6 contains two molecules of the corepressor Tup1p per nucleosome. EMBO J., 19, 400–409. [DOI] [PMC free article] [PubMed] [Google Scholar]
- Edmondson D.G., Smith,M.M. and Roth,S.Y. (1996) Repression domain of the yeast global repressor Tup1 interacts directly with histones H3 and H4. Genes Dev., 10, 1247–1259. [DOI] [PubMed] [Google Scholar]
- Flaus A., Luger,K., Tan,S. and Richmond,T.J. (1996) Mapping nucleosome position at single base-pair resolution by using site-directed hydroxyl radicals. Proc. Natl Acad. Sci. USA, 93, 1370–1375. [DOI] [PMC free article] [PubMed] [Google Scholar]
- Gavin I.M. and Simpson,R.T. (1997) Interplay of yeast global transcriptional regulators Ssn6p–Tup1p and Swi–Snf and their effect on chromatin structure. EMBO J., 16, 6263–6271. [DOI] [PMC free article] [PubMed] [Google Scholar]
- Gietz R.D. and Woods,R.A. (1994) High efficiency transformation with lithium acetate. In Johnston,J.R. (ed.), Molecular Genetics of Yeast. Oxford University Press, Oxford, UK, pp. 121–134.
- Grant P.A. and Workman,J.L. (1998) A lesson in sharing? Nature, 396, 410–411. [DOI] [PubMed] [Google Scholar]
- Gromöller A. and Lehming,N. (2000) Srb7p is a physical and physiological target of Tup1p. EMBO J., 19, 6845–6852. [DOI] [PMC free article] [PubMed] [Google Scholar]
- Havas K., Flaus,A., Phelan,M., Kingston,R., Wade,P.A., Lilley,D.M. and Owen-Hughes,T. (2000) Generation of superhelical torsion by ATP-dependent chromatin remodelling activities. Cell, 103, 1133–1142. [DOI] [PubMed] [Google Scholar]
- Ho S.N., Hunt,H.D., Horton,R.M., Pullen,J.K. and Pease,L.R. (1989) Site-directed mutagenesis by overlap extension using the polymerase chain-reaction. Gene, 77, 51–59. [DOI] [PubMed] [Google Scholar]
- Kim U.J., Han,M., Kayne,P. and Grunstein,M. (1988) Effects of histone H4 depletion on the cell cycle and transcription of Saccharomyces cerevisiae. EMBO J., 7, 2211–2219. [DOI] [PMC free article] [PubMed] [Google Scholar]
- Kingston R.E., Bunker,C.A. and Imbalzano,A.N. (1996) Repression and activation by multiprotein complexes that alter chromatin structure. Genes Dev., 10, 905–920. [DOI] [PubMed] [Google Scholar]
- Kruger W., Peterson,C.L., Sil,A., Coburn,C., Arents,G., Moudrianakis, E.N. and Herskowitz,I. (1995) Amino acid substitu tions in the structured domains of histones H3 and H4 partially relieve the requirement of the yeast SWI/SNF complex for transcription. Genes Dev., 9, 2770–2779. [DOI] [PubMed] [Google Scholar]
- Kwon H., Imbalzano,A.N., Khavari,P.A., Kingston,R.E. and Green,M.R. (1994) Nucleosome disruption and enhancement of activator binding by a human SWI/SNF complex. Nature, 370, 477–481. [DOI] [PubMed] [Google Scholar]
- Macatee T., Jiang,Y.W., Stillman,D.J. and Roth,S.Y. (1997) Global alterations in chromatin accessibility associated with loss of SIN4 function. Nucleic Acids Res., 25, 1240–1247. [DOI] [PMC free article] [PubMed] [Google Scholar]
- Makalowska I., Ferlanti,E.S., Baxevanis,A.D. and Landsman,D. (1999) Histone Sequence Database: sequences, structures, post-translational modifications and genetic loci. Nucleic Acids Res., 27, 323–324. [DOI] [PMC free article] [PubMed] [Google Scholar]
- Meersseman G., Pennings,S. and Bradbury,E.M. (1992) Mobile nucleosomes—a general behavior. EMBO J., 11, 2951–2959. [DOI] [PMC free article] [PubMed] [Google Scholar]
- Mewes H.W. et al. (1997) Overview of the yeast genome. Nature, 387, 7–8. [DOI] [PubMed] [Google Scholar]
- Muchardt C. and Yaniv,M. (1999) ATP-dependent chromatin remodelling: SWI/SNF and Co. are on the job. J. Mol. Biol., 293, 187–198. [DOI] [PubMed] [Google Scholar]
- Pennings S., Meersseman,G. and Bradbury,E.M. (1991) Mobility of positioned nucleosomes on 5S rDNA. J. Mol. Biol., 220, 101–110. [DOI] [PubMed] [Google Scholar]
- Peterson C.L., Dingwall,A. and Scott,M.P. (1994) Five SWI/SNF gene products are components of a large multisubunit complex required for transcriptional enhancement. Proc. Natl Acad. Sci. USA, 91, 2905–2908. [DOI] [PMC free article] [PubMed] [Google Scholar]
- Santisteban M.S., Arents,G., Moudrianakis,E.N. and Smith,M.M. (1997) Histone octamer function in vivo: mutations in the dimer–tetramer interfaces disrupt both gene activation and repression. EMBO J., 16, 2493–2506. [DOI] [PMC free article] [PubMed] [Google Scholar]
- Shimizu M., Roth,S.Y., Szent-Gyorgyi,C. and Simpson,R.T. (1991) Nucleosomes are positioned with base pair precision adjacent to the α2 operator in Saccharomyces cerevisiae. EMBO J., 10, 3033–3041. [DOI] [PMC free article] [PubMed] [Google Scholar]
- Smith R.L. and Johnson,A.D. (2000) Turning genes off by Ssn6–Tup1: a conserved system of transcriptional repression in eukaryotes. Trends Biochem. Sci., 25, 325–330. [DOI] [PubMed] [Google Scholar]
- Smith T.F., Gaitatzes,C., Saxena,K. and Neer,E.J. (1999) The WD repeat: a common architecture for diverse functions. Trends Biochem. Sci., 24, 181–185. [DOI] [PubMed] [Google Scholar]
- Struhl K. (1999) Fundamentally different logic of gene regulation in eukaryotes and prokaryotes. Cell, 98, 1–4. [DOI] [PubMed] [Google Scholar]
- Tanaka S., Livingstone-Zatchej,M. and Thoma,F. (1996) Chromatin structure of the yeast URA3 gene at high resolution provides insight into structure and positioning of nucleosomes in the chromosomal context. J. Mol. Biol., 257, 919–934. [DOI] [PubMed] [Google Scholar]
- Teunissen A.W., van den Berg,J.A. and Steensma,H.Y. (1995) Transcriptional regulation of flocculation genes in Saccharomyces cerevisiae. Yeast, 11, 435–446. [DOI] [PubMed] [Google Scholar]
- Treitel M.A. and Carlson,M. (1995) Repression by SSN6–TUP1 is directed by MIG1, a repressor activator protein. Proc. Natl Acad. Sci. USA, 92, 3132–3136. [DOI] [PMC free article] [PubMed] [Google Scholar]
- van Holde K.E. (1988) Chromatin. Springer-Verlag, New York, NY, p. 294.
- Varanasi U.S., Klis,M., Mikesell,P.B. and Trumbly,R.J. (1996) The Cyc8 (Ssn6)–Tup1 corepressor complex is composed of one Cyc8 and four Tup1 subunits. Mol. Cell. Biol., 16, 6707–6714. [DOI] [PMC free article] [PubMed] [Google Scholar]
- Vogelauer M., Wu,J., Suka,N. and Grunstein,M. (2000) Global histone acetylation and deacteylation in yeast. Nature, 408, 495–498. [DOI] [PubMed] [Google Scholar]
- Wach A., Brachat,A., Pohlmann,R. and Philippsen,P. (1994) New heterologous modules for classical or PCR-based gene disruptions in Saccharomyces cerevisiae. Yeast, 10, 1793–1808. [DOI] [PubMed] [Google Scholar]
- Wade P.A. and Wolffe,A.P. (1999) SWItching circuitry. Curr. Biol., 9, R221–R224. [DOI] [PubMed] [Google Scholar]
- Wechser M.A., Kladde,M.P., Alfieri,J.A. and Peterson,C.L. (1997) Effects of Sin– versions of histone H4 on yeast chromatin structure and function. EMBO J., 16, 2086–2095. [DOI] [PMC free article] [PubMed] [Google Scholar]
- Whitehouse I., Flaus,A., Cairns,B.R., White,M.F., Workman,J.L. and Owen-Hughes,T. (1999) Nucleosome mobilization catalysed by the yeast SWI/SNF complex. Nature, 400, 784–787. [DOI] [PubMed] [Google Scholar]