Abstract
Electron paramagnetic resonance-based inter-residue distance measurements between site-directed spin-labelled sites of sensory rhodopsin II (NpSRII) and its transducer NpHtrII from Natronobacterium pharaonis revealed a 2:2 complex with 2-fold symmetry. The core of the complex is formed by the four transmembrane helices of a transducer dimer. Upon light excitation, the previously reported flap-like movement of helix F of NpSRII induces a conformational change in the transmembrane domain of the transducer. The inter-residue distance changes determined provide strong evidence for a rotary motion of the second transmembrane helix of the transducer. This helix rotation becomes uncoupled from changes in the receptor during the last step of the photocycle.
Keywords: chemotaxis/protein–protein interaction/sensory rhodopsin/signal transduction/site-directed spin labelling
Introduction
Archaebacterial rhodopsins, a family of seven helix membrane proteins containing retinal as the chromophore, are receiving more and more interest because they can be considered as archetypes for signal transduction and ion transport. Representatives of this family have now been identified in all three domains of life (Oesterhelt and Stoeckenius, 1971; Bieszke et al., 1999; Beja et al., 2000). Functionally, two different classes can be distinguished. The ion pumps bacteriorhodopsin (BR) and halorhodopsin operate as energy converters, whereas the photoreceptors sensory rhodopsin I (SRI) and II [SRII, also named phoborhodopsin (Tomioka et al., 1986)] provide the initial signal, which enables the cells to seek favourable light conditions (for a recent review on retinal proteins see Spudich et al., 2000). The two photoreceptors are tightly complexed to receptor-specific transducers [Halobacterial transducer I (HtrI) and II (HtrII)]. The incoming light is relayed from the receptor to the cytoplasmic domain of the transducer, which in turn activates the two-component signalling cascade, well known from bacterial chemotaxis as well as from lower eukaryotic species. Both transducers, like the bacterial and archaebacterial chemoreceptors, contain two transmembrane-spanning helices, which are thought to be involved in the signal transfer across the membrane. From structural analysis as well as electron paramagnetic resonance (EPR) measurements, several models have been proposed to explain the signal transfer from the extracellular receptor domain to the cytoplasmic signal domain, which, in general, are based on the relative movement of the two transmembrane helices TM1 and TM2 (Kim, 1994; Chervitz and Falke, 1996; Ottemann et al., 1999).
It is to be expected that sensory rhodopsins follow a similar mechanism. The structural elucidation of BR and its photo-intermediates revealed an outward movement of helix F during the photocycle (reviewed in Lanyi and Luecke, 2001). For the sensory rhodopsins, a similar motion of helix F was assumed, which would trigger the functionally important conformational change in the corresponding transducers (Spudich, 1998). Indeed, using site-directed spin labelling (SDSL) it could be shown that helices F and G of the photophobic receptor from Natronobacterium pharaonis (NpSRII) are in close proximity to TM1 and TM2 of the cognate transducer (NpHtrII) (Wegener et al., 2000). Light excitation of NpSRII induces an outward tilt of helix F, thus substantiating the idea of a trigger unit between the C-terminal part of the photoreceptors and the two transmembrane helices of their transducers. However, the molecular mechanism of the signal transfer and the topology of the signalling complex are so far not known. In the present paper, EPR measurements of inter-residue distances between SDSL NpSRII and its transducer NpHtrII from N.pharaonis are presented, which allow the construction of molecular models of the ground state and of the light-induced conformational changes.
Results and discussion
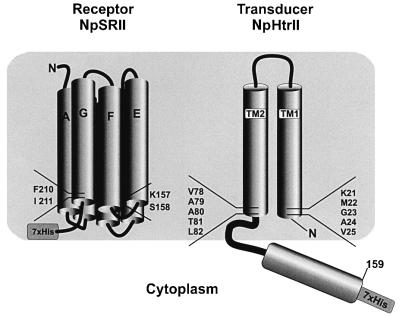
EPR experiments yield a wealth of information on the structure and dynamics of site-directed spin-labelled proteins and protein complexes (for a recent review see Hubbell et al., 2000). The EPR line shape analysis of spin-labelled cysteine substitution mutants allows to determine the mobility of the spin-label side chain, which provides information about the secondary and tertiary structure of the protein in the vicinity of the modified site. Evaluation of the collision frequency of the spin-label side chain with diffusing hydrophobic or hydrophilic paramagnetic molecules by means of saturation techniques orients the residue in question towards a lipid environment, the bulk phase, or the interior of a protein or protein–protein interface. Evaluation of the strength of the spin–spin interaction within doubly spin-labelled proteins provides inter-residue distance constraints. Time-resolved EPR experiments have been shown to supply kinetic data with information about conformational changes. In the present work, this technique was applied in order to analyse the interaction between NpSRII and its transducer NpHtrII. Previous EPR experiments have shown that in NpSRII the cytoplasmic end of helix F moves outwardly upon light excitation (Wegener et al., 2000). Guided by this observation, the transducer mutants were selected from the cytoplasmic helical turns of TM1 (K21–V25) and TM2 (V78–L82) (Figure 1). In the same work, it has been shown that NpSRII residues K157 and S158 as well as F210 and I211, located on the cytoplasmic moiety of helix F and G, respectively, face the transducer molecule. Hence, the choice of these mutants allows elucidation of the receptor–transducer interaction on the one hand, and transducer–transducer interaction on the other, by measurement of contact interaction and inter-spin distances derived from the spin–spin coupling within a putative Htr dimer and within the NpSRII–Htr complex. Furthermore, time-resolved experiments will give insight into the mechanism of signal transfer between the activated receptor and the transmembrane helices of the transducer.
Fig. 1. Scheme of single-site mutations in NpSRII and NpHtrII. The amino acids indicated were mutated to Cys residues and subsequently modified with the MTS spin label. The EPR experiments were performed by combining either a NpHtrII mutant with wild-type NpSRII (carrying the His tag) or by using NpHtrII and NpSRII, both mutated at specific sites. The resulting combinations are tabulated in Table I.
For the present experiments, the transducer was truncated C-terminally of Leu159 (abbreviated t-Htr, or t-HtrHis where a histidine tag is added for purification purposes) because the full-length transducer could not be expressed in sufficient amounts for EPR experiments. This truncated construct lacks the entire signalling and methylation domain (see Figure 1 for a schematic representation). However, with respect to the interaction with the receptor NpSRII, the functionality of this construct was unimpaired, as could be shown in studies involving the binding of the transducer to the receptor using blue native gel electrophoresis and isothermal calorimetry experiments (Wegener, 2000). Additional information about the intact properties of the complex is provided by electrophysiological measurements (Schmies, 2001). Following the observation that the innate ability of NpSRII to pump protons upon light excitation is blocked by the binding of its cognate transducer (Schmies et al., 2001; Sudo et al., 2001), Schmies (2001) observed the same effect for t-Htr. Thus, t-Htr can be taken as a model system for the receptor–transducer interaction.
Mobility analysis of spin-labelled t-Htr mutants
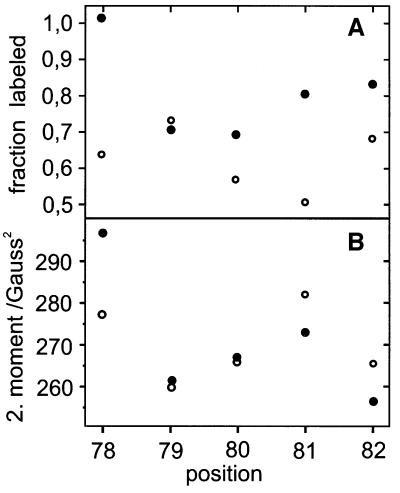
The efficiency of spin labelling clearly reveals differences between receptor-bound and receptor-free transducers (Figure 2A). With the exception of position 79, the relative yield of labelled protein is reduced if NpSRII is bound. In these experiments, t-Htr was expressed in excess over the His-tagged NpSRII and co-purified using a Ni column. However, even under these conditions, the ratio of spin-labelled tHtr to NpSRII was always <1, indicating a 1:1 stoichiometry in the solubilized co-purified complex. The labelling efficiency versus residue number indicate a periodicity of ∼3–4 amino acids, which is commensurable with an α-helix in tertiary contact.
Fig. 2. (A) Relative efficiency of the spin-label reaction to selected residues of TM2 in the presence (open circles) and absence (closed circles) of the receptor NpSRIIHis. The error for each data point is ± 5%. (B) Sequence-dependent course of the 2. spectral moment of the EPR cw spectra at room temperature (297K) of the above TM2 mutants in the presence (open circles) and absence (closed circles) of the receptor NpSRIIHis (error <5 G2). The samples were measured in detergents.
A similar periodic alternation is observed for the mobility of the spin-labelled side chains on t-HtrHis (Figure 2B). These data were obtained by an analysis of the second spectral moment as an empirical measure that weights the spectral contributions due to motional restrictions (see Materials and methods; Hubbell et al., 1996; Mchaourab et al., 1996). If t-Htr is co-purified with NpSRIIHis, the strongest immobilization is observed for T81R1, indicating a close contact between receptor and transducer at this site. Assuming a helical structure, A79R1 should be oriented towards the opposite direction and therefore should not be affected by the receptor. Indeed, this is observed, as it is reflected by the high nitroxide mobility found at position 79 and the comparably high spin-labelling efficiency.
A similar helical pattern was determined for the TM1 mutants with K21 and V25 facing the receptor (data not shown). Summarizing this section, t-Htr residues that face NpSRII can be identified comprising T81 from TM2 as well as K21 and V25 from TM1.
Distance measurements within the transducer dimer
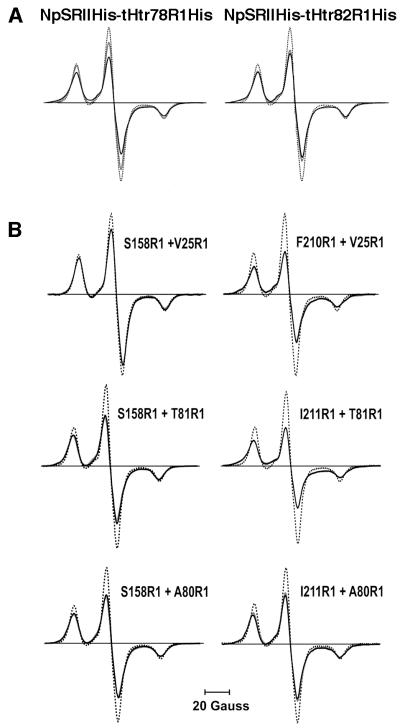
Reconstitution of independently purified t-HtrHis and NpSRIIHis in a 1:1 stoichiometry into polar lipids from purple membrane resulted in a strong immobilization of the nitroxide side chains of t-HtrHis. This motional restriction is reflected by the mean value of the second moment increasing from 265 to 290 G2. Interestingly, for V78R1 and L82R1, the corresponding values are significantly larger (up to 340 G2; calculated from the spectra shown in Figure 3A), indicating dipolar interactions between the spin labels of two adjacent TM2 helices. Whereas the second moment analysis might be affected by the residue dynamics of the nitroxide side chains, these contributions can be excluded for measurements at 170K, the temperature that was shown to provide rigid limit conditions (Steinhoff et al., 1997). Under these conditions, only the spectra of V78R1 and L82R1 show considerable line broadening due to dipolar interaction (Figure 3A; Table I).
Fig. 3. EPR powder spectra (T = 170K) of spin-labelled tHtrHis mutants in 1:1 complex with (A) NpSRIIHis and (B) spin-labelled NpSRII mutants. All samples are reconstituted into purple membrane lipids (PMLs). Spin-normalized EPR powder spectra of the ground state (black) are compared with the M-accumulated state (grey) and a reference spectrum without dipolar broadening determined from the solubilized single mutant S158R1 (dotted). The strength of dipolar interaction and the resulting line broadening are obvious by comparing the amplitudes of spin-number normalized spectra of the PML-reconstituted complexes with the reference samples.
Table I. Distances determined from the simulation of powder spectra of 1:1 complexes of (A) NpSRIIHis with t-HtrHis mutants and (B) NpSRIIHis mutants with t-HtrHis mutants.
| (A) | t-Htr (TM1) |
||||
| |
21/21 |
22/22 |
23/23 |
24/24 |
25/25 |
| Inter-spin distance (nm) |
>1.9 |
1.7 ± 0.2 |
>1.9 |
>1.9 |
>1.9 |
| t-Htr (TM2) |
|||||
| |
78/78 |
79/79 |
80/80 |
81/81 |
82/82 |
| Inter-spin distance (nm) |
1.2 ± 0.2 (60) |
1.8 ± 0.2 (48) |
>1.9 |
>1.9 |
1.2 ± 0.1 (53) |
| (B) | NpSRII |
||||
| t-Htr |
157 |
158 |
210 |
211 |
|
| 21 | 1.6 ± 0.2 (47) | 1.4 ± 0.2 (65) | |||
| 22 | 1.4 ± 0.2 (51) | 1.6 ± 0.2 (42) | |||
| 23 | >1.9 | >1.8 | |||
| 24 | 1.7 ± 0.2 (55) | 1.5 ± 0.2 (63) | |||
| 25 | >1.8 | 1.2 ± 0.1 (43) | |||
| 80 | 1.6 ± 0.2 (50) | 1.4 ± 0.2 (45) | 1.6 ± 0.2 (55) | 1.4 ± 0.2 (52) | |
| 81 | >1.9 | 1.5 ± 0.2 (40) | 1.3 ± 0.2 (52) | 1.1 ± 0.1 (51) | |
The fraction of singly spin-labelled complex is given in parentheses (estimated error 10%).
Fitting of simulated EPR spectra (see Materials and methods; Steinhoff et al., 1997) reveals values for the inter-spin distances of <1.2 nm. This value is in line with a topology model in which the two TM2 helices face each other via a common surface comprising V78 and L82. Contrary to the above described closely interacting TM2 helices, the TM1 helices seem to be further apart. Of the five spin-labelled positions of TM1, only the spectrum of M22R1 displays a weak spin–spin coupling, which again points to a 1:1 assembly of TM1. The data presented are in agreement with a t-Htr dimer characterized by a 2-fold symmetry axis.
Distance measurements between NpSRII and t-Htr
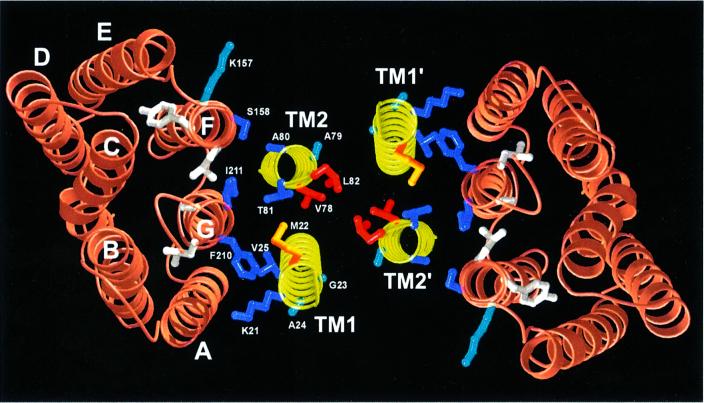
To determine the topology of the NpSRII–NpHtrII reconstituted complex, distance measurements between TM1 or TM2 and helix F or G were performed. All five spin-labelled residues of TM1 (21–25) and two of TM2 (80 and 81) were selected. The other three sites of TM2 were not included in this series of measurements: the spectra of V78R1 and L82R1 are already dipolarly broadened due to spin–spin interaction within the TM2 dimer, which makes the determination of distances to a third spin difficult. Position 79 is likely to point away from the TM2–NpSRII interface, as deduced from the nitroxide mobility and the accessibility of the cysteine for the spin-labelling reaction. The spin-labelled t-Htr mutants were separately combined with the corresponding NpSRII mutants spin labelled at helix G (K157R1; S158R1) or helix F (F210R1; I211R1). Selected spectra that show significant dipolar line broadening are depicted in Figure 3B. Inter-spin distances determined by fitting of simulated EPR spectra (see Materials and methods; Table I; Steinhoff et al., 1997) were used as constraints for the topological arrangement of the NpHtrII–NpSRII complex. The strongest interactions, corresponding to the closest distances, are observed between positions 25TM1 and 210G, 81TM2 and 210G, as well as between 81TM2 and 211G, indicating that both TM1 and TM2 are close to helix G. Medium distances (1.2–1.6 nm) are determined for the following five TM2–NpSRII pairs: 80TM2–158F, 80TM2–157F, 80TM2– 210G, 80TM2–211G and 81TM2–158F (see Figure 4 for residue positions). Again, these data place TM2 close to helix G with the nitroxide side chain A80R1 located between side chains S158R1 and I211R1. According to the determined inter-spin distance values, TM2 has to be located between the C-terminal helices F and G, as depicted in Figure 4. This model is in line with the observation that the accessibility of S158R1 for a water-soluble quencher is abolished in the presence of t-HtrHis (Wegener et al., 2000). In this paper, another effect described concerns transducer binding to NpSRII, which blocked the oxygen accessibility at position 210. The specific dimer formation of the NpSRII–t-Htr complex in membranes orients the respective positions 22 of TM1 and TM1′ towards each other. These findings, and the distance values determined between the residual spin-labelled positions of TM1, 21, 23 and 24, and 210 or 158, are in agreement with this arrangement.
Fig. 4. Model of the transmembrane region of the proposed 2:2 complex of NpSRII with its transducer NpHtrII (view from cytoplasm). The structure of NpSRII (orange) is based on a BR-crystal structure (Essen et al., 1998), validated for side chains 157–160 (helix F) and 210–213 (helix G) (Wegener et al., 2000). Transmembrane helices of NpHtrII modelled as canonical α-helices (yellow) with side chains K21–V25 (TM1) as well as V78–L82 (TM2) in ball and stick representation. These components are oriented with respect to each other based on dipolar spin–spin interactions and derived distance constraints. Strong dipolar interactions between spin-labelled positions of NpSRII and those on the transmembrane helices of NpHtrII are represented as blue side chains. Red side chains label spin–spin interactions in the dimer interface of two TM2 helices. Weak interactions are depicted in cyan or orange, respectively.
These results reveal a quaternary complex between two copies each of t-Htr and NpSRII, forming a structure with an apparent 2-fold symmetry (Figure 4). In this model (Figure 4), helices F and G of NpSRII are in contact with TM1 and TM2 of t-Htr. Importantly, helix F, which has been shown to move outwardly on light excitation, is close to TM2. The present model is perfectly in agreement with results from oxidative cross-linking of mono cysteine HtrI mutants (Zhang and Spudich, 1998).
Light-induced distance changes
Upon light excitation, the receptor proceeds to the long-lived M-state, which was proposed to represent the signalling state (Yan et al., 1991). In previous work, it has been demonstrated that during this reaction, helix F is tilted outwardly towards the transducer. In particular, the mobility of the spin label at position 158 is transiently restricted, most probably due to an increased interaction with the neighbouring transducer (Wegener et al., 2000). These changes are now analysed in more detail by comparing the inter-residue distances within the transducer dimer as well as between the receptor and transducer in the ground state and the M-state (Table I). In general, the receptor–transducer complex undergoes neither an assembly nor a disassembly step during light activation, as most dipolar interactions persist in the M-state. TM1 seems to function as a fixed point in the signalling process, similar to helix G of NpSRII, as both helices do not alter their relative orientation at all.
However, decreases and increases in the interaction strengths are observable between the two TM2, and between TM2 and helix F of NpSRII. The reported movement of the cytoplasmic part of helix F towards the transducer (Wegener et al., 2000) is also observed here, as the distances between residues S158R1/K157R1 of helix F and TM2 residues A80R1/T81R1 change in the M-state (<0.1 nm; detection limit 0.05 nm). Simultaneously, the strong dipolar interaction between the two V78R1 in neighbouring TM2 helices is significantly reduced (+0.2 nm). On the other hand, the distance between the two L82R1 sites does not change significantly, although this amino acid is only one helical turn apart from V78R1.
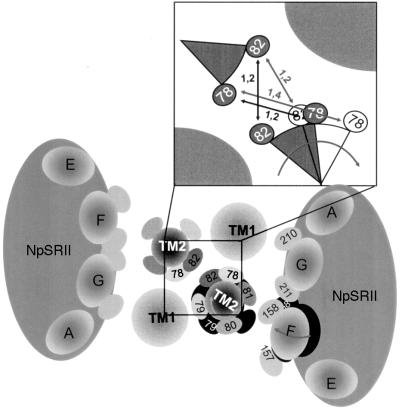
This latter observation allows us to assign a molecular mechanism of signal transfer between receptor and transducer. There have been several models proposed in terms of mechanism, e.g. piston, scissors, or twist movements to explain the transmembrane signal transfer in chemoreceptors (Kim, 1994; Chervitz and Falke, 1996; Ottemann et al., 1999). From these various mechanisms, a clockwise rotation of TM2 is consistent with the data presented here (see Figure 5, insert). This model can easily explain the apparent distance changes between V78R1–V78R1′ and L82R1–L82R1′. A clockwise rotation of TM2 would enlarge the gap between V78R1 and V78R1′. To account for the 0.2 nm distance increase between ground state and the M-state, a rotational angle of ∼20–30° would suffice. This value was estimated by assuming that the side chains of V78R1 and L82R1 and their TM2′ counterparts did not rearrange after the rotation. L82R1 being on the same helix would evidently experience the same rotation; however, the start and end point would be symmetrical in relation to L82R1′ on TM2′. Thus, the distance between these two amino acids is not altered. The distance changes observed between helix G positions 210 or 211 and A80R1 or T81R1 of TM2 are in agreement with a repacking of these side chains due to the rotation of TM2. It is important to note that an additional small piston-like movement (<0.3 nm) of TM2 cannot be excluded.
Fig. 5. Schematic illustration of light-induced conformational changes within the transmembrane region of the 2:2 complex of NpSRII with NpHtrII viewed from the cytoplasm. According to distance changes in the signalling M-state conformation, helix F moves outwardly in the direction of the neighbouring TM2, which in turn is rotated clockwise, as indicated by the grey arrows. Black areas represent the original positions. The inset shows a close-up of the dimer interface, suggesting the relative orientations of V78R1 and L82R1 in the dark (grey) and the light-activated state (white). The numbers on the arrows depict the distances (in nm) between corresponding residues in the dark (black) and light (grey) states.
Kinetic analysis
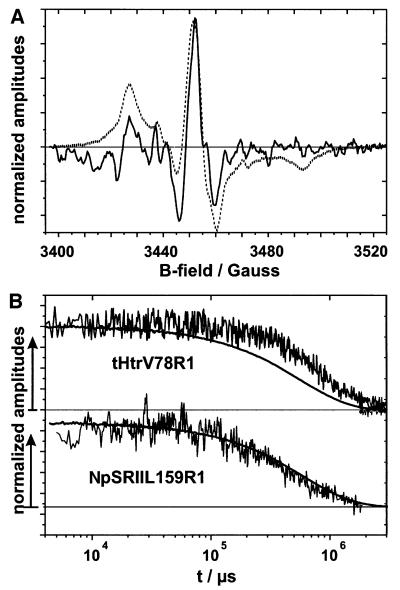
To study the conformational changes under more physiological temperatures, EPR difference spectra between the excited state minus dark state were recorded at 293K. Significant spectral changes were detected for V87R1 in the NpSRII–t-Htr complex, whereas spin labels at positions 79 and 80 revealed only minor spectral alterations. In the latter cases, difference spectra can be attributed to a slight transient immobilization and mobilization, respectively. The difference spectrum of V78R1 (Figure 6A) can be explained by a transient increase in the inter-spin distance during or prior to the formation of the M-state, which corroborates the deduction from the low-temperature spectra. However, one should keep in mind that an additional alteration in the reorientational motion of the spin label in the M-state cannot be excluded, although it does not manifest in the spectral shape of the difference spectrum.
Fig. 6. (A) Light-induced difference spectrum of the membrane assembled complex NpSRIIHis–t-HtrV78R1His (solid line) compared with a cw-EPR spectrum. (B) EPR transients (noisy grey line) and the corresponding optical trace recorded at 500 nm (black line) of the same sample (upper trace) and NpSRII mutant L159R1 (lower trace). Amplitudes are normalized to the maximum value.
From Figure 6A, it is evident that major spectral changes occur at the maximum of the mid-field resonance at 3455 G. The time course of this signal can be followed by time-resolved EPR spectroscopy (Steinhoff et al., 1994). In Figure 6B, the EPR trace recorded for V78R1 is compared with that of L159R1, which corresponds to an amino acid position on helix F pointing to the interior of the receptor. Additionally, an optical trace monitoring the depletion and re-formation of the NpSRII ground state (at 500 nm) is depicted. Earlier work revealed a transient mobilization of L159R1 during the photocycle, which was shown to indicate an outward movement of helix F of NpSRII (Wegener et al., 2000). Thus, the three different signals shown in Figure 6B record events occurring at the level of the retinal chromophore (500 nm optical trace), of helix F (L159R1, EPR trace) and of TM2 (V78R1, EPR trace), which allows us to follow the signal transfer in the sequence retinal → helix F → TM2 and vice versa. It is obvious from the three traces that the formation of the activated receptor–transducer complex is faster than the time resolution of the EPR device. This state remains unchanged from 5 ms to 100 ms after light excitation. With the re-formation of the ground state, the reactions characteristic for the receptor are decoupled from those of the transducer. The reset movement of helix F into the original position precedes the back rotation of TM2, the latter being delayed in time by about a factor of four.
Concluding remarks
Conformational alterations within dimer interfaces play a key role in activating signal transduction chains mediated by membrane receptors such as receptor tyrosine kinases (Fantl et al., 1993) or two-component systems in chemo- and phototaxis (Falke et al., 1997). The activation of transducin by rhodopsin might occur by a rigid body movement of helix VII, as deduced from EPR distance measurements (Farrens et al., 1996). Here we applied site-directed spin labelling and EPR spectroscopy to study the contact interface and conformational changes of the NpSRII–Htr complex. Since buried sites may stabilize specific rotamers of spin-label side chains and therefore may bias the estimated inter-spin distances and distance changes (Hubbell et al., 2000), several spin-label pairs at different sites have been used. The resulting data can be explained by a native receptor–transducer 2:2 complex with a 2-fold symmetry axis. Upon light excitation of the retinal chromophore, helix F moves in a flap-like motion in the direction of TM2, which simultaneously experiences a clockwise rotation
Although the formation of a pseudo four helix bundle in the transmembrane region resembles structural features of the eubacterial chemoreceptors, the mechanism of transmembrane signalling might be different. As was shown for the aspartate receptor from Salmonella typhimurium, the periplasmic extension of one TM2 moves—upon binding of the substrate—towards the cell interior by ∼0.16 nm and tilts with an angle of 5° (Chervitz and Falke, 1996). Moreover, evidence of a piston-like movement (<0.25 nm) of TM2 was provided by Ottemann et al. (1999). It should also be noted that HtrII from Halobacterium salinarum possess a periplasmic domain with properties of a serine receptor (Hou et al., 1998). It is, therefore, likely that the mechanisms of signal transduction for chemotaxis and phototaxis are similar. Whether solely the rotary mechanism described here or a combination with a piston movement is responsible for the signal transfer remains to be elucidated.
An important outcome of the present work is the decoupling of TM2 motion from the return of the photoreceptor to the ground state, which enables the transducer to exist separately in the active state and to operate independently from the photoreceptor. Previously, it has been established that the photo-signalling state in H.salinarum is reached during the formation of the M-state (Yan et al., 1991). Obviously, the physiological response to this activation only needs the trigger and not the time constraint entrained by the receptor. This decoupling allows the system to modulate the activation/deactivation of the transducer, thereby enabling the bacteria to respond to external stimuli adequately.
Materials and methods
Cloning and expression of t-Htr-cysteine mutants
The C-terminal truncated transducer (1–159) was subcloned into a pET27bmod expression vector (Klostermeier et al., 1998) with a C-terminal His7 tag according to Wegener et al. (2000). The resulting plasmid, pET27bmod-t-HtrHis, was used as a template for two-step PCR mutagenesis according to the overlap extension method described by Ho et al. (1989). Positive clones were verified by DNA sequencing. Expression and purification of t-HtrHis mutants essentially followed the protocol described for the co-expression with NpSRII (Wegener et al., 2000). Protein concentrations were determined by measuring the absorbance at 205 nm (Hempling, 1989). The concentrations of spin-labelled cysteine mutants were calculated using the spin number derived from double integration of the EPR spectra correlated with a spin-label standard of known concentration. The efficiency of spin labelling was calculated by: spin-number (t-HtrHis)/concentration (t-HtrHis) for free transducer mutants or spin-number (t-HtrHis)/concentration (NpSRII) for transducer mutants co-expressed with NpSRIIHis.
Expression and spin labelling of cysteine mutants
NpSRIIHis as well as the t-HtrHis and the NpSRIIHis–t-Htr complex were expressed in Escherichia coli BL21 (DE3), and purified as described (Hohenfeld et al., 1999). The spin label (1-oxyl-2,2,5,5-tetramethylpyrroline-3-methyl) methanethiosulfonate (MTS; TRC, Toronto, Canada) was covalently attached to the cysteine residues of the solubilized NpSRII or t-Htr mutants according to Pfeiffer et al. (1999) and samples were finally prepared following the procedure described previously (Wegener et al., 2000). In order to exclude the detrimental effect of inefficient labelling on the measurements of dipolar spin–spin interactions, both components, the NpSRIIHis and the t-HtrHis mutants, were prepared independently and mixed in a 1:1 ratio before reconstitution into purple membrane lipids (PMLs). For reconstitution into the native PML, the 1:1 mixtures were shaken (16 h at 4°C in the dark) in a buffer (1 M NaCl, 100 mM NaH2PO4/Na2HPO4 pH 6–8) containing a 25-fold excess of lipids and detergent-absorbing biobeads [SM2; 10 mg/mg dodecyl-maltoside (DDM); Boehringer Mannheim]. Thereby, the concentration of DDM was adjusted to be <0.1–0.05%. After filtration, the reconstituted proteins were pelleted by centrifugation at 14 000 r.p.m. and resuspended in 150 mM NaCl, 10 mM Tris pH 8.0.
EPR measurements
Continuous wave EPR experiments were performed using X-band EPR spectrometers of our own construction equipped with an AEG H103 rectangular cavity or a dielectric resonator (Bruker). The magnetic field was measured with a B-NM 12 B-field meter (Bruker). Samples were loaded into EPR quartz capillaries (50 µl for low-temperature measurements in the rectangular cavity, otherwise 5 µl) at a final concentration of 100–300 µM. Spectra were recorded with a modulation amplitude of 1.5 G, and microwave power adjusted to between 0.1 and 0.6 mW. A modified Oxford ESR 9 variable temperature accessory allowed stabilization of the sample temperature between 80 and 330K. In order to trap the M-intermediate, a 100 W halogen lamp was used to illuminate (530 nm cut-off filter and a heat filter) the sample during the freezing process. Spectra for inter-spin distance determination were recorded at 170K in order to freeze molecular motion (Steinhoff et al., 1994, 1997).
Fitting of simulated EPR spectra
Fitting of simulated dipolar broadened EPR powder spectra to the experimental data of doubly spin-labelled samples was performed according to the method described in detail by Steinhoff et al. (1994, 1997). Owing to the flexible spin-label side chain, a random distribution of nitroxide ring orientations with respect to the inter-spin vector is assumed. To account for a range of distances expected to arise from these different orientations, a Gaussian distribution of inter-spin distances with a fixed width of 0.2 nm is permitted. During the fitting procedure, the g-tensor values, two components of the A-tensor and the line width parameters were fixed according to the values found from analysis of the superposition of the singly spin-labelled samples. These values are: gxx = 2.0087, gyy = 2.0066, gzz = 2.0026, Axx = 5.2 G, Ayy = 4.5 G. Azz was variable to account for a possible polarity variation in the vicinity of the nitroxides. The spectra were convoluted with a field-independent line-shape function, composed of a superposition of 44% Lorentzian and 56% Gaussian of 3.3 and 3.9 G width, respectively. The list of fitting parameters is thus composed of the average inter-spin distance, the fraction of singly labelled complex and Azz. Examples of fitted simulations and the corresponding measured spectra shown in Figure 7 prove the quality of the spectra analysis. Second moment calculation was performed according to Radzwill et al. (2001).
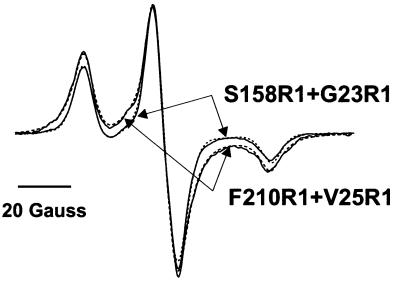
Fig. 7. EPR spectra of the double spin-labelled samples S158R1+G23R1 and F210R1+V25R1 measured at 170K. The dashed lines represent the best fits of simulated powder spectra with the inter-spin distance, the ratio of singly to doubly spin-labelled protein and the hyperfine tensor element Azz as adjustable parameters. The fitted distance and ratio values are given in Table I; Azz is 35.7 G for S158R1+G23R1 and 35.5 G for F210R1+V25R1.
Acknowledgments
Acknowledgements
We would like to thank Paul J.Rothwell for reading the manuscript and Ralf P.Seidel for providing the genomic clones of NpSRII and NpHtrII. The financial support of the Deutsche Forschungsgemeinschaft (SFB 394, En 87 10-3/4) is gratefully acknowledged.
Note added in proof
A crystal structure of NpSRII at 2.4 Å has recently been described by Luecke et al. [Luecke,H., Schobert,B., Lanyi,J.K., Spudich,E.N. and Spudich,J.L. (2001) Crystal structure of sensory rhodopsin II at 2.4 Å: insights into color tuning and transducer interaction. Science, 293, 1449–1503] confirming the assignments made for the spin-labelled NpSRII residues (see Figure 4).
References
- Beja O. et al. (2000) Bacterial rhodopsin: evidence for a new type of phototrophy in the sea. Science, 289, 1902–1906. [DOI] [PubMed] [Google Scholar]
- Bieszke J.A., Braun,E.L., Bean,L.E., Kang,S.C., Natvig,D.O. and Borkovich,K.A. (1999) The nop-1 gene of Neurospora crassa encodes a seven transmembrane helix retinal-binding protein homologous to archaeal rhodopsins. Proc. Natl Acad. Sci. USA, 96, 8034–8039. [DOI] [PMC free article] [PubMed] [Google Scholar]
- Chervitz S.A. and Falke,J.J. (1996) Molecular mechanism of transmembrane signaling by the aspartate receptor—a model. Proc. Natl Acad. Sci. USA, 93, 2545–2550. [DOI] [PMC free article] [PubMed] [Google Scholar]
- Essen L.O., Siegert,R., Lehmann,W.D. and Oesterhelt,D. (1998) Lipid patches in membrane protein oligomers—crystal structure of the bacteriorhodopsin–lipid complex. Proc. Natl Acad. Sci. USA, 95, 11673–11678. [DOI] [PMC free article] [PubMed] [Google Scholar]
- Falke J.J., Bass,R.B., Butler,S.L., Chervitz,S.A. and Danielson,M.A. (1997) The two-component signaling pathway of bacterial chemotaxis—a molecular view of signal transduction by receptors, kinases and adaptation enzymes. Annu. Rev. Cell Dev. Biol., 13, 457–512. [DOI] [PMC free article] [PubMed] [Google Scholar]
- Fantl W.J., Johnson,D.E. and Williams,L.T. (1993) Signalling by receptor tyrosine kinases. Annu. Rev. Biochem., 62, 453–481. [DOI] [PubMed] [Google Scholar]
- Farrens D.L., Altenbach,C., Yang,K., Hubbell,W.L. and Khorana,H.G. (1996) Requirement of rigid-body motion of transmembrane helices for light activation of rhodopsin. Science, 274, 768–770. [DOI] [PubMed] [Google Scholar]
- Hempling H.G. (1989) Analysis of ion channels by modeling the osmotic effects of weak acids and bases. J. Membr. Biol., 110, 127–137. [DOI] [PubMed] [Google Scholar]
- Ho S.N., Hunt,H.D., Horton,R.M., Pullen,J.K. and Pease,L.R. (1989) Site-directed mutagenesis by overlap extension using the polymerase chain reaction. Gene, 77, 51–59. [DOI] [PubMed] [Google Scholar]
- Hohenfeld I.P., Wegener,A.A. and Engelhard,M. (1999) Purification of histidine tagged bacteriorhodopsin, pharaonis halorhodopsin and pharaonis sensory rhodopsin II functionally expressed in Escherichia coli. FEBS Lett., 442, 198–202. [DOI] [PubMed] [Google Scholar]
- Hou S.B., Brooun,A., Yu,H.S., Freitas,T. and Alam,M. (1998) Sensory rhodopsin II transducer HtrII is also responsible for serine chemotaxis in the archaeon Halobacterium salinarum. J. Bacteriol., 180, 1600–1602. [DOI] [PMC free article] [PubMed] [Google Scholar]
- Hubbell W.L., Mchaourab,H.S., Altenbach,C. and Lietzow,M.A. (1996) Watching proteins move using site-directed spin labeling. Structure, 4, 779–783. [DOI] [PubMed] [Google Scholar]
- Hubbell W.L., Cafiso,D.S. and Altenbach,C. (2000) Identifying conform ational changes with site-directed spin labeling. Nature Struct. Biol., 7, 735–739. [DOI] [PubMed] [Google Scholar]
- Kim S.-H. (1994) ‘Frozen’ dynamic dimer model for transmembrane signaling in bacterial chemotaxis receptors. Protein Sci., 3, 159–165. [DOI] [PMC free article] [PubMed] [Google Scholar]
- Klostermeier D., Seidel,R. and Reinstein,J. (1998) Functional properties of the molecular chaperone DnaK from Thermus thermophilus. J. Mol. Biol., 279, 841–853. [DOI] [PubMed] [Google Scholar]
- Lanyi J.K. and Luecke,H. (2001) Bacteriorhodopsin. Curr. Opin. Struct. Biol., 11, 415–419. [DOI] [PubMed] [Google Scholar]
- Mchaourab H.S., Lietzow,M.A., Hideg,K. and Hubbell,W.L. (1996) Motion of spin-labeled side chains in T4 lysozyme. Correlation with protein structure and dynamics. Biochemistry, 35, 7692–7704. [DOI] [PubMed] [Google Scholar]
- Oesterhelt D. and Stoeckenius,W. (1971) Rhodopsin-like protein from the purple membrane of Halobacterium halobium. Nature New Biol., 233, 149–152. [DOI] [PubMed] [Google Scholar]
- Ottemann K.M., Xiao,W., Shin,Y.K. and Koshland,D.E.J. (1999) A piston model for transmembrane signaling of the aspartate receptor. Science, 285, 1751–1754. [DOI] [PubMed] [Google Scholar]
- Pfeiffer M., Rink,T., Gerwert,K., Oesterhelt,D. and Steinhoff,H.J. (1999) Site-directed spin-labeling reveals the orientation of the amino acid side-chains in the E-F loop of bacteriorhodopsin. J. Mol. Biol., 287, 163–171. [DOI] [PubMed] [Google Scholar]
- Radzwill N., Gerwert,K. and Steinhoff,H.-J. (2001) Time-resolved detection of transient movement of helices F and G in doubly spin-labeled bacteriorhodopsin. Biophys. J., 80, 2856–2866. [DOI] [PMC free article] [PubMed] [Google Scholar]
- Schmies G. (2001) Spektroskopische und elektrophysiologische Untersuchung der beiden archaebakteriellen Photorzeptor/Transducer- Komplexe. PhD Thesis, University of Dortmund, Dortmund, Germany.
- Schmies G., Engelhard,M., Wood,P.G., Nagel,G. and Bamberg,E. (2001) Electrophysiological characterization of specific interactions between bacterial sensory rhodopsins and their transducers. Proc. Natl Acad. Sci. USA, 98, 1555–1559. [DOI] [PMC free article] [PubMed] [Google Scholar]
- Spudich J.L. (1998) Variations on a molecular switch—transport and sensory signalling by archaeal rhodopsins. Mol. Microbiol., 28, 1051–1058. [DOI] [PubMed] [Google Scholar]
- Spudich J.L., Yang,C.S., Jung,K.H. and Spudich,E.N. (2000) Retinylidene proteins: structures and functions from Archaea to humans. Annu. Rev. Cell Dev. Biol., 16, 365–392. [DOI] [PubMed] [Google Scholar]
- Steinhoff H.J., Mollaaghababa,R., Altenbach,C., Hideg,K., Krebs,M., Khorana,H.G. and Hubbell,W.L. (1994) Time-resolved detection of structural changes during the photocycle of spin-labeled bacteriorhodopsin. Science, 266, 105–107. [DOI] [PubMed] [Google Scholar]
- Steinhoff H.J., Radzwill,N., Thevis,W., Lenz,V., Brandenburg,D., Antson,A., Dodson,G. and Wollmer,A. (1997) Determination of interspin distances between spin labels attached to insulin: comparison of electron paramagnetic resonance data with the X-ray structure. Biophys. J., 73, 3287–3298. [DOI] [PMC free article] [PubMed] [Google Scholar]
- Sudo Y., Iwamoto,M., Shimono,K., Sumi,M. and Kamo,N. (2001) Photo-induced proton transport of pharaonis phoborhodopsin (sensory rhodopsin II) is ceased by association with the transducer. Biophys. J., 80, 916–922. [DOI] [PMC free article] [PubMed] [Google Scholar]
- Tomioka H., Takahashi,T., Kamo,N. and Kobatake,Y. (1986) Flash spectroscopic identification of a fourth rhodopsin-like pigment in Halobacterium halobium. Biochem. Biophys. Res. Commun., 139, 389–395. [DOI] [PubMed] [Google Scholar]
- Wegener A.A. (2000) Untersuchungen zur Wechselwirkung des archaebakteriellen Lichtrezeptors NpSRII mit seinem Transducerprotein pHtrII. PhD Thesis, University of Dortmund, Dortmund, Germany.
- Wegener A.A., Chizhov,I., Engelhard,M. and Steinhoff,H.J. (2000) Time-resolved detection of transient movement of helix F in spin-labelled pharaonis sensory rhodopsin II. J. Mol. Biol., 301, 881–891. [DOI] [PubMed] [Google Scholar]
- Yan B., Takahashi,T., Johnson,R. and Spudich,J.L. (1991) Identification of signaling states of a sensory receptor by modulation of lifetimes of stimulus-induced conformations: the case of sensory rhodopsin II. Biochemistry, 30, 10686–10692. [DOI] [PubMed] [Google Scholar]
- Zhang X.-N. and Spudich,J.L. (1998) HtrI is a dimer whose interface is sensitive to receptor photoactivation and His-166 replacements in sensory rhodopsin I. J. Biol. Chem., 273, 19722–19728. [DOI] [PubMed] [Google Scholar]


