

Abstract
P-glycoprotein (P-gp) is an ABC (ATP-binding cassette) transporter, which hydrolyses ATP and extrudes cytotoxic drugs from mammalian cells. P-gp consists of two transmembrane domains (TMDs) that span the membrane multiple times, and two cytoplasmic nucleotide-binding domains (NBDs). We have determined projection structures of P-gp trapped at different steps of the transport cycle and correlated these structures with function. In the absence of nucleotide, an ∼10 Å resolution structure was determined by electron cryo-microscopy of two-dimensional crystals. The TMDs form a chamber within the membrane that appears to be open to the extracellular milieu, and may also be accessible from the lipid phase at the interfaces between the two TMDs. Nucleotide binding causes a repacking of the TMDs and reduction in drug binding affinity. Thus, ATP binding, not hydrolysis, drives the major conformational change associated with solute translocation. A third distinct conformation of the protein was observed in the post-hydrolytic transition state prior to release of ADP/Pi. Biochemical data suggest that these rearrangements may involve rotation of transmembrane α-helices. A mechanism for transport is suggested.
Keywords: ABC transporters/membrane protein structure/multidrug resistance/two-dimensional crystals
Introduction
ABC (ATP-binding cassette) transporters form one of the largest protein families, are found in all taxa, and utilize the energy of ATP hydrolysis to pump solutes across cellular membranes (Higgins et al., 1986; Higgins, 1992). In mammals, many ABC transporters are associated with clinical pathologies. Diseases as diverse as cystic fibrosis, intrahepatic cholestasis of pregnancy, adrenoleukodystrophy, Stargardt macular dystrophy and Tangier disease are caused by mutations in ABC transporter genes. In tumours, failure of chemotherapy is frequently due to over-expression of one or more ABC transporters, of which the multidrug resistance P-glycoprotein (P-gp) encoded by the MDR1 gene is the best characterized. P-gp confers resistance to cytotoxic drugs by pumping them from the cell, reducing their cytoplasmic concentration and, hence, their toxicity (reviewed by Ambudkar et al., 1999).
P-gp consists of four domains. Two hydrophobic transmembrane domains (TMDs) span the membrane six times per domain (12 times per P-gp molecule) via putative α-helices (Loo and Clarke, 1995; Kast et al., 1996); and two hydrophilic nucleotide-binding domains (NBDs) are located at the cytoplasmic face of the membrane. The protein appears to have arisen by gene duplication and consists of two homologous halves, each comprising one TMD and one NBD.
Although the mechanisms of solute translocation and energy coupling by any ABC transporter are unknown, a considerable body of data supports a catalytic cycle in which the two NBDs alternately hydrolyse ATP (Senior et al., 1995). The drug binding site(s) are located on the TMDs (Ambudkar et al., 1999). It is therefore assumed that conformational changes induced by ATP binding and/or hydrolysis are transmitted from the NBDs to the TMDs, which then mediate solute translocation. Indirect evidence for conformational changes in P-gp following nucleotide interaction has been presented (Mechetner et al., 1997; Wang et al., 1997; Sonveaux et al., 1999; Julien and Gros, 2000).
In this study we used electron microscopy of two-dimensional (2D) crystals of P-gp to study conformational changes induced when the protein is trapped at discrete steps in the ATP catalytic cycle. In the absence of bound nucleotide a projection structure at ∼10 Å resolution was obtained. Interaction of nucleotides at the NBDs induced a reorganization of the TMDs. Biochemical studies confirmed that these changes occur in the context of the native membrane, and suggest they are a consequence of α-helix rotation. Correlation of these conformational changes with changes in drug binding properties and the ATP catalytic cycle suggest a mechanism for transport by P-gp and, by inference, other ABC transporters.
Results
2D crystals of P-gp
P-gp was purified in an active form from multidrug resistant Chinese hamster ovary cells, as described previously (Callaghan et al., 1997). Large, well-ordered 2D crystals of P-gp were grown by precipitant-induced surface growth at an air–water interface on a droplet. The protein concentration was optimized to generate single-layered crystals (Auer et al., 1999). The occasional multi-layered 2D crystals were distinguished by their Fourier transform (See Supplementary figure 1, available at The EMBO Journal Online) and discounted. The crystals probably consist of protein–dodecyl-maltoside complexes in which the hydrophobic part of the protein is shielded by detergent (Cyrklaff et al., 1995). There was negligible lipid in the final crystallization droplet and thin-layer chromatography showed that there was little lipid present in the crystals. Crystals were never obtained using detergent in the absence of P-gp. Labelling with lectin showed that the crystals comprised a glycosylated protein, and solubilization of the crystals followed by SDS–PAGE and western blotting demonstrated that the crystals were full-length P-gp and not a proteolytic fragment (data not shown). Electron microscopy of negatively stained crystals showed a hexagonal crystalline array (Figure 1). The crystals were usually >2 µm2 with little mosaicity, as demonstrated by sharp peaks in the Fourier transform (Figure 2; Supplementary figure 2).
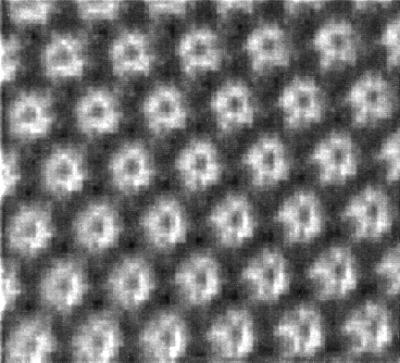
Fig. 1. Electron micrographs of 2D crystals of P-gp in negative stain. Precipitant-induced crystals of P-gp, formed at the air–water interface of hanging droplets, were visualized by staining with 4% (w/v) uranyl acetate. The figure shows several unit cells of a crystal after Fourier filtering.

Fig. 2. Electron cryo-microscopy and image processing of 2D crystals of P-gp. The phase error for each unique reflection to 8 Å resolution in ice is represented after vectorial averaging of the merged data (Unger et al., 1997) with larger boxes indicating lower (better quality) phase residuals. The numbers in the boxes indicate the phase error associated with each structure factor (1 <8°, 2 <14°, 3 <20°, 4 <30°, 5 <40°, 6 <50°, 7 <70°, 8 <90°; values from 1–4 are given in numbers printed inside the boxes; values from 5–8 are indicated by decreasing box sizes). For this calculation 90° represents a random phase error.
Projection map of P-gp to ∼10 Å resolution
Images of frozen-hydrated, 2D crystals were obtained by low-dose electron cryo-microscopy (Dubochet et al., 1988). The Fourier transform of an individual micrograph is shown (Supplementary figure 2). The best images displayed reflections to ∼8 Å resolution (Figure 2). The cell parameters (a = 70.2 ± 0.6 Å; b = 71.4 ± 0.3 Å; γ = 121 ± 0.3°; n = 12) were similar to those obtained from negative stain (see below). After merging together seven films, the data set showed 100% completeness to 15 Å resolution, 90% completeness between 15 and 10 Å, and 60% completeness to 8 Å (completeness is a measure of the ratio of actual to expected number of reflections; Glaeser and Downing, 1992). The overall shape of the molecule and the major densities remained consistent throughout merging, demonstrating a close correspondence between crystals from separate films, and that noise in any single film did not significantly influence the final projection structure. Calculation of the phase residual in resolution bins suggests the data extend to ∼10 Å resolution (Table I; Figure 2). Given that phase residuals as high as 70° still provide useful structural information (Glaeser and Downing, 1992), the low interphase residual (37°; Table I) and good sampling of the data (for the 15–10 Å resolution shell the data set is 90% complete), suggest structural features to around 10 Å resolution will be resolved.
Table I. Merging P-gp crystals with a p1 and p2 space group.
| Resolution range (Å) |
p1 | p2 | ||
|---|---|---|---|---|
| No. of unique reflections (p1) | Interimage phase residual for p1 (90° is random) | No. of unique reflections (p2) | Phase residual for p2 (45° is random) | |
| 100–8.0 | 97 | 38.0° | 83 | 40.0° |
| 20–12.0 | 44 | 32.0° | 38 | 38.5° |
| 12.0–8.5 | 39 | 42.0° | 39 | 38.1° |
| 8.5–6.9 | 9 | 47.0° | 5 | 55.0° |
During merging of the crystals, tests were made to establish if they were flipped, rotated, contrast-transfer function reversed or whether the a and b axes were mis-indexed by altering the appropriate flags in ORIGTILTD. As expected, a and b were significantly different to prevent mis-indexing by this procedure. After merging the image, the possibility with the lowest interimage phase residual was chosen. An additional check was made by combining this new image with its newly refined phase origin and checking the final projection map after averaging the phases and amplitudes using AVRGAMPHASE to see how comparable it was to the original projection map. This cycle was repeated for all the images and repeated until the phase origins were stable.
Figure 3 shows the merged P-gp projection structure in the absence of nucleotide. The overall shape of the molecule in the unit cell is a roughly elliptical ring of 91 × 60 Å with a slightly asymmetric, central low-density region. The protein has distinct pseudo-two-fold symmetry, consistent with the sequence relatedness of the two halves of the P-gp molecule. Several pairs of density peaks are clearly related by the pseudo-two-fold symmetry, while other densities do not appear to have a pseudo-symmetrically related counterpart. The overall size and shape of the molecule is similar to that of isolated molecules of P-gp obtained by single particle analysis (Rosenberg et al., 1997; see below).

Fig. 3. Projection map of P-gp determined by electron cryo-microscopy at ∼10 Å resolution. Projection map in plane group p1 (i.e. equivalent to viewing from the extracellular surface of the cell) merged from seven independent crystals. Solid lines indicate density above the mean. Twelve major densities (A–F with their pseudosymmetric densities A′–F′) are related by a pseudo-two-fold symmetry axis centred at the star. The colours correspond to pseudo-symmetrically related densities. A region of low protein density corresponds to an aqueous chamber within the membrane (see text). The areas circled in blue at opposite ends of the molecule likely include densities corresponding to the NBDs; the three-dimensional reconstruction shows they are at the cytoplasmic face of the membrane (see text and Figure 5 for details).
Crystals are formed from monomeric P-gp
The unit cell could, potentially, accommodate one or two P-gp molecules. The breakdown of two-fold pseudo-symmetry by some of the densities (Figure 3) suggests that the space group is most likely to be p1. Consistent with this, the overall interimage phase residual to 8 Å in p1 was 38° (90° is random). In contrast, the phase residual in p2 was close to random (40°; 45° is random). Thus, the data are inconsistent with a p2 plane group (Table I). The program ALLSPACE (Valpuesta et al., 1994), which compares the phases of all structure factors for different plane groups, demonstrated a high phase residual for the p2 space group, suggesting p2 is unlikely. Estimation of the protein cross-sectional area is also consistent with the protein being a P-gp monomer. The cross-sectional area in the midpoint of the membrane (Figure 5) is between 1400 and 2000 Å2. From other membrane protein structures at low resolution, a mean cross section for a transmembrane α-helix is 135 Å2 (Auer et al., 1998). Thus, a monomer of 12 transmembrane α-helices would occupy 1600 Å2. In contrast, a dimeric protein (24 transmembrane α-helices) would occupy 3200 Å2, significantly greater than could be accommodated within the structure.

Fig. 5. 3D map of P-gp. (A–E) Slices (∼10 Å thick) through P-gp in the plane of the crystal (equivalent to the plane of the membrane), from the intracellular (A) to the extracellular (E) side of the membrane. (F) A scheme of P-gp, with the TMDs in red and the NBDs in blue. The top diagram shows a cross-section of the molecule with arrows indicating the approximate positions of sections (A–E) with respect to the protein; the lower diagram shows a view in the plane of the membrane as viewed from the extracellular face. The inset of (A) shows two HisP monomers to the same scale modelled onto the map as ribbon diagrams. In (D) the numbers 1–6 indicate the six major densities, with arrows indicating ‘gaps’ between the two TMDs generating side-entrances into the chamber from the lipid phase. Scale bar = 28 Å.
Spatial relationships between the domains of P-gp
To interpret the spatial relationships between the domains of P-gp, three-dimensional (3D) maps of P-gp were calculated from negatively stained 2D crystals (see Table II for statistical analysis). Only single-layered crystals were analysed. After digitization of the images, Fourier transforms were calculated and structure factors extracted at discrete lattice points. Reflections were sharp and extended to close to the limit of resolution in negative stain (see below). Projection maps were calculated after correction for lattice distortions (lattice unbending) (Henderson et al., 1986). The reproducibility of crystallization was reflected in consistent lattice parameters of negatively stained and unstained 2D crystals (a = 70.5 ± 0.6 Å; b = 71.5 ± 0.7 Å; γ = 122 ± 0.7°; n = 5). With no symmetry imposed, the 2-D projection structure at ∼20 Å resolution shows a hexagonal ring of high protein density, ∼70 Å in diameter surrounding a region of low protein density (Figure 4A). This ring-like structure is formed by two ‘arcuate’ domains related to each other by pseudo-two-fold symmetry. The dimensions are slightly smaller than those determined by single-particle imaging (Rosenberg et al., 1997), probably due to a smaller ring of detergent surrounding the molecule in the crystal. On first inspection this shape appears somewhat different to that observed by electron cryo-microsopy (Figure 3). Nevertheless, the two structures are entirely compatible because negative stain only visualizes the surface of the molecule, and only the stain surrounding the protein is ‘seen’ rather than the protein itself (Kühlbrandt et al., 1994). In contrast, electron cryo-microscopy visualizes the entire molecule and consequently the complexity is increased by contributions from the transmembrane segments and intracellular NBDs (see below). Variability in the depth and degree of staining over two different surfaces of the crystal can also generate apparent differences. Similar differences between stained and unstained structures for the same protein have been reported previously (Breyton et al., 2000).
Table II. Image processing statistics for the 3D structure of P-gp in negative stain.
| Parameter | Value |
|---|---|
| No. of images | 45 |
| Unit cell parameters | a = 70.5 ± 0.4 Å; b = 71.2 ± 0.5 Å; γ = 120 ± 0.5° |
| Plane group | p1 |
| Range of crystal tilts | 0–60° |
| Range of underfocus | –3000 to –9000 Å |
| Total no. of measurements | 1084 |
| Total no. of fitted unique reflections | 286 |
| Overall weighted phase error | 35° |
| Effective resolution cutoffs | 19 Å (in plane), 30 Å (vertical) |

Fig. 4. Projection maps of P-gp from negatively stained 2D crystals. Projection maps at ∼20 Å resolution in the plane group p1 were derived by image processing of negatively stained 2D crystals and were obtained in the absence of nucleotide (A); the presence of AMP-PNP (B); and the presence of ADP-vanadate (C). The projection maps correspond to views of P-gp in the plane of the membrane as viewed from the extracellular surface (see text). Each map was merged from at least five separate crystals using ORIGTILT. Similar projection maps were obtained from several independent batches of protein, and from different EM grids, showing that the different crystal forms were not due to different proportions of subpopulations of P-gp in different protein preparations. The solid lines indicate density above the mean; dotted lines indicate density below the mean value.
To calculate a 3D density map from negative-stained data, the 2D crystals were tilted with respect to the electron beam. The lattice lines along z* showed a good clustering of the phases (not shown). Phases were reliable out to the lattice line (1, –4), representing better than 19 Å resolution in the crystal plane. Fourier space was well sampled in the xy direction (∼16 Å resolution), but the resolution was poorer perpendicular to the plane of the membrane (z) (∼25 Å resolution). Sections through the 3D map at increasing depth parallel to the crystal plane are shown (Figure 5). The central chamber penetrates the molecule to a depth sufficient to cross much of the membrane (Figure 5B–D). The chamber, at least in this nucleotide-free conformation, appears to be open to the extracellular aqueous milieu. The two ‘arcuate’ structures that form the chamber each consist of three densities, which presumably correspond to pairwise clustering of the six putative transmembrane α-helices of each TMD (labelled 1–3 and 4–6 in Figure 5D). There are noticeable ‘gaps’ between the two TMDs, potentially permitting side-access to the chamber from the lipid phase (arrows in Figure 5D). At the intracellular face of the membrane, two densities (Figure 5A) related by rotational pseudosymmetry correspond to the NBDs.
Modeling the X-ray structure of an NBD onto the P-gp projection map
The crystal structure of an NBD from a bacterial ABC transporter (HisP) has been determined (Hung et al., 1998). Two HisP monomers were modelled into the densities of the 3D map at the intracellular face of the membrane using QUANTA and MOLSCRIPT (Kraulis, 1991) (Figure 5A, inset). This was the only position and orientation in which two HisP monomers could realistically be modelled onto the P-gp structure, providing independent evidence that these lobes do indeed correspond to the NBDs. As four HisP monomers could not be accommodated in the unit cell these data provide further evidence that P-gp is a monomer.
Major structural rearrangements in the TMDs during the ATPase cycle
Projection maps were calculated from multiple negatively stained 2D crystals of P-gp, grown in the presence of the non-hydrolysable ATP analogue AMP-PNP, or following trapping with ADP/vanadate, which block P-gp at different steps in the ATP hydrolytic cycle (Figure 10; Senior et al., 1995). The crystals were ordered to a similar extent as the nucleotide-free crystals. The projection maps of the extracellular surface of the proteins were very different from each other, and different from P-gp in the absence of nucleotide (Figure 4). In AMP-PNP the overall shape was roughly triangular with densities of three-fold symmetry surrounding the central chamber (Figure 4B). The lattice dimensions (a = 64 ± 0.5 Å; b = 65 ± 0.4 Å; γ = 119 ± 0.5°; n = 5) were significantly different from those of nucleotide-free protein. In ADP/vanadate (Figure 4C) the lattice dimensions were different again (a = 64 ± 0.4 Å; b = 68 ± 0.2 Å; γ = 119° ± 0.5; n = 5). The differences in lattice size could not be accounted for by a change in the oligomeric state of P-gp and must therefore correspond to conformational changes in the monomer.

Fig. 10. Conformational changes during the transport cycle of P-gp. The ATPase cycle is based on Senior et al. (1995) and data presented herein. For clarity, the ATPase cycle for only one NBD is shown, although in P-gp both NBDs are required and operate in an alternating catalytic cycle. P-gp binds drug substrate from the inner leaflet of the lipid bilayer at the intracellular face of the membrane (I). Subsequently, ATP is bound by the NBD(s) (II), inducing a conformational change that results in a reduction in the affinity of drug binding and reorientation of the site such that it is exposed to the extracellular milieu (probably an aqueous chamber formed by the TMDs of P-gp). The post-ATP hydrolysis transition state (trapped with ADP and vanadate) shows a third conformation (III) that retains low drug binding. Following release of ADP and/or Pi (IV) the protein returns to its starting configuration and regains high-affinity drug binding.
The possibility that the differences in the maps were due to differential tilting of the crystals could be discounted as all crystals of the native protein would have had to be tilted at one specific angle, while all the crystals with (for example) AMP-PNP at another, different specific angle. Further evidence that the crystals were not tilted was the absence of a defocus gradient across the micrographs, and the program EMTILT, which showed that the lattice dimensions of all the crystals of any given form of P-gp were similar; tilting would render one or both of the lattice dimensions significantly smaller.
Single particle analysis
To confirm that these conformational changes were not due to nucleotide-induced changes in crystal packing, we analysed single particles of purified protein in the presence or absence of AMP-PNP (for details see Materials and methods). Similar structural differences between AMP-PNP-bound protein and nucleotide-free protein were observed (Figure 6). Thus, the isolated protein undergoes similar conformational changes to those observed in crystals.

Fig. 6. P-gp conformational changes shown by single particle analysis. Single particles were analysed with (A) or without (B) prior incubation of protein with AMP-PNP. Each projection is derived from the majority class of particle under each condition. After classification and alignment (Pilling et al., 1999), the resolution was assessed and each class limited to this resolution limit. Consequently, both maps were cut off at ∼35 Å. The scale bar corresponds to 11.4 Å.
Conformational changes in the TMDs of active P-gp in cell membranes
To demonstrate that the conformational changes observed by crystallography reflect changes in the active molecule in its native environment, we used a well-characterized monoclonal antibody (UIC2) that recognizes a conformation-sensitive, extracellular epitope in the TMDs of P-gp (Mechetner et al., 1997). It was necessary to use human P-gp for these studies as UIC2 is species specific: human and hamster P-gp are similar in structure and function. A method for studying UIC2 binding in isolated membranes (rather than whole cells, as previously) was developed to allow application of nucleotide analogues to the intracellular NBDs. The binding of UIC2 to P-gp was significantly reduced (P <0.05) following pre-incubation with AMP-PNP, or with ADP plus vanadate, but not with either ADP or vanadate alone (Figure 7). This shows directly that P-gp adopts distinct conformations when nucleotide is bound, compared with the nucleotide-depleted form. Because the UIC2 epitope is formed by the extracellular loops of the TMDs, the conformational changes induced by nucleotide interaction at the NBDs must be transduced across the entire lipid bilayer to the outer face of the membrane

Fig. 7. Conformational changes in the TMDs of P-gp shown by UIC2 binding. The binding of PE-UIC2 to NIH 3T3-MDR1 cell membranes (mean relative fluorescence units and standard deviation; n >3) is significant (P <0.05) in the presence of nucleotides. The background (non-P-gp-related) fluorescence was subtracted from all values.
Cysteine-substitution mutagenesis suggests α-helix rotation
To further analyse conformational changes during transport, we tested the relative accessibility to the lipid and aqueous phases of sulfydryl groups introduced into a transmembrane α-helix. Previously we generated a cysteine-less version of human P-gp in which the seven cysteine residues are replaced by serines and showed that this protein is functional (Blott et al., 1999; Taylor et al., 2001). TM6 was selected for study as it is predicted to form an amphipathic α-helix and has been strongly implicated in substrate binding (Ambudkar et al., 1999). Alternate residues from 329 to 343 of TM6 in cysteine-less P-gp were replaced, singly, by cysteine residues using site-directed mutagenesis. These include residues predicted to be on both hydrophilic and hydrophobic faces of the amphipathic helix. The mutant proteins were active, with a drug-stimulated ATPase activity comparable to that of cysteine-less P-gp (except for L329C and L339C, which were discounted) (data not shown).
Each mutant P-gp was analysed for accessibility of the introduced cysteine to PCMB (p-chloromercuribenzoate) or PCMBS (a sulfonic acid derivative of PCMB), which react differentially with cysteine residues in hydrophobic and hydrophilic regions of membrane proteins (Olsowski et al., 2000) (Figure 8). As expected, the drug-stimulated ATPase activities of cysteine-less P-gp and the control (G324C, which has a single cysteine in an extracellular loop; Blott et al., 1999) were not significantly affected by either reagent. Also as expected, the ATPase activity of all the TM6 mutant proteins was inhibited by PCMB, which can gain access to residues exposed to the aqueous phase and to residues embedded in the membrane. Surprisingly, however, PCMBS at similar concentrations also inhibited the ATPase activity of each mutant protein. This was unexpected as it was anticipated that around half of the cysteine residues would be in a lipid environment and hence inaccessible to this reagent (as has been shown, for example, for GLUT1; Olsowski et al., 2000). Thus, unlike other membrane proteins that have been studied, individual residues around the entire ‘circumference’ of the amphipathic α-helix can be accessed from both the aqueous and lipid phases. This result is inconsistent with a static α-helix but can be explained if significant parts of TM6 are exposed to both aqueous and lipid environments during the transport cycle.

Fig. 8. Inhibition of P-gp ATPase by PCMB and PCMBS. The % inhibition of drug-stimulated ATPase activity of each mutant P-gp is given as the mean value (± SD; n = 2–5). Membranes were pre-incubated with PCMBS (light grey) or PCMB (dark grey) for 10 min at 37°C before the addition of ATP.
Effects of nucleotides on substrate binding
P-gp pre-treated with AMP-PNP, or ADP plus vanadate, was analysed for vinblastine binding. The Bmax for binding was reduced from 67.2 ± 6.6 pmol/mg for untreated membranes to 13.4 ± 0.9 pmol/mg by AMP-PNP and by vanadate plus ADP (Figure 9B). The IC50 for the reduction in vinblastine binding by AMP-PNP was 0.27 mM, reflecting physiological concentrations of ATP (Figure 9A). Thus, nucleotide binding to P-gp reduces availability of the drug binding site. Availability was not restored in the post-hydrolytic transition state (vanadate-trapped protein), but only once ADP and/or Pi have been released.

Fig. 9. Effects of nucleotides on equilibrium binding of vinblastine to P-gp. (A) The effects of increasing concentrations (0–3 mM) of AMP-PNP on the maximal binding capacity of [3H]vinblastine to P-gp is shown. The IC50 for AMP-PNP is 0.27 mM. (B) [3H]vinblastine equilibrium binding to P-gp was measured at various concentrations of vinblastine in the presence (open circles) or absence (filled circles) of AMP-PNP.
Discussion
To address the mechanism by which transport is mediated, we determined projection structures of the multidrug resistance P-gp at various stages of the transport cycle, and correlated structural with functional changes. The projection structure of the native protein (no bound drug or nucleotide) determined to ∼10 Å resolution showed that P-gp is monomeric and that the TMDs form a chamber (60–70 Å external diameter) within the membrane that appears to be open to the aqueous environment. The pseudo-two-fold symmetry of the chamber is consistent with the relatedness of the two halves of the P-gp. ‘Gaps’ between the TMDs may allow side-access to the chamber from the lipid phase. The two NBDs are located at the cytoplasmic face of the membrane. The overall shape and size of the P-gp molecule is similar to that seen for the catalytically active protein at low resolution by single-particle analysis, and for the related MRP1 (Rosenberg et al., 1997, 2001), providing confidence that the protein in the crystal reflects the native structure.
The unit cell in the crystals is a P-gp monomer. First, assuming a partial specific volume of 0.73 cm3/g (Richards, 1997), at a stain-excluding volume of 0.5σ above the mean, the molecular mass of the P-gp structure can be calculated as 120–140 kDa; excluding glycosylation, monomeric P-gp is 140 kDa. Secondly, the phase errors were consistent with p1 and not p2 symmetry. Thirdly, the cross-sectional area of the protein at the midpoint of the membrane is consistent with 12 transmembrane α-helices, but cannot accommodate the 24 transmembrane α-helices if P-gp were a dimer. Finally, two but not four HisP (NBD) monomers could readily be modelled onto the P-gp structure. As P-gp molecules in the crystals are similar in size to single particles of active P-gp (Rosenberg et al., 1997), monomeric P-gp is likely to represent the minimum functional unit.
The chamber in the membrane is likely to be formed solely by the TMDs as the NBDs do not appear to span the membrane or contribute significantly to the pore (Blott et al., 1999). The TMDs span the membrane a total of 12 times (Loo and Clarke, 1995; Kast et al., 1996; Linton and Higgins, 2001) and are predicted to be α-helical, a prediction supported by circular dichroism (Dong et al., 1998). The dimensions of the membrane-spanning densities that form the chamber are consistent with a 12 transmembrane α-helix structure (Figures 3 and 5). The chamber is constructed from two symmetrically-organized ‘arcuate’ domains, corresponding to the two TMDs. Gaps between these domains appear to form side-entrances into the chamber from the lipid phase, which may permit access of substrate to the chamber from the inner leaflet of the bilayer, as predicted by the ‘flippase’ model (Higgins and Gottesman, 1992) and supported by a body of experimental data (Raviv et al., 1990; Holló et al., 1994; Stein et al., 1994). The chamber in the membrane is likely to be aqueous as it accumulates hydrophilic negative stain and, at least in this conformation, appears to be open to the extracellular environment. This is consistent with evidence that a drug is transferred from the inner leaflet of the membrane to an aqueous environment prior to release from the cell or partitioning into the outer leaflet of the bilayer (Bolhius et al., 1996).
The NBDs are seen as two lobes at the cytoplasmic face of the membrane. At this resolution we cannot ascertain whether or not there is a direct interaction between the NBDs as is predicted by the alternating catalytic sites model. We also cannot ascertain whether the NBDs interact directly with the transmembrane segments (predicted α-helices) of the TMDs, or via the intracellular loops of the TMDs. Similarly, in the absence of knowing the precise location of the lipid bilayer with respect to the structure, we cannot tell whether the NBDs contact the phospholipids or are associated with the membrane solely through interaction with the TMDs, or both. Although the NBDs are appropriately positioned to close the pore at the cytoplasmic face of the membrane, there is strong evidence that the NBDs of P-gp are not exposed to the extracellular aqueous phase and hence are unlikely to be directly involved in gating (Blott et al., 1999).
The overall structure of P-gp is very different from that of the P-type ion-transporting ATPases. Principally, the large chamber in the membrane formed by the TMDs of P-gp contrasts with the relatively tight packing of the transmembrane α-helices of the ion-translocating ATPases (Toyoshima et al., 2000). The reason for this difference is unclear, but may be related to the nature of the substrates transported. ABC transporters can handle a diversity of substrates, including large polypeptides, and a chamber in the membrane may provide a universal architecture that is more adaptable to different-sized substrates than closely packed α-helices. Interestingly, the protein translocator also has a central chamber of similar dimensions to that of P-gp (Hamman et al., 1997). Strong evidence that hydrophobic substrates interact with the transporter from the inner leaflet of the lipid bilayer would ‘predict’ the side-entrances into the chamber, as observed for P-gp, but unnecessary for ion-translocating ATPases.
Most importantly, projection maps for P-gp trapped at various stages in the ATPase cycle show an unexpected and extensive reorganization of the TMDs within the plane of the membrane. These rearrangements are a consequence of nucleotide binding to the intracellular NBDs, and therefore reflect signal transduction between domains. Single-particle analysis of active protein confirmed that these conformational changes were not an artefact of crystal formation, and biochemical analyses demonstrated that they occur in the context of the active protein in the native membrane. These conformational changes may reflect significant repacking of the membrane-spanning putative α-helices in the membrane. We have shown elsewhere that models in which transmembrane segments move in and out of the bilayer are unlikely (Linton and Higgins, 2001). Although the projection map and use of the conformation-sensitive antibody UIC2 only identify changes at the extracellular face of the membrane, cysteine-scanning mutagenesis showed that, at least for TM6, conformational changes during the transport cycle are likely to extend some way ‘down’ the α-helix. The simplest model is that the predicted α-helices rotate in the plane of the membrane, resulting in new helix–helix inter actions, and the consequent repacking alternately exposes individual residues (and a drug binding site?) to aqueous and lipid phases. Helix rotation also provides the best explanation of cross-linking data (Loo and Clarke, 2000) showing that successive residues in TM6, which are on opposite sides of the α-helix, can nevertheless be cross-linked to the same residue in TM12. This rotational model provides a potential explanation for how a substrate binding site on P-gp can be alternately exposed to the lipid phase (to bind a drug) and then the aqueous phase (the central chamber) before the drug is released to the extra cellular milieu or partitions into the outer leaflet of the bilayer. Biochemical evidence for the rotation of transmembrane α-helices during the action of ion channels has recently been presented (Cha et al., 1999; Minor et al., 2000).
Correlation of biochemical data with the distinct conformations observed for P-gp suggest a coherent model for drug transport (Figure 10). We have shown here and elsewhere (Martin et al., 2000b) that ATP binding to P-gp significantly reduces the availability of the vinblastine drug binding site. This implies that in the ATP-bound form of P-gp the drug binding site is relatively unavailable and, hence, that drug binding must precede ATP binding. Consistent with this we have shown that the affinity of P-gp for ATP is increased following vinblastine binding (our unpublished data). The transport cycle is therefore initiated by drug binding to a high-affinity site on the TMDs from the inner leaflet of the bilayer (Figure 10, step I). ATP is then bound by the NBD, which induces a major conformational change, reducing the affinity for drug binding (Figure 10, step II). Although it has not been demonstrated for P-gp, we have shown for the closely related bacterial drug transporter LmrA that ATP binding reorientates the drug binding site to expose to the extracellular face of the membrane (van Veen et al., 1998); it is likely, therefore, that the conformational change induced in P-gp following ATP binding also reorientates the drug binding site to expose it to the extracellular environment. Thus, ATP binding, rather than hydrolysis, appears to provide the energy for drug translocation (although we cannot tell whether or not it is actually released at this step). Following ATP hydrolysis, but prior to release of ADP/Pi, there is a further conformational change (Figure 10, step III), although the drug binding site remains in its low-affinity state. Only on release of ADP and/or Pi (Figure 10, step IV) does the protein return to its original configuration with high-affinity binding restored, ‘resetting’ the protein for another transport cycle (Sauna and Ambudkar, 2000). As ABC transporters are closely related, these data may provide a framework for more detailed understanding of the mechanisms of action of other ABC transporters.
Materials and methods
P-gp purification and 2D crystallization
P-gp was purified from multidrug resistant CHrB30 Chinese hamster ovary cells solubilized in 1% (w/v) dodecyl-maltoside and 0.4% asolectin (Callaghan et al., 1997). The drug-stimulated ATPase activities and high-affinity binding of [3H]vinblastine were essentially the same for the purified protein as for P-gp in native membranes.
P-gp possesses large extramembranous hydrophilic domains and thus crystallization procedures were adapted from those developed for H+-ATPase (Cyrklaff et al., 1995; Auer et al., 1998). Purified P-gp (50–100 µg/ml) was added to crystallization buffer [11.5 % (w/v) PEG 6000, 110 mM ammonium sulfate, 50 mM Tris buffer pH 8.0, 0.1 mg/ml dodecylmaltoside] and centrifuged at 10 000 g for 30 s. A 2–5 µl aliquot of supernatant was incubated on a silanized glass slide against a reservoir of 1.0 M MgCl2 sealed with immersion oil at 4°C. After ∼16 h, 2D crystals were transferred to a glow-discharged copper grid (400 mesh) coated with a continuous carbon film. In some cases, the 2D crystals were also grown using holey-carbon grids (Agar Scientific). Crystals were either immediately negatively stained with 4% (w/v) uranyl acetate and viewed under the electron microscope, or preserved unstained by plunging into liquid ethane near the temperature of liquid nitrogen (Dubochet et al., 1988). Multilayers were prevented from forming by adjusting the protein concentration (Auer et al., 1999) and only single-layered crystals (one unit cell thick) processed. 2D crystals in the presence of nucleotides were grown as above except that either AMP-PNP (5 mM) plus MgCl2 (1 mM), or sodium orthovanadate (pH 10, 300 nM) plus ADP (1 mM) and MgCl2 (1 mM), were added to the crystallization droplet.
Electron cryo-microscopy and image processing
The specimens were transferred to a Gatan 626 or Oxford CT3500 cold stage at –170°C and examined on a Philips CM120, CM100 or CM200 cryo-microscope operating at 120, 100 or 200 kV, respectively. Micrographs were recorded with an electron dose of <10 e–/Å2 on Agfa Scientia EM film or SO-163 electron emulsion film. The quality of the images was evaluated on the basis of optical diffraction. Only those images that showed sharp reflections to better than 15 Å were processed. All spots were included with IQ <7. Micrographs were scanned on a Zeiss SCAI microdensitometer with a scan step corresponding to 3.6 Å at the level of the specimen. Processing and merging used software from the MRC LMB (Cambridge, UK). After lattice unbending and contrast transfer function (CTF) correction, ALLSPACE (Valpuesta et al., 1994) was used to calculate the phase origin of the best image to be used for image alignment. This image was used as a reference to determine the phase origin of the other images, and seven images were then merged using ORIGTILTD in either p1 or p2. The phase origins were refined against the entire data set to define the overall best position of the images. The defocus values for each image were adjusted to obtain the best possible agreements between the data sets. Structure factors of the reflections were added vectorially using the program AVGAMPHS. Compensation was also made for the resolution-dependent fading of the image amplitudes using the program SCALIMAMP3D, which applies an appropriate scale factor (–500 Å–2) by comparing the experimentally recorded amplitudes with those of bacteriorhodopsin (which has similar dimensions to P-gp and is largely α-helical; Schertler et al., 1993; Valpeuesta et al., 1994; Havelka et al., 1995). The final projection map was generated with the CCP4 Program Suite (1994). For processing the negatively stained 2D crystals in projection, similar procedures were adopted, except that no resolution-dependent scaling of the image amplitudes was applied. FOMSTATS and PLOTALL (Vinzenz Unger and Werner Kühlbrandt) were used to calculate the phase errors in a specified number of resolution bands. PLOTALL enabled evaluation of the phase error for each unique reflection to be presented in a graphical output.
3D structure
Forty-five images were recorded with measured tilt angles between –60° and +55° under low-dose conditions on a CM100 electron microscope. Defocus positions were assigned 3 µm and 180° from the object of interest, and the mean defocus value was used to record the final image. Images were scanned on a Zeiss SCAI densitometer at 7.1 Å/pixel at the specimen level, and distortions in the lattice corrected by lattice unbending as described above. Images were only CTF corrected when the high-resolution reflections fell outside the first CTF minimum. The program EMTILT was used to calculate the tilt-angle and the angle from the tilt axis to the a* direction in reciprocal space. The absolute handedness of the structure was determined as described (Amos et al., 1982). Images were merged with the lowest tilt angle images first using the program ORIGTILTD. The program LLFILT was used to construct a list of structure factors in three dimensions (hkl) and the 3D map was plotted using the CCP4 Fourier program.
Single-particle analysis
Single-particle imaging of P-gp incubated at 4°C overnight in the absence or presence of AMP-PNP (5 mM), MgCl2 (1 mM) and 50 mM Tris-Cl pH 7.4 was as described previously (Rosenberg et al., 1997). The particles were classified by correspondence analysis followed by hierarchical ascendant classification, and each class aligned separately in order to take account of potential different orientations of the protein on the electron microscope grid (see Rosenberg et al., 1997, 2001). Data were analysed using SPIDER (Frank et al., 1981).
UIC2 binding to P-gp
NIH 3T3 cells and their P-gp-expressing derivative NIH 3T3-MDR1 were grown in Dulbecco’s modified Eagle’s medium with 10% FCS (Helena Bioscience) and, for P-gp-expressing cells, 1 µg/ml colchicine. A 5 µg aliquot of membrane protein in 100 µl binding buffer C (50 mM Tris–HCl pH 7.4, 5 mM MgCl2, 150 mM NH4Cl4, 0.02% NaN3) was incubated with or without nucleotide, as appropriate, at 37°C for 10 min. Nucleotides were dissolved in buffer C at 100 mM and used fresh at a final concentration of 5 mM. Vanadate was used at 5 mM final concentration. PE (phycoerythrin)-labelled UIC2 (10 µl, saturating for binding in the absence of nucleotide; Immunotech) was added and incubated at 37°C for 10 min. The mix was diluted 10-fold with ice-cold buffer C and centrifuged at 100 000 g for 30 min to pellet the membrane together with any bound PE-UIC2. The pellet was washed in ice-cold PBS (phosphate buffered saline pH 7.0) and resuspended in 1% SDS in PBS. The amount of UIC2 bound was measured in a Hitachi f-2000 fluorescence spectrophotometer (excitation 488 nm, emission 576 nm). All assays were performed at least three times. Statistical analysis used the Student’s t-test.
Expression of mutant P-gps in insect cell membranes
Expression and characterization of a cysteine-less, histidine-tagged P-gp has been described (Blott et al., 1999; Taylor et al., 2001). Introduction of single cysteine residues into the P-gp coding sequence by oligonucleotide-directed mutagenesis and expression of the mutant proteins in insect cell membranes is described in Supplementary data.
ATPase assay and inhibition by PCMB/PCMBS
ATPase assays were performed by a colorimetric method (Chifflet et al., 1988). Membranes were incubated at 37°C for 30 min in the presence or absence of verapamil (100 µM) and vanadate. The P-gp-related ATPase activity in HighFive membranes was calculated by subtracting the vanadate-sensitive activity in the absence of verapamil from the vanadate-sensitive activity in the presence of verapamil (Martin et al., 1997). For PCMB/PCMBS inhibition assays, the membranes were pre-incubated with the reagent (1×10⁻⁷ to 1×10⁻³ M) at 37°C for 10 min in the presence of all ingredients except ATP; the ATPase assay was initiated by adding ATP.
Equilibrium binding of [3H]vinblastine to P-gp
Membranes from CHrB30 cells expressing P-gp, and drug-sensitive parental AuxB1 cells, were prepared, and equilibrium binding of [3H]vinblastine as described previously (Martin et al., 2000a). The data are described by non-linear regression of the single-site Langmuir binding isotherm. Where appropriate, membranes were pre-incubated in the absence or presence of 3 mM AMP-PNP or 2 mM ADP/300µM vanadate.
Supplementary data
Further details of Materials and methods are provided as Supplementary data available at The EMBO Journal Online.
Acknowledgments
Acknowledgements
We are grateful to Werner Kühlbrandt and Vinzenz Unger for advice and critically reading the manuscript; to M.Auer, N.Grigorieff, A.Hicks, S.Hubbard, J.Hutton, P.McPhie, J.Mallet, D.Mills, M.Walker, T.Walz, K.Williams, J.Warricker and S.Oliver for technical assistance with computing and cystallography; to I.Roninson for advice on use of UIC2. I.D.K. is a Wellcome Trust Career Development Fellow. This work was supported by the Cancer Research Campaign and by the Medical Research Council.
References
- Ambudkar S.V., Dey,S., Hrycyna,C.A., Ramachandra,M., Pastan,I. and Gottesman,M.M. (1999) Biochemical, cellular, and pharmacological aspects of the multidrug transporter. Annu. Rev. Pharmacol. Toxicol., 39, 361–398. [DOI] [PubMed] [Google Scholar]
- Amos L.A., Henderson,R. and Unwin,P.N.T. (1982) 3-Dimensional structure determination by electron-microscopy of two-dimensional crystals. Prog. Biophys. Mol. Biol., 39, 183–231. [DOI] [PubMed] [Google Scholar]
- Auer M., Scarborough,G.A. and Kühlbrandt,W. (1998) Three-dimensional map of the plasma membrane H+-ATPase in the open conformation. Nature, 392, 840–843. [DOI] [PubMed] [Google Scholar]
- Auer M., Scarborough,G.A. and Kühlbrandt,W. (1999) Surface crystallisation of the plasma membrane H+-ATPase on a carbon support film for electron crystallography. J. Mol. Biol., 287, 961–968. [DOI] [PubMed] [Google Scholar]
- Blott E.J., Higgins,C.F. and Linton,K.J. (1999) Organization of the nucleotide-binding domains of the multidrug resistance transporter P-glycoprotein. EMBO J., 18, 6800–6808. [DOI] [PMC free article] [PubMed] [Google Scholar]
- Bolhius H., van Veen,H.W., Molenaar,D., Puolman,B., Driessen,A.J.M. and Konings,W.N. (1996) Multidrug resistance in Lactococcus lactis: evidence for ATP-dependent drug extrusion from the inner leaflet of the cytoplasmic membrane. EMBO J., 15, 4239–4245. [PMC free article] [PubMed] [Google Scholar]
- Breyton C. (2000) The cytochrome b(6)f complex: structural studies and comparison with the bc(1) complex. Biochim. Biophys. Acta, 1459, 467–474. [DOI] [PubMed] [Google Scholar]
- Callaghan R., Berridge,G., Ferry,D.R. and Higgins,C.F. (1997) The functional purification of P-glycoprotein is dependent on maintenance of a lipid–protein interface. Biochim. Biophys. Acta, 1328, 109–124. [DOI] [PubMed] [Google Scholar]
- Cha A., Snyder,G.E., Selvin,P.R. and Bezanilla,F. (1999) Atomic scale movement of the voltage-sensing region in a potassium channel measured via spectroscopy. Nature, 402, 809–813. [DOI] [PubMed] [Google Scholar]
- Chifflet S., Chiesa,U.T.R. and Tolosa,S. (1988) A method for the determination of inorganic phosphate in the presence of labile organic phosphate and high concentrations of protein: application to lens ATPases. Anal. Biochem., 168, 1–4. [DOI] [PubMed] [Google Scholar]
- Collaborative Computational Project (1994) The CCP4 suite: programs for protein crystallography. Acta Crystallogr. D, 50, 760–763. [DOI] [PubMed] [Google Scholar]
- Cyrklaff M., Auer,M., Kühlbrandt,W. and Scarborough,G.A. (1995) 2-D structure of the Neurospora crassa plasma membrane ATPase as determined by electron cryomicroscopy. EMBO J., 14, 1854–1857. [DOI] [PMC free article] [PubMed] [Google Scholar]
- Dong M., Ladaviere,L., Penin,F., Deleage,G and Baggetto,L.G. (1998) Secondary structure of P-glycoprotein investigated by circular dichroism and amino acid sequence analysis. Biochim. Biophys. Acta, 1371, 317–334. [DOI] [PubMed] [Google Scholar]
- Dubochet J., Adrian,M., Chang,J.J., Homo,J.C., Lepault,J., McDowall,A.W. and Schultz,P. (1988) Cryo-electron microscopy of vitrified specimens. Q. Rev. Biophys., 21, 129–228. [DOI] [PubMed] [Google Scholar]
- Frank J.B., Shimkin,B. and Dowse,H. (1981) Spider—a modular software system for electron image processing. Ultramicroscopy, 6, 343–357. [Google Scholar]
- Glaeser R.M. and Downing,K.H. (1992) Assessment of resolution in biological electron crystallography. Ultramicroscopy, 47, 256–265. [DOI] [PubMed] [Google Scholar]
- Glauner K.S., Mannuzzu,L.M., Ganghi,C.S. and Isacoff,E.Y. (1999) Spectroscopic mapping of voltage sensor movement in the shaker potassium channel. Nature, 402, 813–817. [DOI] [PubMed] [Google Scholar]
- Hamman B.D., Chen,J.-C., Johnson,E.E. and Johnson,A.E. (1997) The aqueous pore through the translocon has a diameter of 40–60Å during cotranslational protein translocation at the ER membrane. Cell, 89, 535–544. [DOI] [PubMed] [Google Scholar]
- Havelka W.A., Henderson,R. and Oesterhelt,D. (1995) 3-Dimensional structure of halorhodopsin at 7-Å resolution. J. Mol. Biol., 247, 726–738. [DOI] [PubMed] [Google Scholar]
- Henderson R., Baldwin,J.M., Downing,K.H., Lepault,J. and Zemlin,F. (1986) Structure of purple membrane from Halobacterium halobium—recording, measurement and evaluation of electron-micrographs at 3.5 Å resolution. Ultramicroscopy, 19, 147–178. [Google Scholar]
- Higgins C.F. (1992) ABC transporters: from microorganisms to man. Annu. Rev. Cell Biol., 8, 67–113. [DOI] [PubMed] [Google Scholar]
- Higgins C.F. and Gottesman,M.M. (1992) Is the multidrug transporter a flippase? Trends Biochem. Sci., 17, 18–21. [DOI] [PubMed] [Google Scholar]
- Higgins C.F. et al. (1986) A family of related ATP-binding subunits coupled to many distinct biological processes in bacteria. Nature, 323, 448–450. [DOI] [PubMed] [Google Scholar]
- Holló Z., Homolya,L., Davis,C.W. and Sarkadi,B. (1994) Calcein accumulation as a fluorometric functional assay of the multidrug transporter. Biochim. Biophys. Acta, 1191, 384–388. [DOI] [PubMed] [Google Scholar]
- Hung L.W., Wang,I.X., Nikaido,K., Liu,P.Q., Ames,G.F.-L. and Kim,S.H. (1998) Crystal structure of the ATP-binding subunit of an ABC transporter. Nature, 396, 703–707. [DOI] [PubMed] [Google Scholar]
- Julien M. and Gros,P. (2000) Nucleotide-induced conformational changes in P-glycoprotein and in nucleotide binding site mutants monitored by trypsin sensitivity. Biochemistry, 39, 4559–4568. [DOI] [PubMed] [Google Scholar]
- Kast C., Canfield,V., Levenson,R. and Gros,P. (1996) Transmembrane organization of mouse P-glycoprotein determined by epitope insertion and immunofluorescence. J. Biol. Chem., 271, 9240–9248. [DOI] [PubMed] [Google Scholar]
- Kraulis P.J. (1991) MOLSCRIPT: a program to produce both detailed and schematic plots of protein structures. J. Appl. Crystallogr., 24, 946–950. [Google Scholar]
- Kühlbrandt W., Wang,D.N. and Fujiyoshi,V. (1994) Atomic model of plant light-harvesting complex by electron crystallography. Nature, 367, 614–621. [DOI] [PubMed] [Google Scholar]
- Linton K. and Higgins,C.F. (2001) Models proposing alternative topologies of P-glycoprotein are unlikely because the protein misfolds: heterologous systems. Mol. Membr. Biol., submitted. [Google Scholar]
- Loo T.W. and Clarke,D.M. (1995) Membrane topology of a cysteine-less mutant of human P-glycoprotein. J. Biol. Chem., 270, 843–848. [DOI] [PubMed] [Google Scholar]
- Loo T.W. and Clarke,D.M. (2000) The packing of the transmembrane segments of human multidrug resistance P-glycoprotein is revealed by disulfide cross-linking analysis. J. Biol. Chem., 275, 5253–5256. [DOI] [PubMed] [Google Scholar]
- Martin C. Berridge,G., Higgins,C.F. and Callaghan,R. (1997) The multidrug reversal agent SR33557 and modulation of vinca alkaloid binding to P-glycoprotein by an allosteric interaction. Br. J. Pharmacol., 122, 765–771. [DOI] [PMC free article] [PubMed] [Google Scholar]
- Martin C. Berridge,G., Higgins,C.F., Mistry,P., Charlton,P. and Callaghan,R. (2000a) Communication between multiple drug binding sites of P-glycoprotein. Mol. Pharmacol., 58, 624–632. [DOI] [PubMed] [Google Scholar]
- Martin C., Berridge,G., Mistry,P., Charlton,P., Higgins,C.F. and Callaghan,R. (2000b) Drug binding sites on P-glycoprotein are altered by ATP binding prior to nucleotide hydrolysis. Biochemistry, 39, 11901–11906. [DOI] [PubMed] [Google Scholar]
- Mechetner E.B., Schott,B., Morse,B.S., Stein,W.D., Druley,T., Davis,K.A., Tsuruo,T. and Roninson,I.B. (1997) P-glycoprotein function involves conformational transitions detectable by differential immunoreactivity. Proc. Natl Acad. Sci. USA, 94, 12908–12913. [DOI] [PMC free article] [PubMed] [Google Scholar]
- Minor D.L., Lin,Y.-F., Mobley,B.C., Avelar,A., Jan,Y.N., Jan,L.Y. and Berger,J.M. (2000) The polar T1 interface is linked to conformational changes that open the voltage-gated potassium channel. Cell, 102, 657–670. [DOI] [PubMed] [Google Scholar]
- Olsowski A., Monden,I., Krause,G. and Keller,K. (2000) Cysteine scanning mutagenesis of helices 2 and 7 in GLUT1 identifies an exofacial cleft in both transmembrane segments. Biochemistry, 39, 2469–2474. [DOI] [PubMed] [Google Scholar]
- Pilling A., Rosenberg,M.F., Willis,S.H., Jager,J., Cohen,G.H., Eisenberg,R.J., Meredith,D.M. and Holzenberg,A. (1999) Three-dimensional structure of herpes simpex virus type 1 glycoprotein at 2.4nm resolution. J. Virol., 73, 7830–7834. [DOI] [PMC free article] [PubMed] [Google Scholar]
- Raviv Y., Pollard,H.B., Bruggemann,E.P., Pastan,I. and Gottesman,M.M. (1990) Photosensitized labeling of a functional multidrug transporter in living drug resistant tumor cells. J. Biol. Chem., 265, 3975–3980. [PubMed] [Google Scholar]
- Richards F.M. (1997) Areas, volumes, packing and protein structure. Annu. Rev. Biophys. Bioeng., 6, 151–176. [DOI] [PubMed] [Google Scholar]
- Rosenberg M.F., Callaghan,R., Ford,R.C. and Higgins,C.F. (1997) Structure of the multidrug resistance P-glycoprotein to 2.5 nm resolution determined by electron microscopy and image analysis. J. Biol. Chem., 272, 10685–10694. [DOI] [PubMed] [Google Scholar]
- Rosenberg M.F., Mao,Q., Holzenberg,A., Ford,R.C., Deeley,R.G. and Cole,S.P.C. (2001) The structure of the multidrug resistance protein 1 (MRP1/ABCC1): crystallisation and single-particle analysis. J. Biol. Chem., 276, 16076–16082. [DOI] [PubMed] [Google Scholar]
- Sauna Z.E. and Ambudkar,S.V. (2000) Evidence for a requirement for ATP hydrolysis at two distinct steps during a single turnover of the catalyic cycle of human P-glycoprotein. Proc. Natl Acad. Sci. USA, 97, 2515–2520. [DOI] [PMC free article] [PubMed] [Google Scholar]
- Senior A.E., Al-Shawi,M.K. and Urbatsch,I.L. (1995) FEBS Lett., 377, 285–289. [DOI] [PubMed] [Google Scholar]
- Sonveaux N., Vigano,C., Shapiro,A.B., Ling,V. and Ruysschaert,J.-M. (1999) Ligand-mediated tertiary structure changes of reconstituted P-glycoprotein. J. Biol. Chem., 274, 17649–17654. [DOI] [PubMed] [Google Scholar]
- Stein W.D., Cardarelli,C., Pastan,I. and Gottesman,M.M. (1994) Kinetic evidence suggesting that the multidrug transporter differentially handles influx and efflux of its substrates. Mol. Pharmacol., 45, 763–772. [PubMed] [Google Scholar]
- Taylor A.M., Storm,J., Soceneantu,L., Linton,K.J., Gabriel,M., Martin,C., Woodhouse,J., Higgins,C.F. and Callaghan,R. (2001) Subtle pharmacological differences in function are conferred by the mutation of cysteine residues in P-glycoprotein. Br. J. Pharmacol., in press. [DOI] [PMC free article] [PubMed] [Google Scholar]
- Toyoshima C., Nakasako,M., Nomoura,H. and Ogawa,H. (2000) Crystal structure of the calcium pump of sarcoplasmic reticulum at 2.6Å resolution. Nature, 405, 647–655. [DOI] [PubMed] [Google Scholar]
- Unger V.M., Kumar,N.M., Gilula,N.B. and Yeager,M. (1997) Projection structure of a gap junction membrane channel at 7 Å resolution. Nature Struct. Biol., 1, 39–43. [DOI] [PubMed] [Google Scholar]
- Valpuesta J.M., Carrascosa,J.L. and Henderson,R. (1994) Analysis of electron-microscope images and electron-diffraction patterns of thin-crystals of 029-connectors in ice. J. Mol. Biol., 240, 281–287. [DOI] [PubMed] [Google Scholar]
- van Veen H.W., Callaghan,R., Soceneantu,L., Sardini,A., Konings,W.N. and Higgins,C.F. (1998) A bacterial antibiotic resistance gene that complements the human multidrug resistance P-glycoprotein gene. Nature, 391, 291–295. [DOI] [PubMed] [Google Scholar]
- Wang G., Pincheira,R., Zhang,M. and Zhang,J.-T. (1997) Conformational changes of P-glycoprotein by nucleotide binding. Biochem. J., 328, 897–904. [DOI] [PMC free article] [PubMed] [Google Scholar]