

Abstract
The activity of dopaminergic (DA) substantia nigra (SN) neurons is essential for voluntary movement control. An intrinsic pacemaker in DA SN neurons generates their tonic spontaneous activity, which triggers dopamine release. We show here, by combining multiplex and quantitative real-time single-cell RT– PCR with slice patch–clamp electrophysiology, that an A-type potassium channel mediated by Kv4.3 and KChip3 subunits has a key role in pacemaker control. The number of active A-type potassium channels is not only tightly associated with the pacemaker frequency of individual DA SN neurons, but is also highly correlated with their number of Kv4.3L (long splice variant) and KChip3.1 (long splice variant) mRNA molecules. Consequently, the variation of Kv4α and Kv4β subunit transcript numbers is sufficient to explain the full spectrum of spontaneous pacemaker frequencies in identified DA SN neurons. This linear coupling between Kv4α as well as Kv4β mRNA abundance, A-type channel density and pacemaker frequency suggests a surprisingly simple molecular mechanism for how DA SN neurons tune their variable firing rates by transcriptional control of ion channel genes.
Keywords: Kv4/KChip/pacemaker activity/dopaminergic neurons/quantitative real-time TaqMan PCR
Introduction
Dopaminergic (DA) midbrain neurons are essential for important brain functions such as voluntary movement, working memory and reward (Kitai et al., 1999; Spanagel and Weiss, 1999; Goldman-Rakic et al., 2000). They are also closely involved in the aetiology of neuropsychiatric disorders including schizophrenia, drug abuse and Parkinson’s disease (Spanagel and Weiss, 1999; Abi-Dargham et al., 2000; Obeso et al., 2000). Thus, it is of great interest to define the molecular mechanisms that control electrical activity of DA midbrain neurons and consequently dopamine release. Best studied are the DA neurons in the substantia nigra (SN, A9) that release dopamine in their striatal target areas (Onn et al., 2000; Smith and Kieval, 2000). In vivo, these classical striatonigral DA neurons discharge in a pacemaker or irregular single spike mode and less frequently show burst activity (Grace and Bunney, 1984a,b; Kitai et al., 1999). In brain slice preparations, the regular pacemaker mode is retained even during inhibition of synaptic transmission (Grace and Onn, 1989; Lacey et al., 1989), indicating that the pacemaker activity of DA SN neurons is autonomously generated. Spontaneous electrical activity is believed to originate from intrinsic calcium-dependent oscillations of the membrane potential (Grace, 1991). The tuning of this basic oscillator is mediated by ion channels that operate in the subthreshold range and thus determine the frequency of this cellular pacemaker. Little is known about the molecular identity of the ion channels that control this neuronal pacemaker. Ever since the classic work of Connor and Stevens (1971a,b) in invertebrate neurons a general role for A-type potassium channels in frequency control has been assumed (Rudy, 1988; Grace, 1991; Coetzee et al., 1999). In the mammalian CNS, there is good evidence that members of the Kv4 (KCND1-3) gene family (Isbrandt et al., 2000) form the α subunits of these A-type potassium channels (Serodio et al., 1996; Serodio and Rudy, 1998). The recently cloned KChip (KCNIP1-4) gene family provide Kv4β subunits (An et al., 2000). In this study, we characterized the biophysical properties of A-type potassium channels in classical DA SN neurons, defined their key role in pacemaker control, and determined molecular identity and transcript numbers using single-cell RT–PCR techniques.
Results
Biophysical and pharmacological properties of A-type potassium channels in DA SN neurons
In accordance with our previous study, classical DA SN neurons in mouse midbrain slices displayed prominent subthreshold A-type potassium currents, in contrast to GABAergic SN neurons (Liss et al., 1999). In voltage clamp recordings, A-type potassium currents were the dominant outward currents in DA SN neurons when the membrane was stepped to potentials greater than –50 mV (Figure 1A). These currents inactivated with a dominant time constant of ∼30 ms. In standard whole-cell recordings, the fast time constant of inactivation (tau-i1) was normally distributed with a mean of 33.2 ± 8.1 ms (Figure 1B; mean ± SD, n = 100), consistent with the presence of a single species of A-type channel. To ensure that we recorded genuine gating properties, we compared their properties with those in cell-free nucleated outside-out patches (Paoletti and Ascher, 1994) (Figure 1C and D). The gating kinetics were similar in outside-out recordings compared with standard whole-cell, and the inactivation time constants were normally distributed with a mean of 25.4 ± 8.7 ms (mean ± SD, n = 22). The voltage dependence of A-type channel activation in cell-free patches is shown in Figure 1E. In contrast, A-type inactivation kinetics were largely voltage independent (Figure 1F). A two-pulse protocol with variable interpulse intervals was used to study their recovery from inactivation in nucleated outside-out patches (Figure 1G): native A-type channels recovered with a mean time constant of 172 ± 17 ms (Figure 1H; n = 6), which was significantly slower than the recovery in standard whole-cell (Table I). Steady-state parameters derived from whole cell and outside-out recordings are summarized in Table I. A-type currents in DA SN neurons were insensitive to 20 mM tetraethylammonium chloride (TEA; n = 6, data not shown) and 200 nM α-dendrotoxin (DTX; n = 5, data not shown), but were inhibited by 4-aminopyridine (4-AP) with a mean IC50 of 488 ± 133 µM (Figure 2A and B; n = 5, fit of means = 472 µM, Hill = 1.0). In the presence of 4-AP, inactivation kinetics were slowed (Figure 2A), consistent with preferential closed-state 4-AP binding as described for recombinant Kv4 channels (Tseng et al., 1996) and somato-dendritic A-type channels in other neurons (Song et al., 1998). The A-type current was selectively inhibited by nM concentrations of the Kv4-specific channel blocker heteropodatoxin3 (HpTx3) (Sanguinetti et al., 1997), with an IC50 of 81.0 ± 4.0 nM (Figure 2C and D, n = 4–6).

Fig. 1. Biophysical properties of native A-type potassium channels in DA SN neurons. (A) Whole-cell recording of a DA SN neuron. Membrane potential was stepped from a holding potential of –80 mV to depolarized potentials (–60 to –30 mV) in steps of 10 mV to elicit fast-inactivating potassium outward currents. (B) Frequency distribution of the dominant fast time constant of inactivation of A-type potassium currents recorded in 100 DA SN neurons at –40 mV (tau-i1) in the standard whole-cell configuration. (C) Nucleated outside-out recording of a DA SN neuron. Membrane potential was stepped from a holding potential of –80 mV to 0 mV in 10 mV intervals to elicit fast-inactivating potassium outward currents. As is evident from the fit residuals (insert) in outside-out recordings, inactivation kinetics were well described with a single exponential decay. (D) Frequency distribution of the fast time constant of inactivation of A-type potassium currents recorded in 22 DA SN neurons at –40 mV (tau-i1) in the nucleated outside-out configuration. (E) Mean activation kinetics of A-type potassium currents (insert) in nucleated outside-out recordings expressed as time-to-peak, show clear voltage dependence in contrast to their mean inactivation kinetics shown in (F) (n = 10). (G) Double-pulse experiments (–40 mV) with varying interpulse intervals at –80 mV revealed the kinetics of the recovery from inactivation of A-type potassium channels in DA SN neurons. Current responses to the second pulse after varying interpulse intervals between 25 and 400 ms recorded in nucleated outside-out patches are shown. (H) The mean recovery from inactivation in nucleated outside-out patches with an interpulse holding potential of –80 mV was well described by a single exponential function with a time constant of 172 ms (n = 6). The mean time constant of recovery calculated from fits of recovery in individual patches was 170 ± 17 ms (n = 6).
Table I. Properties of native A-type potassium channels in DA SN neurons.
| Standard whole-cell | Nucleated outside-out | |
|---|---|---|
| Fast inactivation time constant (tau-i1 at –40 mV) Not genotyped | 33.2 ± 8.1 ms (n = 100) | 25.4 ± 8.7 ms (n = 22) |
| scPCR: TH+, Kv4.3L+ | 27.0 ± 9.5 ms (n = 32) | |
| scPCR: TH+, KChip3.1+ | 28.3 ± 12.0 ms (n = 12) | |
| TaqMan-PCR: Kv4.3L+ | 32.5 ± 5.5 ms (n = 21) | |
| TaqMan-PCR: KChip3.1+ | 27.8 ± 2.4 ms (n = 13) | |
| |
||
| Steady-state activation | V50 = –27.1 ± 1.4 mV | V50 = –28.6 ± 2.2 mV |
| slope = 6.5 ± 1.2 mV (n = 16) | slope = 10.2 ± 1.0 mV (n = 6) | |
| Steady-state inactivation | V50 = –64.1 ± 1.2 mV | V50 = –77.1 ± 1.4 mV |
| slope = 7.6 ± 1.2 mV (n = 16) | slope = 6.6 ± 1.1 mV (n = 6) | |
| Recovery from inactivation (tau-r at –80 mV) | 29.5 ± 4.3 ms (n = 7) | 172 ± 17 ms (n = 6) |

Fig. 2. Pharmacological profile of A-type potassium channels in DA SN neurons. (A) Whole-cell recording of a DA SN neuron. The membrane potential was stepped to –40 mV and current responses were recorded in increasing 4-aminopyridine (4-AP). (B) Mean dose-response for 4-AP inhibition: IC50 = 472 µM, Hill coefficient of 1 (n = 6). Mean IC50 calculated from Hill fits of individual neurons: 488 ± 131 µM (white circle, n = 6). (C) Same pulse protocol as in (A) under control and in the presence of HpTx3. (D) Mean dose-response for HpTx3 inhibition: IC50 of 81.0 ± 4.0 nM (mean ± SD of fit), Hill coefficient of 1.1 (n = 6).
A-type potassium channel density controls pacemaker frequency in DA SN neurons
Classical DA SN neurons displayed a normally distributed spectrum of spontaneous firing frequencies between 0.4 and 4 Hz with a mean of 1.3 ± 1.1 Hz (Figure 3A; n = 146). The A-type current amplitudes in DA SN neurons also varied between 0.3 and 15 nA at –40 mV (data not shown). To investigate whether A-type potassium channels are candidates for tuning discharge frequencies of individual DA SN neurons, we recorded whole-cell A-current amplitudes at –40 mV and calculated the respective A-type charge transfer densities to account for the small variations in cell size and inactivation kinetics. The normal frequency distribution of A-type channel charge densities had a mean of 2.7 ± 3.0 pC/pF (Figure 3B; n = 120). To assess a direct correlation between pacemaker frequency and A-type channel charge density, we recorded spontaneous activity as well as A-type potassium currents in the same DA SN neurons. A strong linear correlation between these two parameters (r = 0.94, slope = –2.01, n = 16) was detected over the full physiological range (Figure 3C, compare 3A and B). To demonstrate a direct role of A-type channels for frequency control, we applied different concentrations of the Kv4-specific blocker HpTx3 (2–100 nM) in the current clamp configuration. Specific A-type channel inhibition by HpTx3 reversibly accelerated the discharge frequencies in a dose-dependent manner (Figure 4A, upper panel). To determine the degree of A-type channel inhibition in the same cells, we subsequently pulled outside-out patches and applied the same HpTx3 concentration to measure the degree of A-type channel inhibition (Figure 4A, lower panel). These combined whole-cell/outside-out experiments revealed a strong linear correlation between the degrees of HpTx3-induced spike frequency increases and of HpTx3-induced A-type channel inhibition (Figure 4B; r = 0.96, slope = 1.78, n = 4–6). As estimated from the correlation shown in Figure 4B, complete inhibition of A-type channels accelerates firing frequencies 2.7-fold in DA SN neurons. As the EC50 for HpTx3-induced frequency increase (Figure 4C; 79.8 ± 4.3 nM) is almost identical to the IC50 for HpTx3 inhibition of A-type channels (Figure 2D; 81.0 ± 4.0 nM), these quantitative data strongly suggest that the number of active A-type channels exerts a powerful control over the discharge rates of DA SN neurons.
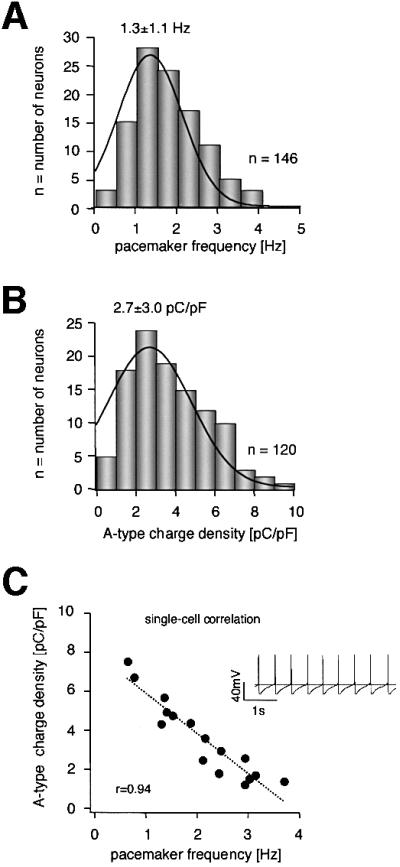
Fig. 3. Correlation of pacemaker frequencies and A-type potassium channel densities over the full physiological spectrum in DA SN neurons. (A) Frequency distribution of pacemaker frequencies from 146 DA SN neurons (standard whole-cell recordings). (B) Frequency distribution of A-type potassium charge densities (pC/pF) calculated from A-type potassium currents elicited at –40 mV from a holding potential of –80 mV recorded in 120 DA SN neurons (standard whole-cell). (C) Pacemaker frequencies and A-type potassium charge densities were codetermined in 16 DA SN neurons and show a strong linear correlation (r = 0.94, slope = –2.01, n = 16) over the full physiological range of both parameters. Insert: typical spontaneous pacemaker activity of a DA SN neuron (broken line at –40 mV).

Fig. 4. A-type potassium channels control pacemaker frequencies in DA SN neurons. (A) Upper panels: current clamp whole-cell recording of pacemaker activity of a DA SN neuron under control, in the presence of 100 nM HpTx3, and after washout of the toxin (broken lines at –40 mV). After current clamp recording, an outside-out patch was pulled from the same neuron and the effect of 100 nM HpTx3 on the A-type current elicited by a voltage step to –40 mV from a holding potential of –100 mV was recorded (lower panel) to correlate the effect of a particular HpTx3 concentration on the frequency and A-type current in the same neuron. (B) Mean data from experiments in (A): the degree of HpTx3-induced frequency increase is tightly coupled to the degree of HpTx3-induced A-current inhibition determined in the same cells. The strong linear correlation (r = 0.96, slope = 1.78, n = 4–6) predicts a 2.7-fold (+170%) increase of pacemaker frequencies with complete inhibition of A-type channels. (C) Mean dose-response for HpTx3-induced frequency increase in DA SN neurons: EC50=79.8 ± 4.3 nM (mean ±SD of fit), Hill coefficient of 2.1 (n = 4–6) is virtually identical to the IC50 of HpTx3-induced A-channel inhibition (see Figure 2D).
Molecular composition of A-type potassium channels in DA SN neurons
To identify the molecular composition of A-type potassium channels in DA SN neurons, we combined patch– clamp recordings with single-cell RT-multiplex–PCR (Lambolez et al., 1992), to probe for the expression of the relevant A-type channel α subunit candidate genes Kv4.1, Kv4.2 and Kv4.3 as well as Kv1.4 (Stuhmer et al., 1989), and Kvβ1.1 (Rettig et al., 1994). The primer pairs for Kv4.3 were designed to distinguish between the short (Kv4.3M) and the long (Kv4.3L) splice variants (Ohya et al., 1997; Isbrandt et al., 2000). For phenotypic identification of dopaminergic and GABAergic SN neurons, we probed in parallel for the expression of two neuronal markers, tyrosine-hydroxylase (TH) and l-glutamate-decarboxylase (GAD67). Figure 5A shows that all mRNAs, including both splice variants of Kv4.3, were detected using highly diluted mouse midbrain cDNA as a PCR template (<10 fmol template cDNA, positive control). With this protocol, we analysed the mRNA expression of A-type potassium channel subunits in single DA SN neurons with fast-inactivating A-type potassium currents. All analysed neurons displayed a homogeneous expression pattern of only TH and Kv4.3L mRNA (Figure 5B; n = 32). The inactivation time constants of A-type channels in these genotyped DA SN neurons were again normally distributed with a mean of 27.0 ± 9.5 ms (Figure 5C; mean ± SD, n = 32). In additional sets of experiments, we also probed for the expression of Kv3.4 subunits that build a TEA-sensitive A-type potassium channel (Rudy et al., 1991; Schroter et al., 1991). We did not detect Kv3.4 mRNA in any of the tested TH- and Kv4.3L-positive neurons (n = 7; data not shown).

Fig. 5. Fast inactivating A-type potassium channels are mediated by Kv4.3L and KChip3.1 expression in DA SN neurons. (A) PCR positive control: all A-type potassium channel candidate subunits and the two marker transcripts are detected using mouse midbrain cDNA (<10 fmol) as a PCR template. The amplified fragments had sizes (bp) predicted by their corresponding mRNA sequences. (B) Multiplex PCR expression profiling of a single dopaminergic (TH+, GAD67–) SN neuron displaying fast-inactivating A-type potassium current evoked by membrane depolarizations to –50 and –40 mV from a holding potential of –80 mV (upper panel). Agarose gel analysis (lower panel) shows that TH and Kv4.3L were coexpressed in this neuron. This homogeneous expression pattern was found for all analyzed DA SN neurons (n = 32). (C) Frequency distribution of the dominant fast time constant of inactivation of A-type potassium currents recorded (standard whole cell) in 32 genotyped (TH+, Kv4.3L+) DA SN neurons at –40 mV. This distribution is very similar to those of non-genotyped DA SN neurons shown in Figure 1B and D. (D–F) Same type of single-cell multiplex RT–PCR experiments as shown in (A–C) for KChip1-4 expression. (D) Positive control: all probed KChip subunits were expressed in mouse brain with KChip2.4, KChip3.1 (as well as KChip3.2) and KChip4.1 being the most prominent splice variants. (E) Agarose gel analysis shows that only TH and KChip3.1 were coexpressed in this DA SN neuron. This homogeneous expression pattern was found for all analyzed DA SN neurons (n = 12). (F) Frequency distribution of the dominant fast time constant of inactivation of A-type potassium currents recorded in 12 genotyped (TH+, KChip3.1+) SN neurons at –40 mV.
To identify the possible contribution of Kv4β subunits to the A-type potassium channels in DA SN neurons, we probed for the expression of the relevant candidate gene family, KChip1–4 (An et al., 2000). Primers were designed to detect and discriminate all currently described KChip splice variants: KChip1, KChip2.1–2.5, KChip3.1/3.2 and KChip4.1/4.2 (An et al., 2000; Bahring et al., 2001; Ohya et al., 2001; Spreafico et al., 2001; Dr D.Isbrandt, personal communication). As shown in Figure 5D, all mRNAs for KChip1–4 were detected using highly diluted mouse whole-brain cDNA as PCR template, with KChip2.4, KChip3.1 and KChip4.1 being the prominent splice variants (note also the smaller KChip3.2 PCR band). The single-cell KChip1-4 expression profiling demonstrated that DA SN neurons with fast inactivating A-type currents expressed only the long splice variant of KChip3, KChip3.1 (Figure 5E and F; mean ± SD, 28.3 ± 12.0 ms, n = 12). Sequencing of the KChip3.1 PCR fragment, amplified from single DA SN neurons, identified the KChip3.1 T+ variant, which contains four additional nucleotides at the beginning of exon three, compared with the KChip3 T– variant (Spreafico et al., 2001). Double-labelling immunocytochemistry confirmed at the protein level that Kv4.3 was expressed in identified (TH immunopositive) DA SN neurons (Figure 6). In accordance with the single-cell RT–PCR data, Kv4.2 protein was not detected in TH-positive midbrain neurons (data not shown).

Fig. 6. Double immunolabelling demonstrates Kv4.3 protein expression in DA SN neurons. Upper panels: overview of the distribution of Kv4.3 (green) and TH immunoreactivity (red) in the substantia nigra. Scale bars: 100 µm. Lower panels: Kv4.3 (green) and TH immunoreactivity (red) of a single DA SN neuron at high resolution. Scale bars: 10 µm.
Kv4.3L and KChip3.1 mRNA abundance linearly correlates with A-type potassium channel density in DA SN neurons
As we identified Kv4.3L and KChip3.1 as the only α and β subunits of fast inactivating A-type potassium channels in DA SN neurons, we studied a possible direct link between Kv4.3L and KChip3.1 mRNA abundance and the number of functional A-type channels at the level of individual cells. For this purpose, we developed Kv4.3- and KChip3-specific quantitative single-cell RT–PCR protocols, based on the real-time fluorescence TaqMan approach (Bustin, 2000; Medhurst et al., 2000). In control experiments, we characterized the performance of the Kv4.3 and KChip3 assays over a large range of template concentrations between 1 and 1 000 000 dsDNA molecules. A TaqMan real-time PCR result for different Kv4.3 template numbers is shown in Figure 7A, plotting the relative fluorescence intensity (Rf) against the number of PCR cycles. The same data were plotted on a logarithmic scale for a better identification of the exponential PCR amplification phase, and to set a fluorescence threshold of amplification detection (Figure 7B; cycle threshold, Ct line). These data show the high reproducibility of the Kv4.3 PCR assay and the independence of amplification kinetics from the template concentration. This allowed the generation of a Ct value standard curve (r = 0.999, slope = –3.41, intercept = 40.47) for absolute quantification of single-cell Kv4.3 cDNA molecules (Figure 7C; n = 4 parallel experiment). The mean slope of –3.41 ± 0.05 was close to the theoretical value of –3.32 (–1/log2) for a perfect PCR reaction that exactly doubles the number of template molecules with each cycle. A similar Ct value standard curve was obtained for KChip3 (r = 0.998, slope = –3.45, intercept = 39.66, n = 4 parallel experiments; data not shown). Figure 8A shows single-cell real-time PCR results for two individual DA SN neurons with an ∼4-fold difference in A-type channel densities (left panels). Quantitative RT–PCR analysis of both cells revealed a single-cell Ct value difference of about two, corresponding to a 4-fold difference in Kv4.3 expression levels (right panels). Based on our absolute standard (Figure 7C), we detected a spectrum of Kv4.3L expression between 6 and 68 cDNA molecules, using the cDNAs from single, electrophysiologically characterized DA SN neurons as templates for real-time PCR (Figure 8B; n = 21). Again, the inactivation time constants of A-type channels in these neurons, genotyped by real-time PCR, were normally distributed with a mean of 32.8 ± 5.5 ms (mean ± SD, n = 21). To assess a direct correlation between single-cell expression of Kv4.3L mRNA molecules and A-type potassium channel density, we plotted the number of calculated Kv4.3L cDNA molecules in individual neurons against their A-type channel charges, as well as against their A-type channel charge densities (Figure 8B). The numbers of Kv4.3L cDNA molecules were highly correlated to the total number, as well as to the density of functional A-type channels, over the complete physiological range at the level of individual DA SN neurons (Figure 8B left panel, r = 0.90, slope = 8.14; right panel, r = 0.91, slope = 0.22, n = 21).

Fig. 7. Real-time fluorescent RT–PCR standard curve for single-cell Kv4.3L quantification. (A) Sensitivity and reproducibility of the real-time fluorescent RT–PCR protocol for Kv4.3L. Relative fluorescence intensities (Rf) were plotted against PCR cycle number for quadruple experiments with five different calculated numbers of Kv4.3L dsDNA template molecules (ranging from 1 to 1 000 000 molecules, as indicated). (B) Same data as in (A) are plotted on a logarithmic Rf scale, for better illustration of the exponential phase of the PCR. Slopes of the exponential amplification phases are highly reproducible and independent of template concentration. The bold line indicates the fluorescence threshold of amplification detection at Rf = 0.08, manually set within the exponential PCR phase. (C) Absolute standard curve for Kv4.3L cDNA detection derived from data shown in (A) and (B). The cycle number where the relative fluorescence crosses this threshold of amplification detection is defined as the Ct value. Mean Ct values for different numbers of Kv4.3L template molecules are plotted against their respective numbers of template molecules on a logarithmic scale. The linear regression fit (r = 0.999) defined the intercept as PCR cycle 40.47.

Fig. 8. Linear correlation between A-type potassium charge and density, and number of Kv4.3 cDNA molecules. (A) Two examples of single-cell real-time fluorescent RT–PCR experiments on individual DA SN neurons. Different A-type current amplitudes with similar inactivation kinetics (corresponding to differences in A-type potassium charge transfer) are elicited by membrane depolarizations to –40 mV from a holding potential of –80 mV (left panels). The bold line indicates the threshold of amplification detection at Rf = 0.08. The DA SN neuron with a 4-fold smaller A-type potassium current displayed a Ct value of 38.2 (upper panels) that was about two cycles larger compared with that of the other DA SN neuron (Ct = 36.1). A difference of two Ct values corresponds to a 4-fold difference in Kv4.3L cDNA template concentration. (B) A-type potassium charge (left panel) and charge densities (right panel), and number of Kv4.3L cDNA molecules were codetermined in 21 DA SN neurons and show strong linear correlation (r = 0.90 and 0.91, respectively) over the full physiological range of both parameters. (C) A-type potassium charge densities and number of β-actin (left panel) and VMAT2 (right panel) cDNA molecules each were codetermined in 18 DA SN neurons and show no correlation (r = 0.14 and 0.21, respectively).
To control for the specificity of this quantitative single-cell genotype/phenotype correlation we developed quantitative PCR assays for β-actin and the dopaminergic marker genes vesicular monoamine transporter 2 (VMAT2) (Takahashi and Uhl, 1997), dopamine transporter (DAT) (Wu and Gu, 1999) and tyrosine hydroxylase (TH, see Materials and methods). The mRNA abundances of all four genes also varied significantly at the level of single DA SN neurons but were not correlated to the number or density of functional A-type channels (β-actin, r = 0.14, slope = 0.003, n = 18; VMAT2, r = 0.21, slope = –0.004, n = 18; Figure 8C, DAT, r = 0.05, slope = 0.0008, n = 18 and TH, r = 0.21, slope = 0.00002, n = 18; data not shown).
Figure 9A shows KChip3 single-cell real-time PCR results for two individual DA SN neurons, again with an ∼4-fold difference in A-type channel densities and an ∼2-fold difference in Ct-values. Based on the KChip3 standard, we detected a spectrum of KChip3.1 expression between two and 26 cDNA molecules, (n = 13). The mean inactivation time constant of A-type channels in these KChip3 genotyped neurons was 27.8 ± 2.4 ms (n = 13). Analogous to the results for Kv4.3, the numbers of KChip3.1 cDNA molecules were also highly correlated to the total number and to the density of functional A-type channels (Figure 9B, left panel, r = 0.90, slope = 17.4; right panel, r = 0.92, slope = 0.30, n = 13).

Fig. 9. Linear correlation between A-type potassium charge/density and number of KChip3 cDNA molecules. (A) Two examples of single-cell real-time fluorescent RT–PCR experiments on individual DA SN neurons (same type of experiment as described in caption to Figure 8). The DA SN neuron with an ∼4-fold smaller A-type potassium current displayed a Ct value of 39.2 (upper panels), which was about two cycles larger compared with that of the other neuron (Ct = 37.3). (B) A-type potassium charge and charge densities, and number of KChip3 cDNA molecules were codetermined in 13 DA SN neurons and show strong linear correlation (r = 0.90 and 0.92, respectively) over the full physiological range of both parameters.
In summary, our results explain the full spectrum of pacemaker frequencies in DA SN neurons by single-cell variations in the number of active A-type channels, which in turn are closely correlated to the levels of Kv4.3L as well as KChip3.1 mRNA transcripts.
Discussion
A-type channels control spontaneous activity in dopaminergic SN neurons
The presence of A-type potassium channels in DA SN neurons has been reported in several studies (Silva et al., 1990; Grace, 1991; Liss et al., 1999), but a biophysical and pharmacological characterization including the verification of gating properties in cell-free patches has not yet been provided. We show here that A-type potassium channels in classical DA SN neurons have properties that are consistent with heterologously-expressed Kv4/KChip potassium channels (Table I; compare, Serodio et al., 1996; Dilks et al., 1999; Faivre et al., 1999; Franqueza et al., 1999; An et al., 2000). In agreement with this homogeneous biophysical profile, qualitative single-cell multiplex RT–PCR also displayed a homogeneous expression profile of only the long splice variants of Kv4.3 and KChip3 in DA SN neurons. In recombinant systems, coexpression of KChip1 and KChip2 with Kv4α subunits enhanced channel surface expression and modified gating properties. The biophysical modification induced by KChip coexpression, i.e. the degree of activation shift to negative potentials, the slowing of inactivation and acceleration of recovery from inactivation of A-type channels, was not only dependent on the particular KChip gene but also on the KChip splice variant present (An et al., 2000; Bahring et al., 2001; Nakamura et al., 2001; Ohya et al., 2001). In this context, coexpression of the specific combination of Kv4.3L/KChip3.1 splice variants in DA SN neurons might be tailored to their specific function in pacemaker control. Future studies will show whether Kv4.3L and KChip3.1 subunits form functional A-type channel complexes in the plasma membrane of DA SN neurons, as was recently described for Kv4.3/KChip1 subunits in cerebellar granule cells (Holmqvist et al., 2001).
We detected large differences in the amplitudes and densities of fast-inactivating A-type potassium currents in DA SN neurons. These parameters were strongly correlated with the spontaneous pacemaker activities of DA SN neurons, demonstrating an important role of A-type channels in tuning pacemaker activity. The slope of –2 of this linear correlation indicated a simple rule for A-type channel-mediated frequency control: doubling of A-type channel charge density reduces the pacemaker frequency by half. The ratio of the population means of A-channel charge densities and pacemaker frequencies of 2.07 is consistent with the rule. Moreover, the quantitative pharmacological data using the selective Kv4 channel blocker HpTx3 demonstrated that A-type channel density and frequency are indeed highly coupled at the level of individual DA neurons.
Quantitative real-time single-cell RT–PCR: Kv4.3L and KChip3.1 expression controls pacemaker activity of DA SN neurons
To address a possible quantitative phenotype/genotype correlation between the number of active A-type channels and Kv4.3L or KChip3.1 mRNA transcripts at the level of the individual cell, we developed quantitative real-time single-cell RT–PCR protocols for the detection of these Kv4 α and β subunits, as well as for several control genes, based on the TaqMan technique (Bustin, 2000; Medhurst et al., 2000). In contrast to previous quantitative single-cell studies, which correlated mean functional phenotypes with mean gene expression at the level of neuronal populations (Baro et al., 1997; Tkatch et al., 2000), our protocol is the first that provides quantitative comparison between individual neurons. In accordance with these population studies we demonstrate a strong linear correlation between A-type channel charge/density and Kv4.3 as well as KChip3 cDNA molecules over the full physiological range in DA SN neurons. In comparison, density gradients of A-type currents in heart tissue were either correlated with only KChip2 expression but not Kv4.3 (canine, human) or only with Kv4.2 but not KChip2 expression (rat) (Rosati et al., 2001).
Single-cell analysis of four different control genes (β-actin, VMAT2, DAT, TH) showed no correlation with the A-type channel density, demonstrating the specificity of our described genotype/phenotype correlations. It is noteworthy that all analysed control genes displayed large variations in mRNA abundance at the level of individual DA SN neurons. Consequently, these genes are not appropriate for normalization of quantitative RT–PCR data from single DA SN neurons.
From our data, we can estimate the correlation between the numbers of single-cell Kv4.3L and KChip3.1 cDNA molecules and that of functional A-type channels in the plasma membrane. To determine and compare the absolute numbers of mRNA transcripts based on our single-cell cDNA values, one would have to take the efficiencies of cDNA synthesis for the different target genes into account. The efficiencies of the reverse transcription (RT) can be as low as 1–30%, depending on transcript secondary structure, protein–mRNA complex formation and total RNA copy number (Gerard et al., 1997; Zhang and Byrne, 1999; Bustin, 2000). Determining the RT efficiency in in vitro reactions or even via competitor RNA, directly added to single cell material as an internal standard (Tsuzuki et al., 2001), might still not fully represent the complex RT behaviour of genuine single-cell mRNA. A direct experimental definition of the Kv4.3L or KChip3.1 single-cell RT efficiency would provide mRNA/cDNA correction factors, but would have no impact on our major finding, the linear correlation between the number of functional A-type channels and the abundance of both Kv4α and Kv4β mRNA.
The correlation described between A-type whole-cell conductance and cDNA molecules of 1.5 nS per Kv4.3L for individual DA SN neurons is similar to those comparing different neuronal populations [∼2 nS per Kv4.2 (Tkatch et al., 2000) and ∼1.25 nS for lobster shal (Baro et al., 1997)]. This factor is considerably higher for KChip3 (10.8 nS per KChip3 cDNA). Assuming a similar RT efficiency of Kv4.3 and KChip3, this might indicate a higher translation efficiency of the Kv4β subunit compared with that of the Kv4α subunit. Given an open probability (Po) of about 0.1 and unitary conductance of recombinant Kv4.3L channels of 18 ps (Wang et al., 2000), a single Kv4.3 cDNA molecule would correspond to ∼800 functional Kv4.3 channels, made up of 3200 Kv4.3 subunits (N = macroscopic current/Po*unitary current). A single KChip3 cDNA molecule would correspond to ∼6000 functional channels. These coupling rates between transcription and translation are comparable to those described in a systematic study of mRNA/protein correlation for >100 different genes (correlation ∼1/4000) in yeast (Futcher et al., 1999). The linear correlation in DA SN neurons between the size of the active A-type channel pool and Kv4.3 as well as KChip3 transcription implies that downstream regulatory mechanisms might all be coupled in a linear and non-saturating fashion. Future studies might address the interesting question of which signals, including neuronal activity itself, control Kv4.3L and KChip3.1 gene expression (Song et al., 2001; Zhang et al., 2001), and consequently DA pacemaker frequency and dopamine release.
Physiological role of activity control in DA neurons
There is good evidence that striatal dopamine release is linearly coupled to the electrical activity of DA SN neurons: a decrease in pacemaker frequency of 1 Hz would reduce dopamine release by ∼10% (Cragg et al., 2000). While chronic neuroleptic therapy can dramatically decrease electrical activity of DA SN neurons and induce Parkinsonian symptoms (Grace et al., 1997; Boye and Rompre, 2000), increased striatal dopamine release has been found in schizophrenic patients and is highly correlated with psychotic episodes (Abi-Dargham et al., 2000). Thus, a better understanding of the molecular mechanisms that control pacemaker activity in DA neurons is essential. Given the findings of this study, Kv4.3L/KChip3.1 A-type channels might provide a novel therapeutic target to modulate the striatonigral dopaminergic system of the brain.
Materials and methods
Electrophysiology
Coronal midbrain slice preparation from 14-day-old C57bl6/J mice and electrophysiological recording/data analysis were performed as previously described (Liss et al., 1999). Only experiments with uncompensated series resistances of <4 MΩ were analyzed and compensated by 85%. Voltage clamp recordings, apart from the combined current clamp and voltage clamp recordings (Figure 3C), were in 250 nM tetrodotoxin (TTX) in the artificial cerebrospinal fluid (ACSF). The A-type charge transfer (pC) was calculated by integrating (nA × ms) the fast-inactivating current component. The A-type charge density (pC/pF) was calculated by dividing the A-type charge transfer (pC) by whole-cell capacitance (pF) as a measure of cell size. Concentration-response data were fitted according to the Hill relationship {I/Imax = 1/[1+(X)/IC50]n}. Data were given as mean ± SEM or as mean ± SD.
Qualitative single-cell RT–multiplex-PCR
Single-cell experiments and control reactions were performed as previously described (Liss et al., 1999). Following RT, the cDNAs for Kv4.1, Kv4.2, Kv4.3M/L, Kv1.4, Kvβ 1.1, TH and GAD67 were amplified in a multiplex PCR using the following set of primers. Kv4.1-F1 5′-CTCCAAAGAGCAGTCGTGTG-3′ (DDBJ/EMBL/GenBank accession number NM_008423, pos. 651); Kv4.1-R1 5′-GACTTTCATCTGGCG TGTTG-3′ (1837); Kv4.2-F1 5′-GCCTTCGTTAGCAAATCTGG-3′ [S64320 (rat) 1944]; Kv4.2-R1 5′-GGGTCACAGGAATACAGTG GAC-3′ (2718); Kv4.3-F1 5′-ATCTTCAAGTTCTCCCGACAT-3′ (Kv4.3L: AF107781, Kv4.3M: AF107782, 889); Kv4.3-R1 5′-GTT TGGTCTCAGTCCGTCGT-3′ (1812/1775); Kv1.4-F1 5′-CTCTGGG CTCCACTAACGAG-3′ (U03722/U03723, pos. 189); Kv1.4-R1 5′-CTT CTCAGAGACTCGGCGTT-3′ (U03723, 715); Kvβ 1.1-F1 CAATTGCCTACGAAAGTGGAG (X97281, 711) and Kvβ 1.1-R1 5′-GTGATTGAAAAGAGTGGCTGG-3′ (1683). Primer pairs for TH and GAD67 and PCR conditions were identical to those previously described (Liss et al., 1999). Nested PCR amplifications were carried out in individual 50 µl reactions in a Perkin Elmer Thermocycler GeneAmp 9700 (Applied Biosystems) with the following primer pairs: Kv4.1-F2 5′-CATCTGCTCACTTAGCGGTG-3′ (1170); Kv4.1-R2 5′-CACTCTTTGCCAAACGGATT-3′ (1321); Kv4.2-F2 5′-TTGAAG AAAGCTGCATGGAA-3′ (2047); Kv4.2-R2 5′-CTTCCATTTTGG CATTTAAGC-3′ (2295); Kv4.3-F2 5′-CCACCTGCTACACTG CTTAGAA-3′ (1431); Kv4.3-R2 5′-CAAATTAAGGCTGGAGCGAC-3′ [1785(L)/1728(M)]; Kv1.4-F2 5′-GACAACCGAACTTGTTCCGT-3′ (U03722, 243); Kv1.4-R2 5′-GTCTTAGCACTTGCCTTCTC-3′ (U03723, 421); Kvβ 1.1-F2 5′-ATGGAAGAAATCGTTCGAGC-3′ (986) and Kvβ 1.1-R2 5′-GGTTTTCAATGAGTTGTTCC-3′ (1490). RT–PCR for Kv3.4 was carried out as multiplex PCR in combination with Kv4.3, TH and GAD67 using the following set of primers: mKv3.4-F5 (exon2 M81253, exon3 Aj010309; 93) 5′-GACGGAGATTCATCG GGTAG-3′; mKv3.4-R1 (140) 5′-CTTCTTGTTTCTGTCCCGTGT-3′; mKv3.4-F25 (305) 5′-AGGTGGGATTGAGTGGTTTG-3′ and mKv3.4-R5 (187) 5′-TCAGCACAGGCATAGTCCC-3′. KChip primers were designed to detect and discriminate the following splice variants: KChip2, five splice variants (2.1–2.5); KChip3, two splice variants (3.1 and 3.2) and KChip4, two splice variants (4.1 and 4.2). Outer primer sequences: mKChip1-F6 (AK014313, 218) 5′-CCCCACGTTTTCTGAATACC-3′; mKChip1-R3 (597) 5′-TTCATTGACCACACCGCTAG-3′; mKChip2.4-F3 (AB044570, 17) 5′-GCAAGGAGAGTTTGTCCGAT-3′; mKChip2.4-R36 (696) 5′-GAAGCTCTCCACATGTTCCC-3′; mKChip3.1-F5 (AF287733, 80) 5′-AAGCGGGAAGATTAGTGACG-3′; mKChip3.1-R72 (676) 5′-CTCCTCCTTGGTGATGCAA-3′; mKChip4.1-F34 (AF305071, 30) 5′-GAACGTGAGAAGGGTGGAAA-3′ and mKChip4.1-R35 (615) 5′-GGGAGCATCTTCCTTGAGG-3′. Inner primer sequences: mKChip1-F29 (266) 5′-TTTTGCTTTCTCGCT TTTCC-3′; mKChip1-R8 (446) 5′-TCTTTAGAGGGTCGCCTTTG-3′; mKChip2.4-F17 (54) 5′-CTCCTACGACCAGCTCACG-3′; mKChip2.4-R15 (657) 5′-TGCAGGGTACGTGTACTTGC-3′; mKChip3.1-F13 (243) 5′-TGATGCGTTGCTGCTTAATC-3′; mKChip3.1-R4 (621) 5′-TTG AGCTTCTCATGGACCG-3′; mKChip4.1-F5 (12) 5′-AAGGGTGGA AAGCATCTCG-3′ and mKChip4.1-R4 (606) 5′-TTCCTTGAGGAC CGGGTAT-3′. All primers were designed to be intron spanning. To investigate the presence and size of the amplified fragments, 15 µl aliquots of PCR products were separated in parallel with a 100 bp ladder by electrophoresis and visualized in 2% agarose gels with ethidium bromide. The predicted sizes (bp) of the PCR-generated fragments were: TH (377), GAD67 (702), Kv4.1 (152), Kv4.2 (249), Kv4.3L/M (355/298), Kv1.4 (498), Kvβ 1.1 (505), Kv3.4 (829), KChip1 (180), KChip2.1(549), KChip2.2 (453), KChip2.3 (648), KChip2.4 (603), KChip2.5 (345), KChip3.1/3.2 (378/312) and KChip4.1/4.2 (594/492). The identities of PCR products were verified by direct sequencing. RT minus controls were negative for all analyzed neurons (n = 9 for Kvα subunit protocol, n = 5 for KChip protocol).
Quantitative real-time single-cell PCR (TaqMan)
Hybridization primer/probe assays specific for real-time PCR detection of Kv4.3 and KChip3, as well as for β-actin, tyrosine hydroxylase, VMAT2 and DAT were developed according to the recommended criteria using the Abiprism Primer express (Applied Biosystems) software and the TaqMan Mastermix (Applied Biosystems). The sequences of primers and probes were as follows: Kv4.3-F 5′-CAGCGGTGTCCTGGTCATT-3′ (1167), Kv4.3-R 5′-CTCTCTGATTCTGGTGGTAGATCCT-3′ (1246) and Kv4.3-probe 5′-CCGGTCCCTGTGATAGTCTCCAACTTTAGC-3′ (1192); KChip3-F 5′-TCCCTTTCAGCAGCAGAGATG-3′ (101), KChip3-R 5′-AGTGGTATGCGCCCAGGAT-3′ (189) and KChip3-probe 5′-TGCCTTCACGGCTTCCTTGGTCCT-3′ (125); TH-F 5′-GAA TGGGGAGCTGAAGGCTTA-3′ (M69200, 1151), TH-R 5′-CTGCTGTGTCTGGTCAAAGG-3′ (1260) and TH-probe 5′-CTATGGAGAGCT CCTGCACTCCCTGTCA-3′ 1193); β-actin-F 5′-CCCTAAGGCCAACCGTGAA-3′ (X03672, 413), β-actin-R 5′-CAGCCTGGATGGCTACGTACA-3′ (495) and β-actin-probe 5′-ATGACCCAGATCATG TTTGAGACCTTCAACAC-3′ (535); VMAT2-F 5′-CACTGTCCAGCTCCTCACCAA-3′ (449), 5′-VMAT2-R CATAATGCAGAATCCAGCAAACA-3′ (541) and VMAT2-probe 5′-TCATAGGACTTC TAACCAACAGAATTGGCTATCCAA-3′ (455); DAT-F 5′-CCTGTACTGGCGGCTATGCT-3′ (NM_010020, 1628), DAT-R 5′-GGGAAGATGTAGGCTCCATAGTGT-3′ (1738) and DAT-probe 5′-AAG GTCACAATGCTGACCACGACCACATA-3′ (1677). All probes were 3′ labelled with TAMRA (6-carboxytetramethylrhodamine) as quencher dye. The hybridization-probes for Kv4.3, VMAT2 and DAT were 5′-labelled with FAM (6-carboxyfluoroscein) and the hybridization probes for KChip3 and TH with VICTM as reporter dye. RT was performed with the same batch of Superscript, random hexamers and dNTPs for all TaqMan-analyzed cells. Single-cell cDNA was purified (B.Liss, patent pending) and used as template in a 50 µl PCR reaction in 1 × TaqMan Hybridization-probe master mix in the presence of 300 nM of the respective forward primer, 900 or 300 nM (TH and DAT) of the corresponding reverse primer, and 125 nM of the specific probes. Real-time PCR was performed in a GeneAmp 5700 thermocycler (Applied Biosystems; PCR program: 2 min at 50°C, 10 min at 95°C, 50 cycles: 15 s at 95°C and 1 min at 60°C), and analyzed with the GeneAmp 5700 software. After defining a baseline (normalized background fluorescence of cycles 6–15) in a linear plot of relative fluorescence (Rf) against the PCR cycle number, quantification of the initial template molecules was performed by detecting the PCR cycle where the exponentially increasing relative fluorescence (Rf) crosses a manually set detection threshold (Ct) line, defined in a logarithmic plot of Rf values against PCR cycles. All data were analyzed at Rf = 0.08. For absolute quantification of single-cell cDNA Kv4.3/KChip3 expression, defined amounts of Kv4.3 DNA molecules were used as PCR templates to generate standard curves. Template DNA for standard curves were PCR-generated, purified (Quiaquick Gel Extraction and PCR Purification Kits, Quiagen, UK) and quantified using a BioPhotometer (Eppendorf, Germany).
Immunocytochemistry
Immunocytochemistry was performed as previously described (Wolfart et al., 2001). Slices were incubated overnight with rabbit anti-rat Kv4.3 or rabbit anti-rat Kv4.2 (both 1:1000, Alomone labs, Israel) and with sheep anti-TH (1:1000, Chemicon, USA), and for 120 min with secondary antibodies (1:1000, Molecular Probes, USA): 488 nm goat anti-rabbit, 546 nm donkey anti-sheep IgG. For negative controls, 1 µg of each antibody and of the respective peptide were preincubated for 1 h prior to immunocyochemistry.
Acknowledgments
Acknowledgements
We are grateful to Dr D.Isbrandt for providing KChip1–4 splice variant information. We thank NPS Pharmaceuticals, USA for the gift of HpTx3. This work was supported by grants from MRC and DFG to J.R. J.R. is a Monsanto Senior Research Fellow at Exeter College, Oxford. B.L. is a Todd-Bird Junior Research Fellow at New College, Oxford and a Dorothy Hodgkin Royal Society Fellow.
References
- Abi-Dargham A. et al. (2000) Increased baseline occupancy of D2 receptors by dopamine in schizophrenia. Proc. Natl Acad. Sci. USA, 97, 8104–8109. [DOI] [PMC free article] [PubMed] [Google Scholar]
- An W.F. et al. (2000) Modulation of A-type potassium channels by a family of calcium sensors. Nature, 403, 553–556. [DOI] [PubMed] [Google Scholar]
- Bahring R., Dannenberg,J., Peters,H.C., Leicher,T., Pongs,O. and Isbrandt,D. (2001) Conserved Kv4 N-terminal domain critical for effects of Kv channel-interacting protein 2.2 on channel expression and gating. J. Biol. Chem., 276, 23888–23894. [DOI] [PubMed] [Google Scholar]
- Baro D.J., Levini,R.M., Kim,M.T., Willms,A.R., Lanning,C.C., Rodriguez,H.E. and Harris-Warrick,R.M. (1997) Quantitative single-cell reverse transcription-PCR demonstrates that A-current magnitude varies as a linear function of shal gene expression in identified stomatogastric neurons. J. Neurosci., 17, 6597–6610. [DOI] [PMC free article] [PubMed] [Google Scholar]
- Boye S.M. and Rompre,P.P. (2000) Behavioral evidence of depolarization block of dopamine neurons after chronic treatment with haloperidol and clozapine. J. Neurosci., 20, 1229–1239. [DOI] [PMC free article] [PubMed] [Google Scholar]
- Bustin S.A. (2000) Absolute quantification of mRNA using real-time reverse transcription polymerase chain reaction assays. J. Mol. Endocrinol., 25, 169–193. [DOI] [PubMed] [Google Scholar]
- Coetzee W.A. et al. (1999) Molecular diversity of K+ channels. Ann. N. Y. Acad. Sci., 868, 233–285. [DOI] [PubMed] [Google Scholar]
- Connor J.A. and Stevens,C.F. (1971a) Prediction of repetitive firing behaviour from voltage clamp data on an isolated neurone soma. J. Physiol., 213, 31–53. [DOI] [PMC free article] [PubMed] [Google Scholar]
- Connor J.A. and Stevens,C.F. (1971b) Voltage clamp studies of a transient outward membrane current in gastropod neural somata. J. Physiol., 213, 21–30. [DOI] [PMC free article] [PubMed] [Google Scholar]
- Cragg S.J., Hille,C.J. and Greenfield,S.A. (2000) Dopamine release and uptake dynamics within nonhuman primate striatum in vitro. J. Neurosci., 20, 8209–8217. [DOI] [PMC free article] [PubMed] [Google Scholar]
- Dilks D., Ling,H.P., Cockett,M., Sokol,P. and Numann,R. (1999) Cloning and expression of the human Kv4.3 potassium channel. J. Neurophysiol., 81, 1974–1977. [DOI] [PubMed] [Google Scholar]
- Faivre J.F., Calmels,T.P., Rouanet,S., Javre,J.L., Cheval,B. and Bril,A. (1999) Characterisation of Kv4.3 in HEK293 cells: comparison with the rat ventricular transient outward potassium current. Cardiovasc. Res., 41, 188–199. [DOI] [PubMed] [Google Scholar]
- Franqueza L., Valenzuela,C., Eck,J., Tamkun,M.M., Tamargo,J. and Snyders,D.J. (1999) Functional expression of an inactivating potassium channel (Kv4.3) in a mammalian cell line. Cardiovasc. Res., 41, 212–219. [DOI] [PubMed] [Google Scholar]
- Futcher B., Latter,G.I., Monardo,P., McLaughlin,C.S. and Garrels,J.I. (1999) A sampling of the yeast proteome. Mol. Cell. Biol., 19, 7357–7368. [DOI] [PMC free article] [PubMed] [Google Scholar]
- Gerard G.F., Fox,D.K., Nathan,M. and D’Alessio,J.M. (1997) Reverse transcriptase. Mol. Biotechnol., 8, 61–77. [DOI] [PubMed] [Google Scholar]
- Goldman-Rakic P.S., Muly,E.C.,III and Williams,G.V. (2000) D(1) receptors in prefrontal cells and circuits. Brain Res. Brain Res. Rev., 31, 295–301. [DOI] [PubMed] [Google Scholar]
- Grace A.A. (1991) Regulation of spontaneous activity and oscillatory spike firing in rat midbrain dopamine neurons recorded in vitro. Synapse, 7, 221–234. [DOI] [PubMed] [Google Scholar]
- Grace A.A. and Bunney,B.S. (1984a) The control of firing pattern in nigral dopamine neurons: burst firing. J. Neurosci., 4, 2877–2890. [DOI] [PMC free article] [PubMed] [Google Scholar]
- Grace A.A. and Bunney,B.S. (1984b) The control of firing pattern in nigral dopamine neurons: single spike firing. J. Neurosci., 4, 2866–2876. [DOI] [PMC free article] [PubMed] [Google Scholar]
- Grace A.A. and Onn,S.P. (1989) Morphology and electrophysiological properties of immunocytochemically identified rat dopamine neurons recorded in vitro. J. Neurosci., 9, 3463–3481. [DOI] [PMC free article] [PubMed] [Google Scholar]
- Grace A.A., Bunney,B.S., Moore,H. and Todd,C.L. (1997) Dopamine-cell depolarization block as a model for the therapeutic actions of antipsychotic drugs. Trends Neurosci., 20, 31–37. [DOI] [PubMed] [Google Scholar]
- Holmqvist M.H., Cao,J., Knoppers,M.H., Jurman,M.E., Distefano,P.S., Rhodes,K.J., Xie,Y. and An,W.F. (2001) Kinetic modulation of Kv4-mediated A-current by arachidonic acid is dependent on potassium channel interacting proteins. J. Neurosci., 21, 4154–4161. [DOI] [PMC free article] [PubMed] [Google Scholar]
- Isbrandt D., Leicher,T., Waldschutz,R., Zhu,X., Luhmann,U., Michel,U., Sauter,K. and Pongs,O. (2000) Gene structures and expression profiles of three human KCND (Kv4) potassium channels mediating A-type currents I(TO) and I(SA). Genomics, 64, 144–154. [DOI] [PubMed] [Google Scholar]
- Kitai S.T., Shepard,P.D., Callaway,J.C. and Scroggs,R. (1999) Afferent modulation of dopamine neuron firing patterns. Curr. Opin. Neurobiol., 9, 690–697. [DOI] [PubMed] [Google Scholar]
- Lacey M.G., Mercuri,N.B. and North,R.A. (1989) Two cell types in rat substantia nigra zona compacta distinguished by membrane properties and the actions of dopamine and opioids. J. Neurosci., 9, 1233–1241. [DOI] [PMC free article] [PubMed] [Google Scholar]
- Lambolez B., Audinat,E., Bochet,P., Crepel,F. and Rossier,J. (1992) AMPA receptor subunits expressed by single Purkinje cells. Neuron, 9, 247–258. [DOI] [PubMed] [Google Scholar]
- Liss B., Bruns,R. and Roeper,J. (1999) Alternative sulfonylurea receptor expression defines metabolic sensitivity of K-ATP channels in dopaminergic midbrain neurons. EMBO J., 18, 833–846. [DOI] [PMC free article] [PubMed] [Google Scholar]
- Medhurst A.D., Harrison,D.C., Read,S.J., Campbell,C.A., Robbins,M.J. and Pangalos,M.N. (2000) The use of TaqMan RT-PCR assays for semiquantitative analysis of gene expression in CNS tissues and disease models. J. Neurosci. Methods, 98, 9–20. [DOI] [PubMed] [Google Scholar]
- Nakamura T.Y., Nandi,S., Pountney,D.J., Artman,M., Rudy,B. and Coetzee,W.A. (2001) Different effects of the Ca2+-binding protein, KChIP1, on two Kv4 subfamily members, Kv4.1 and Kv4.2. FEBS Lett., 499, 205–209. [DOI] [PubMed] [Google Scholar]
- Obeso J.A., Rodriguez-Oroz,M.C., Rodriguez,M., Lanciego,J.L., Artieda,J., Gonzalo,N. and Olanow,C.W. (2000) Pathophysiology of the basal ganglia in Parkinson’s disease. Trends Neurosci., 23, S8–19. [DOI] [PubMed] [Google Scholar]
- Ohya S., Tanaka,M., Oku,T., Asai,Y., Watanabe,M., Giles,W.R. and Imaizumi,Y. (1997) Molecular cloning and tissue distribution of an alternatively spliced variant of an A-type K+ channel α-subunit, Kv4.3 in the rat. FEBS Lett., 420, 47–53. [DOI] [PubMed] [Google Scholar]
- Ohya S., Morohashi,Y., Muraki,K., Tomita,T., Watanabe,M., Iwatsubo,T. and Imaizumi,Y. (2001) Molecular cloning and expression of the novel splice variants of K+ channel-interacting protein 2. Biochem. Biophys. Res. Commun., 282, 96–102. [DOI] [PubMed] [Google Scholar]
- Onn S.P., West,A.R. and Grace,A.A. (2000) Dopamine-mediated regulation of striatal neuronal and network interactions. Trends Neurosci., 23, S48–56. [DOI] [PubMed] [Google Scholar]
- Paoletti P. and Ascher,P. (1994) Mechanosensitivity of NMDA receptors in cultured mouse central neurons. Neuron, 13, 645–655. [DOI] [PubMed] [Google Scholar]
- Rettig J., Heinemann,S.H., Wunder,F., Lorra,C., Parcej,D.N., Dolly,J.O. and Pongs,O. (1994) Inactivation properties of voltage-gated K+ channels altered by presence of β-subunit. Nature, 369, 289–294. [DOI] [PubMed] [Google Scholar]
- Rosati B., Pan,Z., Lypen,S., Wang,H.S., Cohen,I., Dixon,J.E. and McKinnon,D. (2001) Regulation of KChIP2 potassium channel β subunit gene expression underlies the gradient of transient outward current in canine and human ventricle. J. Physiol., 533, 119–125. [DOI] [PMC free article] [PubMed] [Google Scholar]
- Rudy B. (1988) Diversity and ubiquity of K channels. Neuroscience, 25, 729–749. [DOI] [PubMed] [Google Scholar]
- Rudy B., Sen,K., Vega-Saenz de Miera,E., Lau,D., Ried,T. and Ward,D.C. (1991) Cloning of a human cDNA expressing a high voltage-activating, TEA-sensitive, type-A K+ channel which maps to chromosome 1 band p21. J. Neurosci. Res., 29, 401–412. [DOI] [PubMed] [Google Scholar]
- Sanguinetti M.C., Johnson,J.H., Hammerland,L.G., Kelbaugh,P.R., Volkmann,R.A., Saccomano,N.A. and Mueller,A.L. (1997) Heteropodatoxins: peptides isolated from spider venom that block Kv4.2 potassium channels. Mol. Pharmacol., 51, 491–498. [PubMed] [Google Scholar]
- Schroter K.H., Ruppersberg,J.P., Wunder,F., Rettig,J., Stocker,M. and Pongs,O. (1991) Cloning and functional expression of a TEA-sensitive A-type potassium channel from rat brain. FEBS Lett., 278, 211–216. [DOI] [PubMed] [Google Scholar]
- Serodio P. and Rudy,B. (1998) Differential expression of Kv4 K+ channel subunits mediating subthreshold transient K+ (A-type) currents in rat brain. J. Neurophysiol., 79, 1081–1091. [DOI] [PubMed] [Google Scholar]
- Serodio P., Vega-Saenz de Miera,E. and Rudy,B. (1996) Cloning of a novel component of A-type K+ channels operating at subthreshold potentials with unique expression in heart and brain. J. Neurophysiol., 75, 2174–2179. [DOI] [PubMed] [Google Scholar]
- Silva N.L., Pechura,C.M. and Barker,J.L. (1990) Postnatal rat nigrostriatal dopaminergic neurons exhibit five types of potassium conductances. J. Neurophysiol., 64, 262–272. [DOI] [PubMed] [Google Scholar]
- Smith Y. and Kieval,J.Z. (2000) Anatomy of the dopamine system in the basal ganglia. Trends Neurosci., 23, S28–33. [DOI] [PubMed] [Google Scholar]
- Song W.J., Tkatch,T., Baranauskas,G., Ichinohe,N., Kitai,S.T. and Surmeier,D.J. (1998) Somatodendritic depolarization-activated potassium currents in rat neostriatal cholinergic interneurons are predominantly of the A type and attributable to coexpression of Kv4.2 and Kv4.1 subunits. J. Neurosci., 18, 3124–3137. [DOI] [PMC free article] [PubMed] [Google Scholar]
- Song M., Helguera,G., Eghbali,I.M., Zhu,N., Zarei,M.M., Olcese,R., Toro,L. and Stefani,E. (2001) Remodeling of Kv4.3 potassium channel gene expression under the control of sex hormones. J. Biol. Chem., 276, 31883–31890. [DOI] [PubMed] [Google Scholar]
- Spanagel R. and Weiss,F. (1999) The dopamine hypothesis of reward: past and current status. Trends Neurosci., 22, 521–527. [DOI] [PubMed] [Google Scholar]
- Spreafico F., Barski,J.J., Farina,C. and Meyer,M. (2001) Mouse dream/calsenilin/kchip3: gene structure, coding potential and expression. Mol. Cell. Neurosci., 17, 1–16. [DOI] [PubMed] [Google Scholar]
- Stuhmer W., Ruppersberg,J.P., Schroter,K.H., Sakmann,B., Stocker,M., Giese,K.P., Perschke,A., Baumann,A. and Pongs,O. (1989) Molecular basis of functional diversity of voltage-gated potassium channels in mammalian brain. EMBO J., 8, 3235–3244. [DOI] [PMC free article] [PubMed] [Google Scholar]
- Takahashi N. and Uhl,G. (1997) Murine vesicular monoamine transporter 2: molecular cloning and genomic structure. Brain Res. Mol. Brain Res., 49, 7–14. [DOI] [PubMed] [Google Scholar]
- Tkatch T., Baranauskas,G. and Surmeier,D.J. (2000) Kv4.2 mRNA abundance and A-type K+ current amplitude are linearly related in basal ganglia and basal forebrain neurons. J. Neurosci., 20, 579–588. [DOI] [PMC free article] [PubMed] [Google Scholar]
- Tseng G.N., Jiang,M. and Yao,J.A. (1996) Reverse use dependence of Kv4.2 blockade by 4-aminopyridine. J. Pharmacol. Exp. Ther., 279, 865–876. [PubMed] [Google Scholar]
- Tsuzuki K., Lambolez,B., Rossier,J. and Ozawa,S. (2001) Absolute quantification of AMPA receptor subunit mRNAs in single hippocampal neurons. J. Neurochem., 77, 1650–1659. [DOI] [PubMed] [Google Scholar]
- Wang H., Shi,H., Zhang,L., Pourrier,M., Yang,B., Nattel,S. and Wang,Z. (2000) Nicotine is a potent blocker of the cardiac A-type K+ channels. Effects on cloned Kv4.3 channels and native transient outward current. Circulation, 102, 1165–1171. [DOI] [PubMed] [Google Scholar]
- Wolfart J., Neuhoff,H., Franz,O. and Roeper,J. (2001) Differential expression of the small-conductance, calcium-activated potassium channel SK3 is critical for pacemaker control in dopaminergic midbrain neurons. J. Neurosci., 21, 3443–3456. [DOI] [PMC free article] [PubMed] [Google Scholar]
- Wu X. and Gu,H.H. (1999) Molecular cloning of the mouse dopamine transporter and pharmacological comparison with the human homologue. Gene, 233, 163–170. [DOI] [PubMed] [Google Scholar]
- Zhang J. and Byrne,C.D. (1999) Differential priming of RNA templates during cDNA synthesis markedly affects both accuracy and reproducibility of quantitative competitive reverse-transcriptase PCR. Biochem. J., 337, 231–241. [PMC free article] [PubMed] [Google Scholar]
- Zhang T.T., Takimoto,K., Stewart,A.F., Zhu,C. and Levitan,E.S. (2001) Independent regulation of cardiac Kv4.3 potassium channel expression by angiotensin II and phenylephrine. Circ. Res., 88, 476–482. [DOI] [PubMed] [Google Scholar]