

Abstract
Here we report the first characterization of replication timing and its regulation in the fission yeast Schizosaccharomyces pombe. We used three different synchronization methods: centrifugal elutriation, cdc10 temperature-shift and release, and starvation for deoxyribonucleoside triphosphates (dNTPs) by treatment with hydroxyurea (HU) followed by removal of HU, to study the times when specific autonomously replicating sequence elements (ARS elements; potential replication origins) replicate during S phase. We found that individual ARS elements replicate at characteristic times, some early and some late, independently of synchronization method. In wild-type cells treated with HU, early ARS elements replicated but late ones did not. However, in HU-treated mutant cells lacking the Rad3 (similar to human ATR and ATM) or Cds1 (similar to human CHK2) checkpoint kinase, both early and late ARS elements were able to replicate. Thus under conditions of dNTP starvation the Rad3 and Cds1 kinases are needed to suppress the replication of normally late-replicating regions.
Keywords: checkpoint/initiation/replication/Schizosaccharomyces pombe/timing
Introduction
DNA molecules in eukaryotic chromosomes are replicated from multiple origins, which fire in a programmed sequence at different times during S phase (Fangman and Brewer, 1992; Simon and Cedar, 1996; Dimitrova and Gilbert, 2000; Heun et al., 2001). The features that distinguish early from late origins are not yet fully understood, but it is clear that the distinction between early and late origins is established during G1 phase (Raghuraman et al., 1997; Dimitrova and Gilbert, 1999), and it is likely that this distinction involves both nuclear position (Calza et al., 1984; Dimitrova and Gilbert, 1999; Heun et al., 2001) and chromatin structure (Lima-de-Faria and Jaworska, 1968; Dhar et al., 1989).
Why do origins fire at different times during S phase? There are several possibilities. First, there is a rough correlation between time of replication and gene expression. Euchromatin, in which most genes are active, tends to replicate in early S phase, while heterochromatin, in which most genes are repressed, tends to replicate in late S phase (Lima-de-Faria and Jaworska, 1968; Holmquist, 1987). Thus the time at which an origin fires may affect the level of transcription within the flanking chromatin (Loupart et al., 2000). Secondly, if all origins were to fire simultaneously, the resulting demand for dNTPs and/or for DNA polymerases and other replication proteins might be larger than the cell can provide (Desany et al., 1998; Dimitrova and Gilbert, 2000). Thus the programmed firing of origins over an extended S phase may have evolved to permit cells to function with reduced dNTP and replication protein synthetic capacity. Thirdly, checkpoint-suppressible late-firing origins may have evolved to help cells slow passage through S phase when DNA is damaged (Shirahige et al., 1998) or to help minimize the number of active replication forks when cells are starved for dNTPs (Santocanale and Diffley, 1998).
In humans, breakdown of replication timing control correlates with susceptibility to cancer. For example, the apparently normal lymphocytes of patients suffering from renal cell carcinoma no longer replicate corresponding regions of homologous chromosomes at the same time during S phase (Dotan et al., 2000). Whether loss of replication timing control contributes to or is a consequence of the genomic instability that is necessary for the rapid evolution of cancer cells remains to be determined.
Despite the potential importance of replication timing control, we know very little about its mechanism. The fission yeast, Schizosaccharomyces pombe, has the potential to be an especially useful organism for learning more about replication timing. Its replication origins are better defined than those of any other eukaryotic organism except Saccharomyces cerevisiae, and in terms of size and complexity these origins resemble the origins of multicellular eukaryotes to a greater extent than do those of S.cerevisiae (Dubey et al., 1994; Kim and Huberman, 1998; Altman and Fanning, 2001; Ina et al., 2001; Kim et al., 2001, Lu et al., 2001). Schizosaccharomyces pombe offers the same genetic advantages as does S.cerevisiae, and it has already proved to be an exceptionally useful model organism for the study of the eukaryotic cell cycle and cell cycle checkpoints (Rhind and Russell, 2000).
In S.pombe, potential replication origins can be identified as autonomously replicating sequence (ARS) elements, which are capable of serving as replication origins in plasmids. However, most S.pombe ARS elements do not fire efficiently in their normal chromosomal locations (Dubey et al., 1994; Wohlgemuth et al., 1994; Smith et al., 1995). This is probably a consequence of the fact that many ARS elements occur in clusters, and the individual ARS elements within each cluster interfere with each other (Dubey et al., 1994).
Here we have compared the replication timings of several previously characterized S.pombe ARS elements. We also studied the replication timing of telomeres, which were not previously known to contain ARS elements. We found that each tested S.pombe ARS element replicated at a reproducible time during S phase. Under conditions of dNTP starvation, the distinction between early and late ARS elements depended on the checkpoint proteins, Rad3 and Cds1, which are homologous to the S.cerevisiae checkpoint proteins Mec1 and Rad53 and to the vertebrate proteins ATR (also ATM) and CHK2/CDS1, respectively. These results suggest that replication origin timing in S.pombe is similar to that in other eukaryotic organisms and that further study of replication origin timing in this yeast has the potential to contribute significantly to our understanding of the mechanism and importance of replication origin timing in all eukaryotic organisms.
Results
Replication timing by centrifugal elutriation
Determining which ARS elements are early- or late-replicating requires study of synchronized cell populations. To ensure that our results would not be an artifactual consequence of the synchronization method, we synchronized cells in three different ways. First we used centrifugal elutriation, which does not perturb cells by arresting them in a particular cell cycle stage (Walker, 1999). From an asynchronous culture of growing cells, the smallest cells in the population were selected by centrifugal elutriation and then allowed to continue growing. Their growth was monitored by microscopy. At the time of selection, the smallest cells had single nuclei and were in early G2 phase (Figure 1A). With the passage of time, the cells grew in length, and their nuclei divided by mitosis to generate binucleate cells in G1 phase (Figure 1A). During S phase a septum formed (Figure 1A and B), and shortly thereafter cytokinesis occurred, producing a new generation of small cells in early G2 phase (Figure 1A).

Fig. 1. Synchronization of S.pombe cells by centrifugal elutriation. (A) Diagram illustrating changes in number of nuclei per cell and in cell size during the cell cycle. (B) Percentage of cells with a septum at various times after elutriation. (C–E) Frequencies of various DNA contents per nucleus, determined by quantitative microscopy of Sytox Green fluorescence, in uninucleate and binucleate cells at 90, 150 and 180 min after elutriation. Note that the scale of fluorescence intensity is not linearly proportional to DNA content; the G2 peak occurs at less than twice the intensity of the G1 peak.
Determining the exact position of S phase and progress through S phase in fission yeast cells is difficult by standard flow cytometric (FACS) analysis, because cytokinesis takes place during or just after S phase. Consequently, the S phase population is a mixture of uninucleate and binucleate cells, with DNA contents per cell ranging from 1N to 4N. This broad distribution is superimposed on the narrower but much larger distribution of 2N cells, consisting of uninucleate G2 cells and binucleate G1 cells. To overcome this problem, we used quantitative fluorescence microscopy to measure the DNA content of individual nuclei. At 90 min after elutriation (Figure 1C), most cells were still uninucleate and thus still in G2, with DNA contents per nucleus higher than those of the nuclei in binucleate cells, which were mostly in G1 phase. The frequency profile of DNA content per nucleus for binucleate cells showed a skew toward higher DNA contents (Figure 1C), indicating that some binucleate cells had advanced into S phase. These were mostly in early S. At 150 min after elutriation (Figure 1D), most cells had become binucleate, and most of these were in S phase. Cells in middle S phase were most abundant, but cells in early and late S phase were also frequent. By 180 min after elutriation, many cells had again become uninucleate with G2 DNA contents, but a substantial portion of cells remained binucleate. Enrichment for late S phase cells was evident, but a substantial portion of early S phase cells was also present.
We isolated DNA from the 90 min population (early S phase; Figure 1B and C) and from the 180 min population (later S phase; Figure 1B and E), digested it with HindIII and then used two-dimensional (2D) agarose gel electrophoresis (Brewer and Fangman, 1987) to evaluate the relative replication frequencies of two HindIII restriction fragments containing or flanking previously characterized ARS elements, ars2-1 (Wohlgemuth et al., 1994) and ars727 (Maundrell et al., 1988).
When we hybridized the membrane blot of the 2D gel with the 6.2 kb HindIII fragment containing ars2-1, approximately equal signals from replication intermediates (RIs) were detected in the DNA samples from early and later S phase (Figure 2A). In both cases, the major signal (black area in lower right corner) is from the intact linear, non-replicating restriction fragment, which derives from the vast majority of cells in the population that were not engaged in replicating this restriction fragment at the time of DNA isolation. The RIs from cells that were replicating this fragment form two arcs, which are clearly visible in the early S sample. The lower ‘Y’ arc is generated by Y-shaped RIs resulting from single replication forks that move through the restriction fragment from one end to the other. The upper ‘bubble’ arc is produced by restriction fragments containing an internal bubble-like replicated region, with two diverging replication forks. These are generated when an origin fires near the middle of the restriction fragment. Note that the upper portion of the bubble arc in the later S phase sample is weak in this case due to a problem in transferring DNA to the membrane (Figure 2A). The presence of RIs in both the early and later S samples (Figure 2A) is consistent with the possibility that ars2-1 replicates only in early S, since the later S sample contains a substantial portion of contaminating early S cells (Figure 1E).

Fig. 2. 2D gel analyses of replication intermediates (RIs) from three regions of the S.pombe genome in cdc10-M17 cells synchronized to early S or later S phase by centrifugal elutriation. In each diagram, the white boxes represent the sequences of interest and the black bars represent the hybridization probes utilized. (A) ars2-1 is replicated both actively (bubble arc) and passively (Y arc) in both the early S (90 min after elutriation; Figure 1C) and later S (180 min after elutriation; Figure 1E) samples. The 6.2 kb genomic HindIII fragment was detected by a 5 kb HindIII–PstI probe. (B) ars727 is located in S.pombe cosmid c3B8 on chromosome II (DDBJ/EMBL/GenBank accession number AL022244). The probe detects both a 572 bp fragment and a 4.9 kb fragment. Only the latter is seen in the autoradiograms. In (C), several telomeric HindIII restriction fragments of 5–6 kb are detected by the telomere probe, which corresponds to the 800 bp of telomere-associated sequence in the plasmid pEN42 (Nimmo et al., 1994). The white box represents telomere-associated sequences and the grey box represents telomeric simple repeat sequences. The location of the HindIII sites with respect to the telomeres varies from telomere to telomere and strain to strain. The faint signal seen in early S phase has the shape expected for a ‘double-Y’ line (Brewer and Fangman, 1987), but alternative explanations are not excluded. See the text for additional details.
In contrast to the similarity of signals from the two DNA samples with the ars2-1 probe, when ars727 or telomere-specific (Nimmo et al., 1994) hybridization probes were used, the two samples gave different results (Figure 2B and C). The ars727 probe was capable of detecting two HindIII fragments, but only results from the larger fragment are shown. The signal from ars727 RIs in the early S sample was very weak, but it was reasonably strong in the later S sample (Figure 2B). As expected from the position of the ars727 ARS element at the end of the studied restriction fragment, only an arc of Y-shaped RIs is visible.
Even though we did not know if S.pombe telomeres contain replication origins, we wanted to find out whether they replicate in late S phase, as they do in S.cerevisiae (Ferguson et al., 1991; Stevenson and Gottschling, 1999). For this purpose, we used a hybridization probe (black bar in Figure 2C) that detects 800 bp of telomere-associated sequence immediately adjacent to the simple telomere repeat sequences (grey box in Figure 2C; Nimmo et al., 1994). We detected Y arc signals from one or more telomeric HindIII restriction fragments in the later S phase sample but not in the early S phase sample (Figure 2C), suggesting that S.pombe telomeres, like those of S.cerevisiae, are late-replicating. However, the early S phase sample displayed a faint diagonal line, which may indicate the occasional presence of converging replication forks (double Ys; Brewer and Fangman, 1987) or of some other non-linear structure within one or more of the telomeric HindIII fragments, even in early S phase.
The fact that RIs from ars727 and telomeres were more abundant in the later S than early S samples suggests that these sequences replicate in late S phase. To confirm the late replication of ars727 and telomeres, and the early replication of ars2-1, we employed alternative cell synchronization procedures that were capable of providing a higher resolution than the centrifugal elutriation method.
Replication timing by cdc10-M17 block and release
The Cdc10 transcription factor is required in G1 phase for the transcription of several genes (including cdc18, cdc22 and cdt1) whose protein products are required for the initiation of DNA replication (reviewed in Tanaka and Okayama, 2000). Cells bearing the temperature-sensitive cdc10-M17 mutation accumulate in G1 when held at the restrictive temperature (37°C). When the cells are returned to the permissive temperature (25°C), the Cdc10 protein regains function, and the cells synchronously complete G1 phase, then enter and complete S phase (Verkade and O’Connell, 1998). The flow cytometry (FACS) data in Figure 3 show that the peaks of the population DNA content profiles move from the 1N position at 0 min to the 2N position after 100 min, and most of the population is in S phase between 40 min and 100 min after a return to permissive temperature. The positions of the FACS peaks as a function of time are shown as a graph in Figure 4D, using the data from Figure 3 and additional data from intermediate time points.
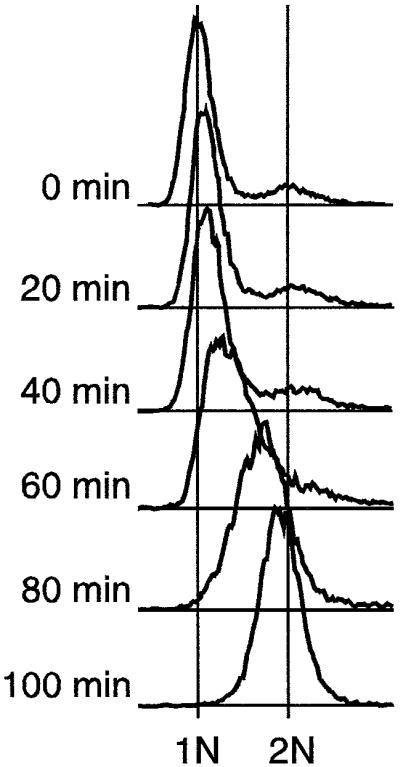
Fig. 3. FACS characterization of the cdc10-M17 strain synchronized by temperature block and release. Cells were incubated at 37°C for 4.5 h, then spun down and resuspended in fresh medium at 25°C. FACS profiles at various times after shift to 25°C are shown. See the main text and Materials and methods for additional details.

Fig. 4. 2D gel analyses of various ARS elements in cdc10-M17 cells synchronized by temperature block and release. (A) ars2-1 replicates in early and middle S phase. In some autoradiograms the RIs are obscured by background noise. (B) The K-repeat ARS replicates in early S phase. The diagram of cen2 sequences is based on Smith et al. (1995). Each type of box represents a different type of repeat sequence. (C) The rDNA ARS also replicates in early S phase. The diagram is based on Sanchez et al. (1998). (D) Diagram showing the position of the FACS peak (as in Figure 3) as a function of time after release. The diagram is spread out so that the times correspond to those of the autoradiograms above.
To test the time of replication of individual ARS elements in a cdc10-M17 cell population after release from the temperature block, we isolated DNA from the same cells used for FACS analysis (Figures 3 and 4D), digested the DNA with HindIII and KpnI or with EcoRI, and used 2D gel electrophoresis to monitor the abundance of RIs from ARS-element-containing restriction fragments. The membranes from blotting the 2D gels were sequentially hybridized with the probes indicated by the black bars in Figure 4A to C.
The results in Figure 4A show that RIs from ars2-1 become detectable in early S phase (40 min post release) and appear to reach maximum abundance in mid S phase (70 min), consistent with the results obtained by centrifugal elutriation (Figure 2A). Stronger signals from RIs were obtained when the same membranes were re-hybridized with probes corresponding to repeated sequences. The results in Figure 4B indicate that RIs from the ARS element within the ‘K’ repeats of fission yeast centromere flanking regions (Smith et al., 1995) are most abundant in very early S phase (40–60 min). Note that cen2 is shown as an example in the diagram (Figure 4B), but K repeats are also found flanking the centromeres on the other chromosomes (Clarke, 1998).
RIs from the restriction fragment containing the rDNA ARS element (Kim and Huberman, 1998; Sanchez et al., 1998) are also most abundant in early S phase (50–60 min; Figure 4C). In this case, a prominent vertical line is visible connecting the left ends of the bubble and Y arcs. Two types of X-shaped molecules can contribute to this line: recombination intermediates and replication termination intermediates (Brewer et al., 1988; Zhu et al., 1992). It seems likely that the X line in Figure 4C is due primarily to replication termination intermediates, since the strength of the X line signal varies in parallel with the bubble and Y-arc signals (Figure 4C), and since replication termination takes place throughout the rDNA repeat (Sanchez et al., 1998).
We have found two previously characterized ARS elements that, according to this cdc10-M17 synchronization procedure, replicate in late S phase. Both the 4 kb HindIII restriction fragment containing ars2-2 (Wohlgemuth et al., 1994) and ars727 generate Y-arc RIs that are most abundant in late S phase (80–90 min post release; Figure 5A and B). The results for ars727 in Figure 5B are consistent with those obtained by centrifugal elutriation (Figure 2A). Under the conditions employed in Figure 5, neither ars2-2 nor ars727 generates a detectable bubble arc. This is probably a consequence of their being passively replicated by forks from nearby ARS elements (Dubey et al., 1994; Santocanale and Diffley, 1998; Vujcic et al., 1999).

Fig. 5. 2D gel analyses of late-replicating regions in cdc10-M17 cells synchronized by temperature block and release. (A) Isolated DNA was digested with HindIII, subjected to 2D gel electrophoresis and then probed with ars2-2. (B) EcoRI-digested DNA was subjected to 2D gel electrophoresis and then probed with ars727. (C) DNA samples digested with EcoRI or with HindIII were probed with the 800 bp telomere probe.
With both EcoRI and HindIII digests, the telomere probe detected overlapping Y arcs from two to three similarly sized restriction fragments. These Y arcs were most abundant in very late S phase (80–100 min after release; Figure 5C). However, diagonal lines resembling the diagonal line in the early S phase centrifugal elutriation sample (Figure 2C) were also evident in early S phase in both digests (Figure 5C). The fact that Y arc signals are detected only in late S phase (Figure 5C) is consistent with the centrifugal elutriation results (Figure 2C), and indicates that telomeres are replicated in late S phase.
Replication timing by hydroxyurea block and release
Hydroxyurea (HU) is an inhibitor of the enzyme ribonucleoside diphosphate reductase. In the presence of sufficient HU, cells cannot manufacture deoxyribonucleoside triphosphates (dNTPs) and hence can synthesize DNA only until their pre-existing dNTP pools (which are usually small) have been exhausted. When S.cerevisiae cells enter S phase in the presence of HU, they synthesize a small amount of DNA at their early-firing replication origins, but initiation at late-firing origins is suppressed (Santocanale and Diffley, 1998). We suspected that HU treatment might similarly be capable of distinguishing early-replicating from late-replicating ARS elements in S.pombe.
To test this possibility, we studied the abundance of RIs at various time points during an HU block and release experiment. We found that when cdc10-M17 cells are exposed to 12 mM HU at permissive temperature (25°C), they accumulate with a DNA content near 1N (Figure 6, 0 min). When HU is removed and incubation is continued at 25°C, DNA content rapidly increases for 40 min and then levels off near 2N (Figure 6). Plotting the peak positions of the FACS profiles as a function of time suggests that S phase is mostly complete by 40 min after release, but may extend until 70 min in some cells (Figure 7E).
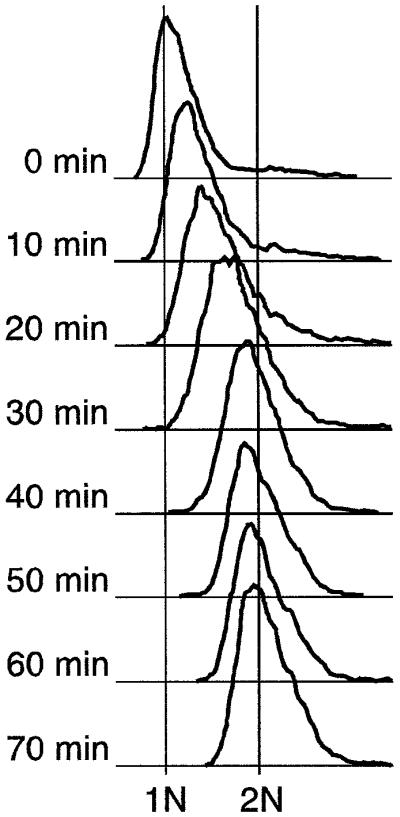
Fig. 6. FACS characterization of the cdc10-M17 strain synchronized by hydroxyurea block and release at 25°C. Cells were incubated in 12 mM HU for 5 h, then washed and resuspended in fresh medium lacking HU. FACS profiles at various times after removal of HU are shown. See the main text and Materials and methods for additional details.

Fig. 7. 2D gel analyses of early- and late-replicating regions in cdc10-M17 cells synchronized by HU block and release at 25°C. DNA samples were taken at the indicated times, digested with HindIII, and subjected to 2D gel analysis. (A) RIs accumulate near the K-repeat ARS during the HU block. (B–D) RIs accumulate near ars2-2, ars727 and telomeres after the HU block. (E) Diagram showing the position of the FACS peak (as in Figure 6) as a function of time after removal of HU.
We found that, as in S.cerevisiae, early-replicating ARS elements accumulate RIs during the HU block (see the example of the K-repeat ARS; Figure 7A). Note that the K-repeat RIs disappear due to replication fork run-off after the HU is removed (Figure 7A, 10–40 min). Also as in S.cerevisiae, late-replicating ARS elements and telomeres accumulate few or no RIs during HU treatment (Figure 7B–D). Instead, RIs accumulate (and then disappear due to fork run-off) after HU removal.
In this experiment, the ars2-2 probe detected two Y arcs and a bubble arc. The second Y arc, which is also faintly visible in Figure 5A, is presumably due to cross-hybridization to another restriction fragment with a related sequence. The source of the bubble arc is not clear. It may be due to initiation by ars2-2 under these conditions, or it may be due to initiation within the restriction fragment that produced the second Y arc. In either case, the fact that the bubble arc is evident only after HU removal shows that the firing of this particular origin was suppressed during HU treatment and permitted only after HU removal.
Under these conditions, ars727 appeared to be passively replicated over a prolonged time period (10–50 min) after HU removal (Figure 7C). Telomere sequences also replicated late under these conditions (Figure 7D). Y arcs were readily detectable over a time span (20–60 min after HU removal) about 10 min later than for ars727.
The HU block and release experiment in Figures 6 and 7 was done with the same cdc10-M17 strain used for the cdc10 block and release experiments (Figures 3–5) and was therefore carried out at the permissive temperature (25°C). To find out whether similar results would be obtained in other strains at higher temperatures, we applied the HU block and release protocol to a non-temperature-sensitive strain at 30°C (the optimum temperature for growth of wild-type fission yeast strains). As shown in Figure 8, the HU block and release protocol at 30°C produced results that were, indeed, similar to those obtained at 25°C (Figure 7). In both cases, the K repeat ARS was replicated in the presence of HU but telomere sequences were not. In both cases, K-repeat RIs disappeared after HU removal, while telomeric RIs appeared and then disappeared after HU removal. At 30°C, synchronization was sharper, and RIs disappeared more rapidly than at 25°C. Also at 30°C, the telomere probe detected a bubble arc along with the usual Y arcs, indicating that at least one S.pombe telomere contains a potential replication origin, which under the conditions of Figure 8 fires in late S phase about 30 min after HU removal.

Fig. 8. 2D gel analyses of early- and late-replicating regions synchronized by HU block and release at 30°C. A non-temperature-sensitive strain was employed (ura4-D18 leu1-32 ade6-704 h–). DNA samples were taken at the indicated times, digested with HindIII, and subjected to 2D gel analysis. (A) RIs accumulate near the K-repeat ARS during the HU block. (B) RIs accumulate near telomeres 20–30 min after the HU block. (C) Diagram showing the position of the FACS peak as a function of time after removal of HU.
Thus the results of the HU block and release protocol are consistent with the replication timings determined by centrifugal elutriation and cdc10-M17 temperature block and release. These results are also consistent with the earlier observation that the firing of late origins is suppressed by HU in budding yeast (Santocanale and Diffley, 1998).
The replication times of additional fission yeast ARS elements
During the course of this study we have determined the times of replication of many S.pombe ARS elements (Figures 2, 4, 5, 7 and 8, and data not shown). Surprisingly, we have found that most of the tested ARS elements replicate in early S phase. Early-replicating ARS elements include ars2-1, the ribosomal DNA ARS (ars3001), the cluster of ARS elements near the ura4 gene (ars3002, ars3003 and ars3004; Dubey et al., 1994; Kim and Huberman, 1999), ars745 and ars766 (Maundrell et al., 1988), the K-repeat ARS, and ARS elements located upstream of certain genes (c27, rep1, rum1, nmt1, tug1 and pcr1; Gomez and Antequera, 1999). The only late-replicating ARS elements that we have detected so far are ars2-2 and ars727. Neither of these is normally active in its chromosomal location (Figures 2, 5 and 7). However, one or more of the chromosomal telomeres contains a potential origin that is capable of firing in late S phase under some circumstances (Figure 8).
Effect of deleting checkpoint kinase genes on replication in HU
Because the suppression of late origin firing by HU in budding yeast depends on the checkpoint kinases Mec1 and Rad53 (Santocanale and Diffley, 1998), we asked whether deleting the genes encoding the corresponding fission yeast kinases, Rad3 and Cds1, would affect the sequence of ARS element replication in HU-treated fission yeast cells. For this experiment, asynchronous cultures of wild-type, cds1Δ and rad3Δ cells were treated for 1.5, 3.0 or 4.5 h at 30°C with a concentration of HU that permitted very slow entry into S phase (Figure 9). After 1.5 h exposure to HU, more than half the cells in each strain were transiently arrested with a 1N DNA content. After 3 h, most cells were in very early S phase. After 4.5 h, most cells were in mid-S phase (wild-type) or early S phase (cds1Δ and rad3Δ). DNA was isolated from each time point, digested with HindIII, and subjected to 2D agarose gel electrophoresis. After electrophoresis, the DNA was transferred to a membrane and hybridized sequentially with probes corresponding to the K-repeat ARS, ars2-1, ars2-2, and telomere sequences (Figure 9).

Fig. 9. Effects of the rad3Δ and cds1Δ mutations on accumulation of RIs when replication is slowed by HU treatment. Log phase wild-type (wt; 972 h–), cds1Δ and rad3Δ strains were incubated with 12 mM HU for the indicated times at 30°C. For an unknown reason, in this experiment, 12 mM HU failed to completely block DNA synthesis, as indicated by the rightward movement of the FACS peaks (especially obvious at 4.5 h). The 0 h FACS peaks show the profiles for the log phase cells. In our experience, the 2N position for log phase cells is usually slightly to the left of the 2N position for synchronized cells, as in this case. Aliquots of the cell cultures were taken at the indicated times and DNA was purified, then digested with HindIII, for 2D gel analyses.
Under these circumstances of slow progression into S phase, the wild-type cells preserved normal relative replication timing (Figure 9). RIs accumulated at the early K-repeat ARS at 1.5 h but then disappeared due to fork runoff at 3 and 4.5 h. RIs from ars2-1 accumulated at 1.5 and 3 h, consistent with earlier results (Figures 2 and 4), indicating that ars2-1 replicates in early mid-S phase. RIs from ars2-2 were abundant at 3 and 4.5 h, consistent with earlier results (Figures 5 and 7), showing that ars2-2 replicates in late mid-S phase. Few if any RIs appeared at telomeric sequences even after 4.5 h in HU, consistent with earlier results showing that telomeres replicate in late S phase (Figures 5, 7 and 8) and with the FACS analyses indicating that most cells had not reached late S phase by 4.5 h (Figure 9).
In contrast, replication timing was altered in the cds1Δ and rad3Δ cells (Figure 9). At 1.5 h, RIs from the K repeats were as abundant as in the wild type, but the number of RIs from ars2-1, ars2-2 and telomeres was significantly greater than in wild-type cells. At 3 h, RIs from all of the tested regions were approximately equally abundant (much more abundant than in wild-type cells), regardless of their normal replication timing. At 4.5 h, the number of RIs from all regions was reduced, presumably due to replication fork runoff. The loss of RIs from the K repeats was most pronounced.
These results suggest that in the HU-treated cds1Δ and rad3Δ cells, early ARS elements replicated at the beginning of S phase as in the wild-type cells, but normally late ARS elements replicated shortly thereafter (by the 3 h time point). Comparison of the FACS profiles at 3 and 4.5 h shows that progression through S phase was slower in the mutant cells than in wild-type cells, despite precocious replication of late ARS elements in the mutant cells. Both this observation, and the greater abundance of RIs in mutant cells than in wild type cells at 3 and 4.5 h, suggest that replication forks in HU-treated mutant cells move more slowly than in HU-treated wild-type cells. This slow fork movement may be a consequence of recombination, termination and/or altered fork structures interfering with replication. In the cases of the K-repeat ARS and ars2-2, the mutant cells showed enhanced signals from putative recombination or termination intermediates (indicated by the ‘X’ line signals; Figure 9). In the cases of ars2-1 and telomeres, strong signals resembling those generated by converging replication forks (double-Y structures; Brewer and Fangman, 1987), were produced at 3 and 4.5 h (Figure 9).
Discussion
Regulation of replication timing in fission yeast resembles that in other eukaryotic organisms
The results described in this manuscript reveal that the fission yeast, S.pombe, is similar to other eukaryotic organisms in its regulation of replication timing. Different regions of the S.pombe genome replicate at characteristic times during S phase, and these characteristic replication times are independent of the method of cell cycle synchronization. Blocking replication forks leads to the selective inhibition of replication of normally late-replicating genomic regions as in budding yeast (Santocanale and Diffley, 1998; Shirahige et al., 1998) and vertebrates (Dimitrova and Gilbert, 2000).
Three independent synchronization protocols yield similar results
A striking feature of our results is the consistency of replication timings determined by our three independent synchronization methods. For example, regardless of synchronization method we found that (where tested) the K-repeat ARS replicates before ars2-1, which replicates before ars2-2, which replicates before ars727, which replicates before telomeres. This consistency of results does not mean, however, that the three synchronization methods are interchangeable. Each has its advantages and disadvantages.
In addition to its minimal disturbance of the cell cycle (Walker, 1999), centrifugal elutriation offers the advantage that it can be carried out with any strain. However, it is the most difficult of the protocols to carry out, only partial S-phase synchrony can be achieved (Figure 1), and cell yields are limited by the size of the elutriation chamber. In our hands it was possible to obtain from a single run only sufficient cells for 2D gel analyses at two time points (Figures 1 and 2).
The cdc10-M17 synchronization protocol was simpler, the yield of cells with standard laboratory equipment was much higher, and synchrony was better than with centrifugal elutriation (Figures 3–5). However, any temperature block and release protocol can lead to cell cycle artifacts (Creanor et al., 1983), and S phase abnormalities have been detected by others using a similar cdc10 synchronization protocol (Edwards et al., 1999). Another disadvantage is that testing the effect of any particular gene mutation on replication timing using this protocol requires a crossing of the mutation of interest into the cdc10-M17 background.
The HU synchronization method proved to be even less laborious than the cdc10 protocol, synchrony after release from the HU block was excellent (Figures 6–8), and the HU protocol can be used directly with mutant strains. On the other hand, replication fork abnormalities may be introduced during HU treatment in checkpoint-deficient strains (Figure 9; Desany et al., 1998; Lopes et al., 2001), and it is not clear that the pattern of origin firing after release from the HU block is normal. We found two cases after HU release in which origins may have fired (ars2-2, Figure 7B; and telomeres, Figure 8B), even though the same origins were not detectably active with the cdc10 (Figure 5) or centrifugal elutriation (Figure 2C and data not shown) protocols. Despite these changes in origin firing frequency, the order in which the tested ARS elements were replicated after release from the HU block proved identical to the order in which these ARS elements were replicated after release from the cdc10 block (Figures 5 and 7).
Apparent paucity of late-replicating ARS elements
Of the 16 ARS elements that we tested, 14 proved to replicate in early S phase, and most of these were sufficiently active as chromosomal origins to produce detectable bubble arc signals. In contrast, only two ARS elements (ars2-2 and ars727) replicated in late S phase, and neither of these produced a detectable bubble arc in cells synchronized by centrifugal elutriation or temperature block and release. In some HU block and release experiments, bubble arc signals were detected in late S phase with a telomere probe, indicating that there is a potential late-firing origin near at least one of the telomeres. In one HU block and release experiment, ars2-2 or an origin with similar sequence also fired in late S, after removal of HU. We have also found that plasmids containing ars2-2 or ars727 as their only ARS element replicate in mid-late (ars2-2) or late (ars727) S phase (C.Yompakdee and J.A.Huberman, unpublished). Thus, active firing of origins in late S phase is possible in S.pombe, and our failure to detect as many late-firing as early-firing origins may be simply a consequence of the small number of potential origins that we have studied. These results also suggest that the failure of chromosomal ars2-2 and ars727 to generate detectable bubble arc signals may be a consequence of their being located near other chromosomal origins that fire somewhat earlier in S phase, with the consequence that ars2-2 and ars727 are usually passively replicated by forks from the earlier origins before they have a chance to fire on their own.
The checkpoint kinases, Rad3 and Cds1, are required for suppressing the replication of late ARS elements in the presence of HU
In the presence of HU, replication forks can move only a few kb away from their origins (Santocanale and Diffley, 1998; Santocanale et al., 1999; Lopes et al., 2001). Therefore, the origins responsible for generating the Y arcs at ars2-2 and telomeres in checkpoint mutant cells (Figure 9) must be located close to ars2-2 and telomeres, respectively. In the absence of HU, ars2-2 and telomeres replicate in mid-late S phase and late S phase, respectively (Figure 5). Consequently, the nearby origins responsible for replicating them probably fire in mid-late and late S phase as well. In wild-type cells in the presence of HU, only a few RIs are generated at ars2-2 and none at telomeres (Figures 7 and 9), but in rad3Δ and cds1Δ cells abundant RIs are produced at both ars2-2 and telomeres, despite their normally late replication (Figure 9). These observations suggest that the origins responsible for replicating ars2-2 and telomeres are suppressed in the presence of HU by a Cds1- and Rad3-dependent mechanism. This conclusion is consistent with the observation of Santocanale and Diffley (1998) that suppression of late-firing origins in HU-treated budding yeast cells requires Mec1 and Rad53 (homologues of Rad3 and Cds1, respectively).
Replication forks may be damaged when cds1Δ and rad3Δ mutants are treated with HU
We noticed that, when cds1Δ and rad3Δ cells were exposed to HU at a concentration that permitted very slow DNA synthesis, the mutant cells progressed through S phase more slowly than wild-type cells, and they accumulated more RIs than wild-type cells (Figure 9). Both observations are consistent with the finding that S.cerevisiae rad53 mutant cells resume DNA synthesis more slowly than wild-type cells after transient exposure to HU (Desany et al., 1998; Lopes et al., 2001).
There are several possible explanations for the slower passage through S phase of HU-treated checkpoint mutant cells. Replication forks may move more slowly, or they may be damaged and thus incapable of moving until they are repaired. Altered DNA structures, such as recombination intermediates or unresolved termination intermediates, may interfere with replication fork movement. The results in Figure 9 provide evidence for the presence of altered DNA structures in HU-treated checkpoint mutant cells. Stronger X-line signals, suggestive of recombination or termination intermediates, were evident for ars2-2 and the K-repeat ARS, and diagonal lines similar to the ‘double-Y’ lines produced by converging replication forks (Brewer and Fangman, 1987) were formed at ars2-1 and at telomeres. Further experiments are required to determine whether these structures represent true recombination or termination intermediates or some other type of non-linear DNA structure.
Interestingly, neither X lines nor double-Y lines were detected after HU treatment of rad53 and mec1 mutant S.cerevisiae cells (Santocanale et al., 1999; Lopes et al., 2001). In the case of one particular early-firing S.cerevisiae replication origin (ARS305), HU-treated rad53 mutant cells produced increased signals from the early portion of the Y arc and from a diffuse triangular area (‘cone-shaped signal’) adjacent to the late portion of the Y arc (Lopes et al., 2001). Similar enrichment for the early portion of the Y arc (and possibly for a cone-shaped signal) is evident in our results for ars2-1 and telomeres but not for K repeats or ars2-2 (Figure 9). Thus the nature of the HU-induced altered DNA structures produced in checkpoint mutants appears to depend on the genomic region being investigated. Perhaps a greater variety of altered structures will also become evident in S.cerevisiae when additional genomic regions are examined. Characterization of these altered DNA structures and of the mechanisms that produce them, in both species, is a task remaining for the future.
Materials and methods
Strains and growth conditions
The S.pombe strains used were 972 h- (Moreno et al., 1991), cdc10-M17 ade6-704 leu1-32 ura4-D18 h– (Verkade and O’Connell, 1998), ura4-D18 leu1-32 ade6-704 h– (Murray et al., 1992), rad3::ura4 ura4-D18 leu1-32 ade6-704 h– (Al-Khodairy et al., 1994) and cds1::ura4 ura4-D18 leu1-32 ade6-704 h– (Murakami and Okayama, 1995). Cells were grown in YES (Moreno et al., 1991) at 25 or 30°C to a density of 5–8 × 10⁶ cells/ml.
Sample preparation for FACS analysis
At each time point, 450 µl of cell culture (0.5–1.2 × 10⁷ cells/ml) were taken and mixed with 1050 µl of 99% ethanol. The fixed cells were kept at 4°C, if necessary. The fixed cells (500–750 µl) were spun down and washed once with 1 ml of 50 mM sodium citrate. Cell pellets were mixed with 500 µl of 50 mM sodium citrate containing RNase A (50 µg/ml, Sigma) and incubated at 37°C for 2 h to overnight. After addition of 500 µl of 50 mM sodium citrate containing Sytox Green (2 µM, Molecular Probes), the samples were briefly sonicated and analyzed by FACS.
Synchronization by temperature block
Cells (cdc10-M17) were grown at 25°C to 5 × 10⁶ cells/ml in YES, then transferred to 37°C and incubated for 4.5 h (cell numbers typically double and cells become elongated). Then cells were shifted to 25°C by spinning and resuspending in pre-equilibrated (25°C) medium. At 10 min intervals, 200 ml were collected for 2D gel and FACS analysis.
Synchronization by HU treatment
Cells in log phase (5–8 × 10⁶ cells/ml) were spun down and resuspended in fresh, prewarmed (25 or 30°C, as indicated) YES containing 12 mM hydroxyurea (USB). Incubation was continued at 25°C for 3 h (30°C) or 5 h (25°C) with HU. Then cells were washed twice with prewarmed (25 or 30°C) water, resuspended in fresh YES (25 or 30°C) and further incubated at 25 or 30°C. At 10 min intervals, 200 ml were collected for 2D gel and FACS analysis.
Synchronization by centrifugal elutriation
Two liters of cells (cdc10-M17; 8 × 10⁶ cells/ml in YES at 25°C) were harvested and resuspended in 500 ml EMMS (Moreno et al., 1991) at 25°C. The culture was pumped into a 40 ml elutriation chamber at about 40 ml/min at a rotor speed of 2000 r.p.m. The loaded cells were washed with 400 ml of EMMS, then ∼250 ml of the cells were eluted at 65 ml/min. The yield was about 0.8% of the total cells. Cells were spun down at 25°C, then resuspended in 400 ml YES and further incubated at 25°C. To check synchronization efficiency, 500 µl of the culture were fixed every 15 min after elutriation and examined for septation index after staining with Calcofluor (Sigma). The DNA contents of individual nuclei in uninucleate and binucleate cells were measured by quantitative microscopy of Sytox Green fluorescence according to the detailed procedure available at http://www.roswellpark.org/cmb/huberman/Quant_Flu_Microscopy/Quant_Flu_Micro.html. One hundred and ninety milliliters of the 90 min (early S phase) and 180 min (later S phase) cultures were harvested for 2D gel analysis.
Genomic DNA preparation and 2D gel analysis
For each time point, 200 ml cells (8–10 × 106 cells/ml) were used. In general, previously described procedures for DNA preparation (Huberman et al., 1987) and for neutral-neutral 2D gel electrophoresis (Brewer and Fangman, 1987) were employed, except that volumes were reduced, to permit processing larger numbers of smaller samples in parallel, and enrichment of RIs by BND–cellulose chromatography (Huberman et al., 1987) was omitted. Sufficient enrichment was provided by cell synchronization. A detailed description of the DNA purification and 2D gel procedures used in these experiments can be found at http://www.roswellpark.org/cmb/huberman/Multi2Dgels.html. The 2D gel autoradiograms were captured as 16 bit TIFF files using a Molecular Dynamics PhosphorImager. The images were subsequently adjusted, by choice of upper and lower limits (essentially the same as adjusting exposures in conventional photography), so that for each time series the signal intensities for the 1N spots were the same for each time point.
Acknowledgments
Acknowledgements
This publication would not have been possible without important contributions from Amy Piwowar, who collected and analyzed the quantitative fluorescence microscopy data (Figure 1), from Marius Poitelea, who assisted in development of the cdc10 synchronization protocol, from Deborah Mahoney, who initiated replication timing experiments in our laboratory and from Dharani Dubey, who helped characterize ars727, ars745 and ars766, and provided useful criticism of the manuscript. We are grateful to Michelle Calos, Louise Clarke, Elaine Nimmo, Robin Allshire and Francisco Antequera for plasmids. We thank Matthew O’Connell and Tony Carr for the cdc10-M17 strain, Tony Carr for the rad3Δ strain and Hiroshi Murakami and Hiroto Okayama for the cds1Δ strain. This research was supported by grants to J.A.H. from the National Institutes of Health (GM49294 and CA84302).
References
- Al-Khodairy F., Fotou,E., Sheldrick,K.S., Griffiths,D.J.F., Lehmann, A.R. and Carr,A.M. (1994) Identification and characterization of new elements involved in checkpoint and feedback controls in fission yeast. Mol. Biol. Cell, 5, 147–160. [DOI] [PMC free article] [PubMed] [Google Scholar]
- Altman A.L. and Fanning,E. (2001) The Chinese hamster dihydrofolate reductase replication origin β is active at multiple ectopic chromosomal locations and requires specific DNA sequence elements for activity. Mol. Cell. Biol., 21, 1098–1110. [DOI] [PMC free article] [PubMed] [Google Scholar]
- Brewer B.J. and Fangman,W.L. (1987) The localization of replication origins on ARS plasmids in S.cerevisiae. Cell, 51, 463–471. [DOI] [PubMed] [Google Scholar]
- Brewer B.J., Sena,E.P. and Fangman,W.L. (1988) Analysis of replication intermediates by two-dimensional agarose gel electrophoresis. Cancer Cells, 6, 229–234. [DOI] [PubMed] [Google Scholar]
- Calza R.E., Eckhardt,L.A., DelGiudice,T. and Schildkraut,C.L. (1984) Changes in gene position are accompanied by a change in time of replication. Cell, 36, 689–696. [DOI] [PubMed] [Google Scholar]
- Clarke L. (1998) Centromeres: proteins, protein complexes, and repeated domains at centromeres of simple eukaryotes. Curr. Opin. Genet. Dev., 8, 212–218. [DOI] [PubMed] [Google Scholar]
- Creanor J., Elliott,S.G., Bisset,Y.C. and Mitchison,J.M. (1983) Absence of step changes in activity of certain enzymes during the cell cycle of budding and fission yeasts in synchronous cultures. J. Cell Sci., 61, 339–349. [DOI] [PubMed] [Google Scholar]
- Desany B.A., Alcasabas,A.A., Bachant,J.B. and Elledge,S.J. (1998) Recovery from DNA replicational stress is the essential function of the S-phase checkpoint pathway. Genes Dev., 12, 2956–2970. [DOI] [PMC free article] [PubMed] [Google Scholar]
- Dhar V., Skoultchi,A.I. and Schildkraut,C.L. (1989) Activation and repression of a β-globin gene in cell hybrids is accompanied by a shift in its temporal replication. Mol. Cell. Biol., 9, 3524–3532. [DOI] [PMC free article] [PubMed] [Google Scholar]
- Dimitrova D.S. and Gilbert,D.M. (1999) The spatial position and replication timing of chromosomal domains are both established in early G1 phase. Mol. Cell, 4, 983–993. [DOI] [PubMed] [Google Scholar]
- Dimitrova D.S. and Gilbert,D.M. (2000) Temporally coordinated assembly and disassembly of replication factories in the absence of DNA synthesis. Nature Cell Biol., 2, 686–694. [DOI] [PMC free article] [PubMed] [Google Scholar]
- Dotan Z.A., Dotan,A., Litmanovitch,T., Ravia,Y., Oniashvili,N., Leibovitch,I., Ramon,J. and Avivi,L. (2000) Modification in the inherent mode of allelic replication in lymphocytes of patients suffering from renal cell carcinoma: a novel genetic alteration associated with malignancy. Genes Chromosomes Cancer, 27, 270–277. [PubMed] [Google Scholar]
- Dubey D.D., Zhu,J., Carlson,D.L., Sharma,K. and Huberman,J.A. (1994) Three ARS elements contribute to the ura4 replication origin in the fission yeast, Schizosaccharomyces pombe. EMBO J., 13, 3638–3647. [DOI] [PMC free article] [PubMed] [Google Scholar]
- Edwards R.J., Bentley,N.J. and Carr,A.M. (1999) A Rad3–Rad26 complex responds to DNA damage independently of other checkpoint proteins. Nature Cell Biol., 1, 393–398. [DOI] [PubMed] [Google Scholar]
- Fangman W.L. and Brewer,B.J. (1992) A question of time: Replication origins of eukaryotic chromosomes. Cell, 71, 363–366. [DOI] [PubMed] [Google Scholar]
- Ferguson B.M., Brewer,B.J., Reynolds,A.E. and Fangman,W.L. (1991) A yeast origin of replication is activated late in S phase. Cell, 65, 507–515. [DOI] [PubMed] [Google Scholar]
- Gomez M. and Antequera,F. (1999) Organization of DNA replication origins in the fission yeast genome. EMBO J., 18, 5683–5690. [DOI] [PMC free article] [PubMed] [Google Scholar]
- Heun P., Laroche,T., Raghuraman,M.K. and Gasser,S.M. (2001) The positioning and dynamics of origins of replication in the budding yeast nucleus. J. Cell Biol., 152, 385–400. [DOI] [PMC free article] [PubMed] [Google Scholar]
- Holmquist G.P. (1987) Role of replication time in the control of tissue-specific gene expression. Am. J. Hum. Genet., 40, 151–173. [PMC free article] [PubMed] [Google Scholar]
- Huberman J.A., Spotila,L.D., Nawotka,K.A., El-Assouli,S.M. and Davis,L.R. (1987) The in vivo replication origin of the yeast 2µm plasmid. Cell, 51, 473–481. [DOI] [PubMed] [Google Scholar]
- Ina S., Sasaki,T., Yokota,Y. and Shinomiya,T. (2001) A broad replication origin of Drosophila melanogaster, oriDα, consists of AT-rich multiple discrete initiation sites. Chromosoma, 109, 551–564. [DOI] [PubMed] [Google Scholar]
- Kim S.-M. and Huberman,J.A. (1998) Multiple orientation-dependent, synergistically interacting, similar domains in the ribosomal DNA replication origin of the fission yeast, Schizosaccharomyces pombe. Mol. Cell. Biol., 18, 7294–7303. [DOI] [PMC free article] [PubMed] [Google Scholar]
- Kim S.-M. and Huberman,J.A. (1999) Influence of a replication enhancer on the hierarchy of origin efficiencies within a cluster of DNA replication origins. J. Mol. Biol., 288, 867–882. [DOI] [PubMed] [Google Scholar]
- Kim S.-M., Zhang,D.-Y. and Huberman,J.A. (2001) Multiple redundant sequence elements within the fission yeast ura4 replication origin enhancer. BMC Mol. Biol., 2, 1. [DOI] [PMC free article] [PubMed] [Google Scholar]
- Lima-de-Faria A. and Jaworska,H. (1968) Late DNA synthesis in heterochromatin. Nature, 217, 138–142. [DOI] [PubMed] [Google Scholar]
- Lopes M., Cotta-Ramusino,C., Pelliciolli,A., Liberi,G., Plevani,P., Muzi-Falconi,M., Newlon,C.S. and Foiani,M. (2001) The DNA replication checkpoint response stabilizes stalled replication forks. Nature, 412, 557–561. [DOI] [PubMed] [Google Scholar]
- Loupart M.-L., Krause,S.A. and Heck,M.M.S. (2000) Aberrant replication timing induces defective chromosome condensation in Drosophila ORC2 mutants. Curr. Biol., 10, 1547–1556. [DOI] [PubMed] [Google Scholar]
- Lu L., Zhang,H. and Tower,J. (2001) Functionally distinct, sequence-specific replicator and origin elements are required for Drosophila chorion gene amplification. Genes Dev., 15, 134–146. [DOI] [PMC free article] [PubMed] [Google Scholar]
- Maundrell K., Hutchison,A. and Shall,S. (1988) Sequence analysis of ARS elements in fission yeast. EMBO J., 7, 2203–2209. [DOI] [PMC free article] [PubMed] [Google Scholar]
- Moreno S., Klar,A. and Nurse,P. (1991) Molecular genetic analysis of fission yeast Schizosaccharomyces pombe. Methods Enzymol., 194, 795–823. [DOI] [PubMed] [Google Scholar]
- Murakami H. and Okayama,H. (1995) A kinase from fission yeast responsible for blocking mitosis in S phase. Nature, 374, 817–819. [DOI] [PubMed] [Google Scholar]
- Murray J.M., Doe,C.L., Schenk,P., Carr,A.M., Lehmann,A.R. and Watts,F.Z. (1992) Cloning and characterization of the S.pombe rad15 gene, a homologue to the S.cerevisiae RAD3 and human ERCC2 genes. Nucleic Acids Res., 20, 2673–2678. [DOI] [PMC free article] [PubMed] [Google Scholar]
- Nimmo E.R., Cranston,G. and Allshire,R.C. (1994) Telomere-associated chromosome breakage in fission yeast results in variegated expression of adjacent genes. EMBO J., 13, 3801–3811. [DOI] [PMC free article] [PubMed] [Google Scholar]
- Raghuraman M.K., Brewer,B.J. and Fangman,W.L. (1997) Cell cycle-dependent establishment of a late replication program. Science, 276, 806–809. [DOI] [PubMed] [Google Scholar]
- Rhind N. and Russell,P. (2000) Chk1 and cds1: linchpins of the DNA damage and replication checkpoint pathways. J. Cell Sci., 113, 3889–3896. [DOI] [PMC free article] [PubMed] [Google Scholar]
- Sanchez J.A., Kim,S.-M. and Huberman,J.A. (1998) Ribosomal DNA replication in the fission yeast, Schizosaccharomyces pombe. Exp. Cell Res., 238, 220–230. [DOI] [PubMed] [Google Scholar]
- Santocanale C. and Diffley,J.F.X. (1998) A Mec1- and Rad53-dependent checkpoint controls late-firing origins of DNA replication. Nature, 395, 615–618. [DOI] [PubMed] [Google Scholar]
- Santocanale C., Sharma,K. and Diffley,J.F.X. (1999) Activation of dormant origins of DNA replication in budding yeast. Genes Dev., 13, 2360–2364. [DOI] [PMC free article] [PubMed] [Google Scholar]
- Shirahige K., Hori,Y., Shiraishi,K., Yamashita,M., Takahashi,K., Obuse,C., Tsurimoto,T. and Yoshikawa,H. (1998) Regulation of DNA-replication origins during cell-cycle progression. Nature, 395, 618–621. [DOI] [PubMed] [Google Scholar]
- Simon I. and Cedar,H. (1996) Temporal order of DNA replication. In DePamphilis,M.L. (ed.) DNA Replication in Eukaryotic Cells. Cold Spring Harbor Laboratory Press, Plainview, pp. 387–408.
- Smith J.G., Caddle,M.S., Bulboaca,G.H., Wohlgemuth,J.G., Baum,M., Clarke,L. and Calos,M.P. (1995) Replication of centromere II of Schizosaccharomyces pombe. Mol. Cell. Biol., 15, 5165–5172. [DOI] [PMC free article] [PubMed] [Google Scholar]
- Stevenson J.B. and Gottschling,D.E. (1999) Telomeric chromatin modulates replication timing near chromosome ends. Genes Dev., 13, 146–151. [DOI] [PMC free article] [PubMed] [Google Scholar]
- Tanaka K. and Okayama,H. (2000) A pcl-like cyclin activates the Res2p–Cdc10p cell cycle ‘start’ transcriptional factor complex in fission yeast. Mol. Biol. Cell, 11, 2845–62. [DOI] [PMC free article] [PubMed] [Google Scholar]
- Verkade H.M. and O’Connell,M.J. (1998) Cut5 is a component of the UV-responsive DNA damage checkpoint in fission yeast. Mol. Gen. Genet., 260, 426–433. [DOI] [PubMed] [Google Scholar]
- Vujcic M., Miller,C.A. and Kowalski,D. (1999) Activation of silent replication origins at autonomously replicating sequence elements near the HML locus in budding yeast. Mol. Cell. Biol., 19, 6098–6109. [DOI] [PMC free article] [PubMed] [Google Scholar]
- Walker G.M. (1999) Synchronization of yeast cell populations. Methods Cell Sci., 21, 87–93. [DOI] [PubMed] [Google Scholar]
- Wohlgemuth J.G., Bulboaca,G.H., Moghadam,M., Caddle,M.S. and Calos,M.P. (1994) Physical mapping of origins of replication in the fission yeast Schizosaccharomyces pombe. Mol. Biol. Cell, 5, 839–849. [DOI] [PMC free article] [PubMed] [Google Scholar]
- Zhu J., Newlon,C.S. and Huberman,J.A. (1992) Localization of a DNA replication origin and termination zone on chromosome III of Saccharomyces cerevisiae. Mol. Cell. Biol., 12, 4733–4741. [DOI] [PMC free article] [PubMed] [Google Scholar]