

Abstract
Bacteriophage φ29 gene expression takes place from four major promoters, three of them (A2b, A2c and A3) clustered within 219 bp at a central region of the genome. Transcription regulation of these promoters involves both a highly specific DNA-binding protein (p4) and a low specificity DNA-binding protein (p6) functionally related to prokaryotic histone-like proteins. Protein p6 forms extended oligomeric arrays along the phage DNA. In contrast, protein p4 binds specifically upstream of late promoter A3 and early promoter A2c. We have analysed the concomitant binding of p6 and p4 and found that the proteins cooperate with each other in the binding to the central region of the genome, resulting in a ternary p4–p6–DNA complex that affects local DNA topology. Through this complex, protein p6 exerts a direct role in the repression of promoter A2c, impeding unwinding of the DNA strands needed for open complex formation. In contrast, protein p6 functions by reinforcing the positioning of protein p4 in the repression of promoter A2b and activation of promoter A3, thereby facilitating p4-mediated transcription regulation.
Keywords: architectural protein/prokaryotic histone-like protein/protein–DNA interactions/protein functional cooperativity/transcription regulation
Introduction
Regulation of transcription initiation is a fundamental step in the control of gene expression. Protein–protein interactions required for this control may involve identical or heterologous molecules, and some transcription regulators appear to be able to communicate with other co-regulators to either activate or repress transcription. Bacillus subtilis phage φ29 gene expression takes place from four major promoters. Early genes are transcribed from promoters A2b, A2c and C2, while late genes are transcribed from a single promoter, A3. Promoters A2b, A2c and A3 are clustered, within a distance of 219 bp between A2c and A3 transcription start sites, and they are functionally synchronized. Transcription from promoters A2b and A2c reaches maximum levels at ∼20 min after infection; this corresponds to the time when the late promoter is activated. In vivo, two early proteins, p4 and p6, are involved in the switch from early to late transcription. In bacteria harbouring a nonsense mutant in gene 4, transcription from promoters A2b and A2c increases steadily during infection while the transcripts arising from promoter A3 are almost undetectable (Monsalve et al., 1995). On the other hand, cells infected with a nonsense mutant in gene 6 are affected in the overall repression of early transcription (Camacho and Salas, 2000). Protein p4 is a homodimeric sequence-specific DNA-binding protein, while protein p6 is a low affinity DNA-binding protein. Several lines of evidence indicate that protein p4 contacts the α-subunit of B.subtilis RNA polymerase (RNAP) upon DNA binding, and that these contacts affect the RNAP–DNA interaction at promoters A2c and A3 (Mencía et al., 1996; Monsalve et al., 1996). As a result, RNAP can bind promoter A3, otherwise impaired by the absence of a –35 element. In contrast, interaction of p4 with RNAP interferes with promoter clearance at promoter A2c. Protein p6 has affinity for bendable regions of the phage genome, but no DNA consensus sequence motif for specific binding has been identified (Serrano et al., 1989). Recent results have shown that p6 and p4 binding to the DNA sequence where promoters A2b, A2c and A3 are located results in the regulation of the promoters (Elías-Arnanz and Salas, 1999). However, little is known about the precise binding of p4 and p6 to the DNA region containing these promoters or about the molecular mechanism of their regulation.
The aim of this work was to elucidate the molecular mechanisms exerted by the p4–p6 complex to drive the repression of promoters A2b and A2c and the activation of promoter A3. We have analysed the complex formed by proteins p4 and p6 in a DNA fragment containing these promoters and studied functional interactions between these proteins and with the RNAP when bound to DNA. We have analysed the p4–p6 nucleoprotein complex and the formation of transcription initiation complexes in the presence of p4 and p6. The data obtained indicate that: (i) both proteins, p4 and p6, bind DNA cooperatively; (ii) simultaneous binding of p6 and p4 produces an architectural modification of the DNA and generates a multimeric nucleoprotein complex that covers the sequence from promoter A2c to promoter A3; (iii) this complex does not impede the binding of RNAP to the promoters; (iv) protein p6 within the multimeric complex participates in the repression of promoter A2c, impairing the unwinding of the DNA and consequently preventing the formation of open complex; and (v) the activity of promoters A2b and A3 is regulated essentially by protein p4; protein p6 functions here by reinforcing the positioning of protein p4, hence facilitating the p4-mediated transcription regulation.
Results
Binding of proteins p4 and p6 at the promoters of the central region of φ29 DNA
The φ29 DNA sequence located between positions 4971 and 5190 bp contains two early promoters, A2b and A2c, and the late promoter A3, all of them regulated by the phage-encoded proteins p4 and p6. Three binding sites for protein p4 (named sites 1, 2 and 3 in Figure 1) have been defined in this region. By methylation interference assays, it has been demonstrated that, in the absence of RNAP, p4 binds at promoter A2c to site 1 centred at position –39 relative to the transcription start site, hence overlapping the –35 element of this promoter. When RNAP is present, protein p4 seems to be displaced to a different site centred at position –71 (site 2; Monsalve et al., 1998). By DNase I and hydroxyl radical footprinting, and methylation interference assays, a binding site for protein p4 at promoter A3 was located centred at position –82 relative to the transcription start site (site 3; Barthelemy and Salas, 1989). It has also been demonstrated that protein p6 protects the promoters from DNase I in the absence of salt, and that the nucleoprotein complex is responsible for both repression of promoter A2c and activation of promoter A3 in the presence of p4 (Elías-Arnanz and Salas, 1999).


Fig. 1. Protection of the DNA sequence containing promoters A2b, A2c and A3 by the p4–p6 nucleoprotein complex. DNase I footprint of p4 and p6 bound to the 363 bp fragment containing promoters A2b, A2c and A3, labelled either at the late strand (A) or at the early strand (B). Protein concentrations were 500 nM p4 and 7 µM p6, except in lane p4 + p6a of (B) where 3.5 µM p6 was added. Some positions relative to the start point of promoter A2c (A) or of promoter A3 (B), as well as the transcription start site for each promoter are indicated. In (C), the top lane shows the transcription and genetic map of bacteriophage φ29 with the location of promoters A1, A2c, A2b, A3 and C2 depicted. Arrows indicate direction of transcription, with the arrowheads at the termination sites (TA1 and TD1). Numbers represent genes. The phage terminal protein (TP) is shown attached to the 5′ ends of the genome. The central lane shows an enlargement of the region containing promoters A2c, A2b and A3, with the promoter elements and transcription start sites indicated for each promoter. Bottom lane: schematic representation of the data obtained from (A) (late strand) and (B) (early strand) for binding positions of proteins p4 and p6 within the multimeric nucleoprotein complex. Round balls represent protein p4 and oval balls represent protein p6, with a discontinuous outline indicating less clear-cut binding positions; triangles indicate positions for which it is not possible to ascertain whether p4 or p6 is bound. The locations of protein p4-binding sites described by Monsalve et al. (1998) and Barthelemy and Salas (1989) are shown by dashed bars 1, 2 and 3 at the sides of (A) and (B) and in (C).
With the aim of studying the function of p6 in the phage transcriptional switch, we first analysed by DNase I footprinting the simultaneous binding of p4 and p6 to a fragment containing promoters A2b, A2c and A3. The fragment (363 bp) included from position +77 relative to the promoter A2c start site to position +68 relative to the promoter A3 start site. We added salt (100 mM KCl) in all the experiments described in this work since the activity of the promoters is salt dependent and, in addition, it is required for detection of the p6–DNA complex by band shift assays (unpublished results). As shown in Figure 1A, protein p4 binds at the strand coding for late genes between positions –120 and –163 (site 3) relative to the A2c promoter start site, as evidenced by the increase in intensity of some bands and protection at others. Binding of p4 also produced some protection and increased sensitive bands between positions –23 and –67. These positions are included in the previously identified binding site 1 and, under the conditions used here, they extend partially to binding site 2. Protein p6 binds along the late DNA strand, yielding partial protection of the sequence against nuclease and several hypersensitive bands (see positions +39, +15, –9, –33, –54, –107, –173, etc.) (Figure 1A). Simultaneous addition of p4 and p6 resulted in a general increase of protection and the enhancement of susceptibility to nuclease attack at positions –8, –45, –83, –107, –132, –143, –188, –200, –212, etc. Taking into account the similarities and differences between the p4–p6 footprint and the footprint of each protein, it is likely that protein p4 maintains its contacts between positions –132 and –143 at site 3 and occupies the upper part of site 1 in the p4–p6 nucleoprotein complex. Protein p6 contacts the DNA strand from position –23 to the end of the fragment (position +40) and, most likely, at and around position –107. However, we cannot define which of the two proteins occupies the lower part of sites 1 and 2.
Analysis of p4 and p6 binding to the DNA strand coding for early genes (Figure 1B) shows protein p4 bound at positions –131 to –220 relative to the A3 promoter start site, which roughly corresponds to sites 1 and 2, and from positions –64 to –101, corresponding to site 3. Binding of protein p6 protected this DNA strand and generated hypersensitive bands at positions –1, –58, –97, –120, –174, –220, etc. Simultaneous addition of p4 and p6 resulted in the formation of a nucleoprotein complex whose DNase I footprint pattern depends on the p6 concentration The p4–p6 complex extends from promoter A2c to binding site 3 at the lower p6 concentration (3.5 µM; p4 + p6a). However, at higher p6 concentration (7 µM; p4 + p6b), the protected pattern extends towards the sequence of promoter A3.
The above results are summarized in Figure 1C. Protein p4, in addition to binding to site 1 in the absence of RNAP as described in Monsalve et al. (1998), may also bind to site 2 in the absence of RNAP. This may be due to the fact that the fragment used herein included the three p4-binding sites, while Monsalve et al. (1998) used a fragment containing only p4 sites 1 and 2. When both proteins are present, the region spanning from downstream of promoter A2c to downstream of promoter A3 is complexed with proteins. In the p4–p6 complex, the results obtained do not allow us to define which of the proteins occupies positions from –23 to –35 and from –45 to –57 at the late strand or the corresponding positions at the early strand. The increase in DNase I hypersensitivity and the shift from position –46 to –45 when both proteins are present suggest establishment of a new p4–DNA contact and/or the modification of the DNA structure. In addition, the appearance of a series of strong DNase I-hypersensitive sites suggests a greater widening of the minor groove and, in consequence, stronger bending of the DNA upon complex formation.
Cooperativity or interference between p4 and p6 could be expected since the binding positions of both proteins overlap. To determine possible functional interactions between p4 and p6, we performed gel mobility shift assays with three different DNA fragments (see Figure 2A). Fragment b (363 bp) contains promoters A2b, A2c and A3, thus the p4-binding sites at promoters A2c and A3. Fragment c (179 bp) contains only promoter A2c with the upstream sequence up to position –103. Fragment d (177 bp) contains only promoter A3 with its upstream sequence up to position –110.

Fig. 2. Cooperativity in the binding of p4 and p6 to fragments containing promoters A2c and/or A3. (A) A schematic representation of the fragments used in the experiment showing the promoters and promoter elements included in each fragment. Scheme b shows the DNA fragment used in (B) that includes promoters A2b, A2c and A3. Scheme c corresponds to the fragment used in (C) containing only promoter A2c, while scheme d corresponds to the fragment containing only promoter A3 used in (D). The p4 and/or p6 nucleoprotein complexes were analysed by gel electrophoresis. Proteins were added according to the scheme above the autoradiograms, where samples in lanes a–c contain 10 µM of p6 and the amount of p4 indicated, and lanes i–l contain 130 nM p4 and the amount of p6 indicated. Nucleoprotein complexes are indicated at the side.
As shown in Figure 2B, each protein interacted with the 363 bp fragment; 130 nM p4 was needed to produce 50% of the DNA as p4–DNA complex (lane g), and 7 µM p6 produced a slightly retarded band (lane n). Simultaneous addition of p4 and p6 resulted in the formation of a protein–DNA complex with slower mobility compared with the p4–DNA and p6–DNA complexes, indicating that a ternary p4–p6–DNA complex was formed. It is clear that p6 stimulated p4 binding (compare lanes a and d). Similarly, in the presence of p4, 1.4 µM p6 was sufficient to obtain ternary p4–p6–DNA complex whereas 3.5 µM was insufficient for p6 complex formation (lanes i and m).
When promoters A2c and A3 were physically separated, p4 bound less efficiently to the fragment containing promoter A2c than to that with the A3 promoter sequence (compare lanes d–f, Figure 2C and D). In contrast, protein p6 bound similarly to each fragment, resulting in three distinct mobility bands as the amount of protein was increased, indicating progressive occupation of binding sites or architectural modification of DNA upon protein binding (lanes n–p, Figure 2C and D). When both proteins were added, a ternary p4–p6–DNA complex was formed with both fragments, but cooperativity of the proteins differed depending on the sequence analysed. Cooperativity was observed on fragment c (compare lanes a with d, and j with m, Figure 2C), while no cooperativity was evident at fragment d (Figure 2D). These results suggest the presence of some sequence or structure in fragment c that promotes p4–p6 binding cooperativity
Mechanism of repression of promoter A2c and activation of promoter A3 mediated by the multimeric complex formed by proteins p4 and p6
In vitro, addition of p6 enhanced the p4-mediated repression of promoter A2c (Elías-Arnanz and Salas, 1999). To determine the precise step of transcription affected by the p4–p6 complex, we analysed, by DNase I footprinting, binding of RNAP to promoter A2c in the presence of p4 and increasing amounts of p6.
As shown in Figure 3, the lower concentration of p6 used (3.5 µM) was insufficient to detect a footprint, but addition of p4 produced the multimeric complex footprint pattern described in Figure 1A, in agreement with the cooperativity of the two proteins shown in Figure 2. In addition, there was a correspondence between the increase in the amount of p6 and the progressive binding of protein toward promoter A3 as described in Figure 1B. RNAP binds to promoters A2c and A2b, but not to promoter A3 that lacks a –35 element (Rojo et al., 1998). At promoter A2c, RNAP protected the sequence between positions +18 and –59 with a characteristic hypersensitive band at position –36 (lane n). RNAP binding to promoter A2b is reflected by hypersensitivity to DNase I at position –134 (lane n). Addition of 3.5 or 7 µM protein p6 does not modify these RNAP-derived footprints (compare lane n with lanes k and l), but at 10 µM p6 (lane m) either RNAP is displaced by p6 or the p6 footprint overlaps with that of RNAP. As shown previously, protein p4 binds upstream of promoters A2c and A3 (see lane o). Addition of p4 and RNAP results in binding of RNAP to promoter A3 (here only evident by modification around position –173, lane p). The footprint at promoter A2c indicates the presence of RNAP and p4 (lane p). Concomitantly, the RNAP-derived hypersensitive band at promoter A2b disappeared (band at –134; compare lanes n and p), indicating displacement of RNAP. The RNAP footprints were not essentially modified by the addition of 3.5 µM p6 (compare lanes h and p). However, p6-mediated stabilization of RNAP at promoter A3 was observed (compare lanes h and p between positions –188 and –212). With 10 µM p6, the RNAP footprints at promoters A2c and A3 disappeared, in spite of the presence of p4 (lane j). However, with 7 µM p6, RNAP was bound at promoter A3, and a mixed footprint pattern could be observed at promoter A2c (lane i). Notice, although decreased, the band at position –36 corresponding to RNAP, while bands at positions –8/–9, +2 and +16 suggest that p6 remains bound there and the hypersensitivity at position –45 suggests the presence of p4. This result suggests that RNAP recognizes and binds promoter A2c in the presence of the p4–p6 complex. Similar results were obtained when the shorter fragment containing only promoter A2c was analysed, except that higher concentrations of p6 were needed to achieve complex formation (Figure 3, lanes q–ε). This result indicates that p4 must be bound to site 1 and/or site 2.

Fig. 3. Binding of RNAP to the A2c, A2b and A3 promoters in the presence of proteins p4 and p6 analysed by DNase I footprinting. The DNA fragments used include promoters A2c, A2b and A3 (lanes a–p) or only promoter A2c (lanes q–ε), and were labelled at the late DNA strand. Proteins were added according to the scheme above the autoradiograms to the following final concentrations: p4 at 500 nM; RNAP at 50 nM; and p6 at 3.5, 7 or 10 µM. Guiding positions relative to the promoter A2c start site are shown at the side. Sequences protected upon RNAP binding at promoter A2c and the start sites of promoter A2b and A3 are depicted on the left. Protein p4-binding sites 1, 2 and 3 are indicated by dashed bars.
The DNase I footprint pattern seen in Figure 3 (lane i) could reflect events taking place on different DNA molecules during the 2 min of treatment with the nuclease. To determine if RNAP could bind promoter A2c in the presence of the p4–p6 multimeric complex, we carried out band shift analyses using the DNA fragment containing only promoter A2c (Figure 4). With 7 and 35 nM RNAP, 10 and 90% of the fragment, respectively, formed closed transcription complexes at 4°C (lanes e and f). Further addition of p4 increased closed complex formation, probably through interaction between the protein and RNAP (lanes g and h). Addition of both p4 and p6 at the lower concentration of RNAP resulted in a main complex with the mobility of the p4–p6 complex (compare lanes c and k). At the higher concentration of RNAP, the DNA appeared as a complex containing RNAP with p4 and p6 since its mobility was lower than that of the complex obtained with RNAP and p6 (compare lanes j and l). The presence of both p4 and p6 in the complex with RNAP was confirmed by western blotting analysis (not shown). From these results and the DNase I footprints, we conclude than the multimeric p4–p6 complex does not occlude promoter A2c to RNAP or impedes the formation of the closed complex. Hence, some step following closed complex formation should be the target of repression.

Fig. 4. Closed complex formation at promoter A2c in the presence of p4 and/or p6 analysed in band shift assay. Promoter A2c transcription complex was allowed to be formed at 4°C using the DNA fragment containing only promoter A2c. Proteins were added according to the scheme above the autoradiograms using 7 or 35 nM RNAP, 100 nM p4 and 7 µM p6. Complexes were resolved by electrophoresis in 4% acrylamide gels. Nucleoprotein complexes are indicated at the side.
Bacillus subtilis RNAP forms unusually unstable open complexes that are in equilibrium with closed complexes and, in turn, with free RNAP (Whipple and Sonenshein, 1992; Rojo et al., 1993). This characteristic makes the RNAP from B.subtilis less prone to abortive transcription when compared with the Escherichia coli enzyme (Artsimovitch et al., 2000). Binding of protein p4 upstream of promoters A2c and A3 differentially regulates these promoters by interacting with the C-terminal domain of the B.subtilis RNAP α-subunit. This interaction results in stabilization of RNAP binding at the promoters (Mencía et al., 1996; Monsalve et al., 1996). Stabilization of the promoter complexes frequently results in increased production of abortive products (Ellinger et al., 1994), probably because RNAP cannot release its contacts with the promoter, generating short transcripts in reiterative steps of abortive initiation (Carpousis and Gralla, 1985; Landick et al., 1996).
To analyse the products generated by RNAP flanked with p4–p6 complex from the A2c promoter, we examined the production of 12mer transcripts in an abortive transcription reaction where the initial dinucleotide GpU and only ATP, GTP and labelled UTP were added. Under these conditions, truncated transcripts derived from promoters A2b and A3 should be unlabelled since the incorporation of CMP precedes that of UMP. As shown in Figure 5, protein p4 reduced the output of 12mer RNA by 50% (compare lanes a and f). However, in the presence of both p4 and p6, the synthesis of abortive transcripts was abolished, indicating that the multimeric complex impeded polymerization.

Fig. 5. Simultaneous addition of p4 and p6 impedes synthesis of 12mer transcripts from promoter A2c. A truncated transcription assay was performed in the presence or absence of p4 and p6, adding the initial dinucleotide (GpU) of promoter A2c and only three (GTP, ATP and labelled UTP) of the four NTPs. Under these conditions, the only transcripts radioactively labelled should be the 12mer transcript derived from promoter A2c. The nucleotide sequence of the 12mer transcript is depicted. Template DNA is the 363 bp fragment containing promoters A2c, A2b and A3. The concentration (nM) of protein p4 used is indicated at the top of each lane and, where indicated, 7 µM p6 was added. RNAP concentration was 35 nM.
The extent of interaction of RNAP with promoter A2c during the synthesis of the 12mer transcripts was analysed further by DNase I footprint (Figure 6). Synthesis of 12mer RNA is reflected by the displacement of the RNAP protection pattern, upstream from position –36 to –5, and downstream from position +18 to +27 (lanes d and e); hence, RNAP protects a shorter sequence, and the hypersensitive site at position –36 is greatly diminished. The pattern does not vary after the addition of p6 (lane c). On the contrary, addition of p4 (lane b) resulted in the disappearance of protection between positions +18 and +27, the increase in hypersensitivity at position –36 and the appearance of other bands (positions –43, –59 and –69), indicating a p4-mediated restriction of RNAP advancement (lane b). This pattern was modified by the addition of p6 (lane g). The RNAP-derived band at position –36 remained while the band at –43 disappeared and one at position –45 appeared, suggesting a relocation of p4. In general, the pattern implies that in the presence of both p4 and p6, RNAP becomes stalled at the promoter unable to progress to polymerization.

Fig. 6. Proteins p4 and p6 impede progression of RNAP. Progression of RNAP at promoter A2c in the absence or presence of the p4–p6 nucleoprotein complex during the synthesis of the 12mer RNA transcripts was analysed by DNase I footprinting. The initial dinucleotide (GpU) of promoter A2c and GTP, ATP and UTP were added to the assays labelled as 3NTPs. The concentrations of proteins used were: p4 at 500 nM; RNAP at 50 nM; and p6 at 7 µM. The sequence protected by RNAP before and after progression along promoter A2c is depicted on the right. Arrows mark the hypersensitive p4-derived band on the RNAP–p4 complex altered after addition of p6. Nucleotide positions relative to the start site of promoter A2c are depicted on the left.
Potassium permanganate cleaves DNA preferentially at those positions in which the double helix is melted, unstacked single-stranded thymines being particularly sensitive. Therefore, open complexes appear as single-stranded DNA regions sensitive to the permanganate, around the +1 position of the promoter. The 363 bp fragment containing the promoters of the central region was incubated with RNAP at 37°C with or without p4 and/or p6 and then treated with potassium permanganate (Figure 7). In the presence of RNAP, the open complex at promoter A2c showed sensitivity to potassium permanganate from positions +3 to –11, with positions –3 and –4 being hyperactive (lane c). Protein p6 partially interfered with DNA unwinding (lane f), and simultaneous addition of both p6 and p4 abolished the formation of the open complex (lane h). These results indicate that protein p6, although not sufficient for promoter A2c repression, plays an active role, impairing DNA unwinding.
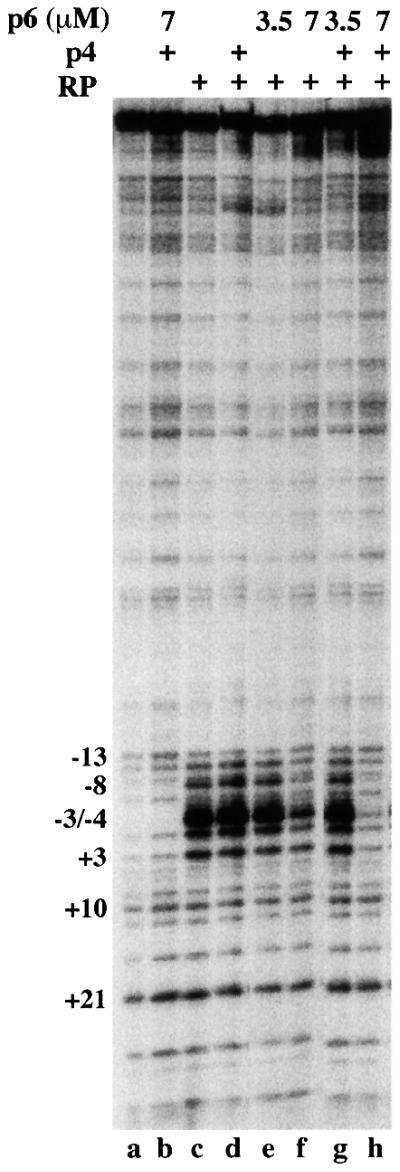
Fig. 7. The p4–p6 protein complex impedes open complex formation at promoter A2c. The effect of p4 and p6 on the formation of open complex at promoter A2c was analysed by permanganate footprinting. Proteins were added according to the scheme above the autoradiogram where p4 was at 500 nM and RNAP was at 50 nM. Thymines at the promoter A2c start site are indicated.
Protein p4 activated transcription of the late promoter A3, and protein p6 enhanced this activation (Barthelemy and Salas, 1989; Elías-Arnanz and Salas, 1999). Protein p6 increases binding of p4 to a fragment containing promoter A3 (see Figure 2B). This fact should contribute to stabilization of RNAP at this promoter through its interaction with p4. We wondered if p6 might have a more direct role on promoter A3 activation through the p4–p6 nucleoprotein complex. To determine this, we performed DNase I footprint assays with the early strand labelled to analyse the binding of RNAP to promoter A3 in the presence of p4 and p6 (Figure 8). As expected, RNAP does not bind promoter A3 lacking a –35 element but binds rather to promoter A2c (lane h). Addition of p4 results in the binding of RNAP to promoter A3 ahead of the bound p4 and, in addition, p4 is also positioned upstream of the enzyme bound to promoter A2c (lane g). Under these conditions, p6 increased the stability of the transcription complex at promoter A3 since the degree of protection increased, and the sequence protected was enlarged to position +30 (lane d). However, protein p6 by itself did not promote RNAP binding at promoter A3 (lane e). Therefore, activation of promoter A3 seems to be due mainly to p4–RNAP interaction enhanced by the stabilization of p4 binding through the formation of the p4–p6 nucleoprotein complex and/or the modification of the DNA conformation.

Fig. 8. Binding of RNAP to promoter A3 in the presence of proteins p4 and p6 analysed by DNase I footprinting. The fragment used includes promoters A2c, A2b and A3 and was labelled at the early DNA strand. Proteins were added according to the scheme above the autoradiogram at the following final concentrations: p4 at 500 nM; RNAP at 50 nM; and p6 at 7 µM. Nucleotide positions relative to the promoter A3 start site are shown on the left. Sequences protected upon binding of RNAP are shown on the right. Dashed bars depict protein p4-binding sites 1, 2 and 3.
Discussion
Initiation of transcription is a process involving different steps, all of them potential targets for regulation. Two bacteriophage φ29 proteins, site-specific protein p4 and the histone-like protein p6, regulate the temporal expression of the φ29 genome through some of these control points. Synthesis of proteins p6 and p4 correlates with coordinated repression of early promoters A2c, A2b and C2 and activation of late promoter A3. Protein p6 binds cooperatively to the phage DNA without specificity of base pair recognition, giving rise to complexes scattered along the genome. The same algorithm developed to predict histone octamer positioning on a given DNA sequence (Satchwell et al., 1986) allowed the prediction of protein p6 high-affinity binding regions (Serrano et al., 1990). This, together with its small size, abundance and ability to compact DNA, has led to the proposal that p6 might serve to organize the phage genome, holding the DNA in an appropriate conformation that provides the adequate framework for multiple processes (Gutiérrez et al., 1994). Binding of p6 to the right φ29 DNA sequence where promoter C2 is located produces a characteristic DNase I footprint of protection with hypersensitive bands every 24 bp, extended over several hundred nucleotides, leading to promoter C2 repression (Serrano et al., 1990; Camacho and Salas, 2001). Protein p6 binds to the region containing promoters A2b, A2c and A3 but does not significantly modify the expression of these promoters in the absence of protein p4 (Elías-Arnanz and Salas, 1999). Interestingly, the DNase I footprint here differs from that obtained at the promoter C2 sequence, indicating different protein–DNA interactions that might be related to the activity of p6 as a transcription regulator. Protein p4 binds to defined positions (named here sites 1, 2 and 3) located upstream of promoters A2c and A3. Simultaneous binding of p6 and p4 to the region containing promoters A2b, A2c and A3 generates a high order nucleoprotein complex that is responsible for the repression of promoters A2b and A2c and the activation of promoter A3. As shown schematically in Figure 9B, the data presented here indicate that protein p6 is bound downstream of the main core of promoter A2c and p4 is bound at site 3, while the p4–DNA contacts at sites 1 and 2 might by modified in the p4–p6 nucleoprotein complex.

Fig. 9. Model for the switch from φ29 DNA early to late transcription due to the cooperative binding of proteins p4 and p6. (A) Upon phage infection, the host RNAP binds to promoters A2b and A2c, giving rise to transcription of genes 6 to 1 (see Figure 1), while binding to promoter A3 requires synthesis of protein p4. (B) Nucleoprotein complex of proteins p4 and p6. Binding of proteins p4 and p6 leads to the formation of a nucleoprotein complex that covers the entire DNA fragment containing promoters A2b, A2c and A3 and where binding of each protein is enhanced and becomes stabilized by the presence of the other protein. Round balls represent protein p4, oval balls represent protein p6, while triangles represent binding positions for which it was not possible to ascertain whether p4 or p6 was bound. (C) Binding of p4, p6 and RNAP to the sequence at intermediate times after phage infection. RNAP is capable of competing with molecules (dimers) of p4 and p6 bound at specific locations of promoters A2c and A3 but fails to displace them from promoter A2b. RNAP becomes stalled at promoter A2c, within the p4–p6 multimeric complex, unable to progress into open complex formation.
In the complex, proteins p6 and p4 cooperate in their binding to DNA in a sequence-dependent manner, requiring the region from promoter A2c to promoter A3. Protein p6 exhibits relatively high affinity for bendable sequences, inducing strong bending reflected by strong hypersensitive bands in the DNase I footprints. Protein p4 binding at promoter A3 increases the intrinsic sequence-directed curvature from 45 to 85° (Rojo et al., 1990). These architectural modifications of the DNA may affect simultaneous binding of the proteins by changing the minor groove geometry or/and modulating direct protein–protein interaction; however, evidence for the existence of p6–p4 heterodimers is still lacking. Simultaneous binding of p4 and p6 increases the protection and sensitivity of certain positions to DNase I cleavage, probably due to a more highly compacted nucleoprotein complex where the minor groove is widened by the bending of the DNA (Suck et al., 1988), leading to a conformational transition of the DNA. These modifications of DNA conformation could be the basis for p4–p6 mutual binding activation. Cooperative binding would allow protein p4, present at relatively low concentrations, to saturate its binding sites and, in addition, would increase the affinity of p6, which by itself is not a high affinity binding protein.
What is the mechanism by which the p4–p6 multimeric complex exerts its effect on the activity of promoters A2b, A2c and A3? It was postulated previously that p4 exerts its repressing (at promoter A2c) or activating (at promoter A3) effects through p4–RNAP interactions (Rojo et al., 1998). In addition, it has been shown that the promoter A2b is repressed by p4 and by increasing the DNA curvature (Rojo and Salas, 1991; Monsalve et al., 1995). The effect of protein p6 on repression of promoter A2c was explained by a displacement of protein p4 from sites 1 and 2 and occlusion of RNAP binding (Elías-Arnanz and Salas, 1999). The effect of cooperativity between proteins p4 and p6 on the coordinated regulation of promoters A2b, A2c and A3 has allowed the convergence of previous models. A p4–p6 multimeric complex, binding from the downstream region of promoter A2c to the downstream region of promoter A3, seems crucial for the correct transcription switch since separation of promoter A3 from A2c affects the regulation of the promoters (Elías-Arnanz and Salas, 1999) and the binding cooperativity of the proteins (this study). Moreover, the p4–p6 complex not only alters the binding of RNAP to the promoter, but may also provide the optimal frame for p4–RNAP interactions.
Figure 9 summarizes the complexes involved in the early to late transcription switch during phage infection. In the absence of proteins p4 and p6, early promoters A2c and A2b are active and the late promoter A3 is inactive since RNAP is unable to bind to this promoter that lacks a –35 element (Figure 9A; Rojo et al., 1998). Figure 9B shows a scheme of the complexes formed at the promoters upon p4 and p6 synthesis and DNA binding in the absence of RNAP (in vitro conditions). Complexes formed in the presence of RNAP, p4 and the amount of p6 that allowed the formation of a stable transcription complex at promoter A3 are shown in Figure 9C. Under these conditions, protein p6 cooperates with p4 in formation of a primary transcription complex at promoter A3. In this context, p6 seems to contribute to a more suitable environment for p4 binding through a change in the DNA structure or, perhaps, through protein–protein interactions. Moreover, since DNA bending is important for promoter A3 activation, we cannot exclude that additional p6-induced bending at the promoter could contribute to the stable positioning of the RNAP. We do not know how the p4–p6 multimeric complex bends the DNA or how it might adjust the distance and/or orientation of the sequences involved in protein binding. Contacts of protein p4 with RNAP at the A2c promoter disturb RNA synthesis, while p6 binding produced some impairment in the unwinding of the DNA necessary for open complex formation. However, at least in vitro, neither of these effects independently was sufficient to give rise to repression of promoter A2c. Indeed, we have shown that when both proteins are present, each protein plays a specific role resulting in formation of a stable RNAP closed complex and strong impairment of open complex formation.
Histone-like proteins such as the φ29-encoded protein p6 or the well-characterized proteins H-NS and HU of E.coli (Ueguchi and Mizuno, 1993; Drlica and Rouviere-Yaniv, 1994; Adhya et al., 1998), which are non-specific DNA-binding proteins, have been considered as chromosomal organizers. Recently, it has been demonstrated that they are capable of participating in numerous physiological processes, among them transcription regulation. For example, GalR repression of the gal P1 promoter requires the binding of protein HU to elicit the proper DNA structure that allows the interaction of GalR dimers bound at the operators Oe and Oi to form a repressive GalR tetramer (Lewis et al., 1999). H-NS represses promoter rrnB P1 by antagonizing FIS-dependent activation through a change in the DNA structure (Zacharias et al., 1992; Afflerbach et al., 1999; Schröder and Wagner, 2000). Similarly, H-NS represses its own promoter by antagonizing the binding of FIS at the hns promoter region (Falconi et al., 1996). Silencing of the E.coli bgl operon by H-NS has been proposed to occur through the formation of a nucleoprotein filament that includes H-NS and antagonizes CAP binding (Caramel and Schnetz, 1998, 2000). In contrast, bacteriophage φ29 proteins p4 and p6 are not functional antagonists but active partners in the regulation of promoters A2c and A3, constituting an interesting prokaryotic system of cooperation between a non-specific, histone-like DNA-binding protein and a site-specific regulator.
Materials and methods
Proteins and nucleotides
Bacillus subtilis RNAP was purified according to Sogo et al. (1979). Protein p6 was purified as described by Pastrana et al. (1985) and protein p4 as described by Rojo et al. (1990). Unlabelled NTPs and dNTPs were purchased from Pharmacia, and [γ-32P]ATP (3000 Ci/mmol) and [α-32P]UTP (3000 Ci/mmol) were obtained from Amersham International.
DNA substrates
The 362 bp DNA fragment containing promoters A2c, A2b and A3 was obtained by PCR amplification of the corresponding sequence from full-length φ29 DNA with the corresponding synthetic primers: 5′-GATTTCTCTCTGCATCA-3′ (primer 1) and 5′-CAAAATATCTTCGTGTTCTTC-3′ (primer 4). The 179 bp DNA fragment containing only promoter A2c was generated by PCR amplification using primers 1 and 2 (5′-GAGAACGTAGACAACAACC-3′), and the 177 bp fragment containing only promoter A3 was obtained by amplification of the sequence within primers 3 (5′-ACCACACCTGTATAACTTTT-3′) and 4. Each fragment was purified further by NuSieve GTG agarose (FMC) gel electrophoresis. Primers were purchased from Isogen. To label the DNA fragment at only one of the ends, one of the primers was treated with polynucleotide kinase and [γ-32P]ATP prior to the amplification reaction.
Gel retardation assays
Binding reactions (20 µl) contained the corresponding 5′-end-labelled fragment of φ29 DNA, 25 mM Tris–HCl pH 7.5, 10 mM MgCl2, 100 mM KCl, 1 µg of poly[d(I–C)] and 2 µg of bovine serum albumin (BSA). Proteins p6 and/or p4 were added in the amounts indicated and incubated for 5 min at 0°C. RNAP was then added in the amounts indicated and binding was allowed for 20 min at 4°C. After addition of 2 µl of 30% (v/v) glycerol, samples were loaded onto a non-denaturing 4% polyacrylamide gel containing 100 mM KCl. Electrophoresis was run at 25 mA/gel during 6 h at 4°C. Gels were dried and quantified by using a Fuji Bas-IIIs Image analyser.
DNase I and permanganate footprinting experiments
The footprint reactions contained end-labelled DNA (2–4 nM), 25 mM Tris–HCl pH 7.5, 10 mM MgCl2, 1 µg of poly[d(I–C)], 100 mM KCl and 2 µg of BSA in a final volume of 20 µl. Proteins p6 and/or p4 and/or RNAP were added in the amounts indicated for each experiment. Proteins p6 and p4 were incubated firstly with the DNA for 5 min at 0°C, then RNAP was added and incubation proceeded for 20 min at 37°C. DNase I footprinting was performed using the procedure of Galas and Schmitz (1978), digesting the DNA with 0.05 U of RQ1-DNase I (Promega) at 37°C during 2 min. Reactions were stopped by adding EDTA (10 mM) and 10 µg of tRNA. For KMnO4 footprinting, permanganate was added up to 4 mM and incubated for 30 s, and then stopped with 1 M β-mercaptoethanol and the addition of 100 µl of water and 1/10 vol. of 3 M sodium acetate pH 5. DNA was precipitated with ethanol and then cleaved with 1 M piperidine following the standard DNA sequencing procedure of Maxam and Gilbert (1980). For every footprinting experiment, DNA was precipitated with ethanol and analysed on denaturing 6% polyacrylamide gels.
In vitro transcription assays
Truncated transcription assays contained, in 25 µl, 25 mM Tris–HCl pH 7.5, 10 mM MgCl2, 2 mM dithiothreitol, 1 µg of poly[d(I–C)], 50 or 200 mM KCl, 10 U of RNasin, 2 nM of DNA fragment, 100 µM GTP and ATP, 50 µM [α-32P]UTP (1 µCi) and 200 µM GpU. Proteins p6 and/or p4 were incubated for 5 min at 0°C before RNAP addition, the reaction was then followed for 20 min at 37°C and stopped by addition of 0.15% SDS and 2.5 mM EDTA. Truncated transcripts were analysed by electrophoresis in 20% denaturing polyacrylamide gels.
Acknowledgments
Acknowledgements
We thank L.Rothman-Denes and F.Rojo for critical reading of the manuscript, and J.M.Lázaro and L.Villar for purification of proteins. This investigation was aided by research grants 2R01 GM27242-22 from the National Institutes of Health, PB98-0645 from the Dirección General de Investigación Científica y Técnica, Bio-CT98-0250 from the European Union and by an Institutional grant from the Fundación Ramón Areces.
References
- Adhya S., Geanacopoulos,M., Lewis,D.E., Roy,S. and Aki,T. (1998) Transcription regulation by repressosome and by RNA polymerase contact. Cold Spring Harbor Symp. Quant. Biol., 63, 1–9. [DOI] [PubMed] [Google Scholar]
- Afflerbach H., Schröder,O. and Wagner,R. (1999) Conformational changes of the upstream DNA mediated by H-NS and FIS regulate E.coli rrnB P1 promoter activity. J. Mol. Biol., 286, 339–353. [DOI] [PubMed] [Google Scholar]
- Artsimovitch I., Svetlov,V., Anthony,L., Burgess,R.R. and Landick,R. (2000) RNA polymerases from Bacillus subtilis and Escherichia coli differ in recognition of regulatory signals in vitro. J. Bacteriol., 182, 6027–6035. [DOI] [PMC free article] [PubMed] [Google Scholar]
- Barthelemy I. and Salas,M. (1989) Characterization of a new prokaryotic transcriptional activator and its DNA recognition site. J. Mol. Biol., 208, 225–232. [DOI] [PubMed] [Google Scholar]
- Camacho A. and Salas,M. (2000) Pleiotropic effect of protein p6 on the viral cycle of bacteriophage φ29. J. Bacteriol., 182, 6927–6932. [DOI] [PMC free article] [PubMed] [Google Scholar]
- Camacho A. and Salas,M. (2001) Repression of bacteriophage φ29 early promoter C2 by the viral protein p6 is due to the impairment of the closed complex. J. Biol. Chem., 276, 28927–28932. [DOI] [PubMed] [Google Scholar]
- Caramel A. and Schnetz,K. (1998) Lac and λ repressors relieve silencing of the Escherichia coli bgl promoter. Activation by alteration of a repressing nucleoprotein complex. J. Mol. Biol., 284, 875–883. [DOI] [PubMed] [Google Scholar]
- Caramel A. and Schnetz,K. (2000) Antagonistic control of the Escherichia coli bgl promoter by FIS and CAP in vitro. Mol. Microbiol., 36, 85–92. [DOI] [PubMed] [Google Scholar]
- Carpousis A.J. and Gralla,J.D. (1985) Interaction of RNA polymerase with lacUV5 promoter DNA during mRNA initiation and elongation. J. Mol. Biol., 183, 165–177. [DOI] [PubMed] [Google Scholar]
- Drlica O.J. and Rouviere-Yaniv,J. (1994) Histones, HMG, HU, IHF: meme combat. Biochimie, 76, 901–908. [DOI] [PubMed] [Google Scholar]
- Elías-Arnanz M. and Salas,M. (1999) Functional interactions between a phage histone-like protein and a transcriptional factor in regulation of φ29 early–late transcriptional switch. Genes Dev., 13, 2502–2513. [DOI] [PMC free article] [PubMed] [Google Scholar]
- Ellinger T., Behneke,D., Bujard,H. and Gralla,J.D. (1994) Stalling of Escherichia coli RNA polymerase in the +6 to +12 region in vitro is associated with the tight binding to consensus promoter elements. J. Mol. Biol., 239, 455–465. [DOI] [PubMed] [Google Scholar]
- Falconi M., Brandi,A., LaTeana,A., Gualerzi,C.O. and Pon,C.L. (1996) Antagonistic involvement of FIS and H-NS proteins in the transcriptional control of hns expression. Mol. Microbiol., 19, 965–975. [DOI] [PubMed] [Google Scholar]
- Galas D.J. and Schmitz,A. (1978) DNase footprinting: a simple method for detection of protein–DNA binding specificity. Nucleic Acids Res., 5, 3157–3170. [DOI] [PMC free article] [PubMed] [Google Scholar]
- Gutiérrez C., Freire,R., Salas,M. and Hermoso,J.M. (1994) Assembly of phage φ29 genome with viral protein p6 into a compact complex. EMBO J., 13, 269–276. [DOI] [PMC free article] [PubMed] [Google Scholar]
- Landick R.C., Turnbough,C.L.Jr. and Yanofski,C. (1996) Transcription attenuation. In Neidhardt,F. et al. (eds), Escherichia coli and Salmonella: Cellular and Molecular Biology. Vol. 1, 2nd edn. ASM Press Washington, DC, pp. 1263–1286.
- Lewis D.E., Geanacopoulos,M. and Adhya,S. (1999) Role of HU and DNA supercoiling in transcription repression: specialized nucleoprotein repression complex at gal promoters in Escherichia coli. Mol. Microbiol., 31, 451–461. [DOI] [PubMed] [Google Scholar]
- Maxam A.M. and Gilbert,W. (1980) Sequencing end-labelled DNA with base-specific chemical cleavages. Methods Enzymol., 65, 499–559. [DOI] [PubMed] [Google Scholar]
- Mencía M., Monsalve,M., Rojo,F. and Salas,M. (1996) Transcription activation by phage φ29 protein p4 is mediated by interaction with the α subunit of Bacillus subtilis RNA polymerase. Proc. Natl Acad. Sci. USA, 93, 6616–6620. [DOI] [PMC free article] [PubMed] [Google Scholar]
- Monsalve M., Mencía,M., Rojo,F. and Salas,M. (1995) Transcription regulation in Bacillus subtilis phage φ29: expression of the viral promoters throughout the infection cycle. Virology, 207, 23–31. [DOI] [PubMed] [Google Scholar]
- Monsalve M., Mencía,M., Salas,M. and Rojo,F. (1996) Protein p4 represses phage φ29 A2c promoter by interacting with the α subunit of Bacillus subtilis RNA polymerase. Proc. Natl Acad. Sci. USA, 93, 8913–8918. [DOI] [PMC free article] [PubMed] [Google Scholar]
- Monsalve M., Calles,B., Mencía,M., Rojo,F. and Salas,M. (1998) Binding of phage φ29 protein p4 to the early A2c promoter: recruitment of the repressor by the RNA polymerase. J. Mol. Biol., 283, 559–569. [DOI] [PubMed] [Google Scholar]
- Pastrana R., Lázaro,J.M., Blanco,L., García,J.A., Méndez,E. and Salas,M. (1985) Overproduction and purification of protein p6 of Bacillus subtilis phage φ29: role in the initiation of DNA replication. Nucleic Acids Res., 13, 3083–3100. [DOI] [PMC free article] [PubMed] [Google Scholar]
- Rojo F. and Salas,M. (1991) A DNA curvature can substitute phage φ29 regulatory protein p4 when acting as a transcriptional repressor. EMBO J., 10, 3429–3438. [DOI] [PMC free article] [PubMed] [Google Scholar]
- Rojo F., Zaballos,A. and Salas,M. (1990) Bend induced by the phage φ29 transcriptional activator in the viral late promoter is required for activation. J. Mol. Biol., 211, 713–725. [DOI] [PubMed] [Google Scholar]
- Rojo F., Nuez,B., Mencía,M. and Salas,M. (1993) The main early and late promoters of Bacillus subtilis phage φ29 form unstable open complexes with σA-RNA polymerase that are stabilized by DNA supercoiling. Nucleic Acids Res., 21, 935–940. [DOI] [PMC free article] [PubMed] [Google Scholar]
- Rojo F., Mencía,M., Monsalve,M. and Salas,M. (1998) Transcription activation and repression by interaction of a regulator with the α subunit of RNA polymerase: the model of phage φ29 protein p4. Prog. Nucleic Acid Res. Mol. Biol., 60, 29–46. [DOI] [PubMed] [Google Scholar]
- Satchwell S.C., Drew,H.R. and Travers,A.A. (1986) Sequence periodicities in chicken nucleosome core DNA. J. Mol. Biol., 191, 659–675. [DOI] [PubMed] [Google Scholar]
- Schröder O. and Wagner,R. (2000) The bacteria DNA-binding protein H-NS represses ribosomal RNA transcription by trapping RNA polymerase in the initiation complex. J. Mol. Biol., 298, 737–748. [DOI] [PubMed] [Google Scholar]
- Serrano M., Gutiérrez,C., Prieto,I., Hermoso,J.M. and Salas,M. (1989) Signals at the bacteriophage φ29 DNA replication origins required for protein p6 binding and activity. EMBO J., 8, 1879–1885. [DOI] [PMC free article] [PubMed] [Google Scholar]
- Serrano M., Salas,M. and Hermoso,J.M. (1990) A novel nucleoprotein complex at a replication origin. Science, 248, 1012–1016. [DOI] [PubMed] [Google Scholar]
- Sogo J.M., Inciarte,M.R., Corral,J., Viñuela,E. and Salas,M. (1979) RNA polymerase binding sites and transcription map of the DNA of Bacillus subtilis phage φ29. J. Mol. Biol., 127, 411–436. [DOI] [PubMed] [Google Scholar]
- Suck D., Lahm,A. and Oefner,C. (1988) Structure refined to 2 Å of a nicked DNA octanucleotide complex with DNase I. Nature, 332, 464–468. [DOI] [PubMed] [Google Scholar]
- Ueguchi C. and Mizuno,T. (1993) The Escherichia coli nucleoid protein H-NS functions directly as a transcriptional repressor. EMBO J., 12, 1039–1046. [DOI] [PMC free article] [PubMed] [Google Scholar]
- Whipple F.W. and Sonenshein,A.L. (1992) Mechanism of initiation of transcription by Bacillus subtilis RNA polymerase at several promoters. J. Mol. Biol., 223, 399–414. [DOI] [PubMed] [Google Scholar]
- Zacharias M., Göringer,H.U. and Wagner,R. (1992) Analysis of the Fis-dependent and independent transcription activation mechanism of the E.coli ribosomal RNA P1. Biochemistry, 31, 2621–2628. [DOI] [PubMed] [Google Scholar]