

Abstract
Cholangiocarcinoma (CC) is a highly lethal malignancy that urgently requires reliable prognostic biomarkers. Although MUC1 expression and promoter methylation have been implicated in CC, the clinical significance of promoter methylation pattern composition, beyond average methylation levels, remains unclear. Here, we investigated the relationship between MUC1 promoter methylation heterogeneity, MUC1 mRNA expression, and prognosis in CC. We analyzed bisulfite amplicon sequencing data and mRNA expression of MUC1, DNA methylation-related enzymes (TET1, TET2, TET3, Dnmt1, and Dnmt3a), and tumor microenvironment stress markers in 131 CC tissues. In the neoplastic region, high MUC1 mRNA expression was associated with poor overall survival (HR = 0.131, 95% CI: 0.02 to 0.95, p = 0.042) and correlated with the abundance of completely unmethylated promoter patterns (r = 0.386, p < 0.001). Among the enzymes analyzed, only TET3 expression significantly correlated with the abundance of completely unmethylated patterns in the neoplastic region (Cohen’s f2 = 0.108, p = 0.009), suggesting a potential region-specific regulatory association. We visualized beta-diversity in methylation pattern composition using t-SNE and classified samples into two groups based on a linear decision boundary in the t-SNE space. This classification stratified prognosis independently of clinical factors (HR = 0.291, 95% CI: 0.06 to 0.94, p = 0.037; multivariate p = 0.021). These findings propose a novel, composition-based epigenetic stratification framework in CC, revealing that MUC1 promoter methylation pattern structure—rather than average methylation level—has prognostic relevance. Our results highlight the potential of pattern-resolved methylation profiling in the development of clinically applicable epigenetic biomarkers.
Supplementary Information
The online version contains supplementary material available at 10.1038/s41598-025-21715-x.
Keywords: Cholangiocarcinoma, Mucin, Promoter methylation, Prognosis, Diversity
Subject terms: Bile duct cancer, Prognostic markers, Cancer epigenetics
Introduction
Cholangiocarcinoma (CC) is an aggressive malignancy of the biliary tract originating from the epithelial lining of the bile ducts. It is often diagnosed at an advanced stage because of its nonspecific clinical manifestations, including jaundice, weight loss, and abdominal pain, as well as its insidious biological progression. These factors contribute to delayed diagnosis and poor prognosis, with a 5-year survival rate of less than 20% in most cases1. Although surgical resection combined with hilar lymphadenectomy is the only potentially curative treatment, resectability is limited and recurrence is frequent2. These challenges underscore the urgent need for reliable biomarkers that can guide prognosis and therapeutic stratification in CC.
CC is anatomically classified into intrahepatic (iCC), perihilar (pCC), and distal CC (dCC) subtypes, among which pCC is the most common, accounting for approximately 50–67%3. Extensive surgical resection combined with hilar lymphadenectomy remains the only potentially curative treatment for localized CC4,5. However, the feasibility of surgery is limited because only 10–40% of cases are resectable at the time of diagnosis6. Furthermore, even among patients undergoing surgical resection, recurrence rates remain high, with many developing metastatic or locally advanced disease within a few years after surgery. The 90-day postsurgical mortality rate for pCC can reach 15% owing to the complexity of hepatobiliary surgery and high rate of postoperative complications7–9. Given the aggressive nature of CC and limitations of surgical intervention, the identification of reliable biomarkers for prognosis and treatment stratification is of paramount importance. Biomarkers capable of predicting long-term survival outcomes can assist in refining treatment strategies, guiding adjuvant therapy decisions, and facilitating the development of targeted therapeutic approaches10–12.
Among potential biomarkers, mucins play an essential role in cancer development and progression. Mucins are high molecular weight glycoproteins expressed on epithelial cell surfaces that contribute to cellular protection, signaling, and adhesion. In normal bile duct epithelium, mucins regulate barrier function and protect against chemical and mechanical stresses. However, aberrant mucin expression is frequently observed in CC and is associated with tumor aggressiveness, invasion, and resistance to apoptosis. Among them, Mucin 1 (MUC1) is a well-characterized transmembrane mucin synthesized as a single polypeptide that undergoes autocatalytic cleavage to form a stable heterodimer on the cell surface. Functionally, MUC1 disrupts epithelial cell polarity, activates receptor tyrosine kinase signaling, and promotes tumor progression by enhancing proliferation, survival, and metastatic potential13–15. High MUC1 expression is typically observed in invasive CC and correlates with poor prognosis, while low or absent expression is seen in non-invasive CC with more favorable clinical outcomes16–18. Previous immunohistochemical studies have consistently demonstrated frequent MUC1 expression in CC tissues19.
Epigenetic modifications, particularly promoter methylation, play a crucial role in the regulation of gene expression and have been implicated in cancer development and progression. DNA methylation in promoter regions typically suppresses gene transcription by inhibiting transcription factor binding. Aberrant methylation patterns, including the hypermethylation of tumor suppressor genes and hypomethylation of oncogenes, contribute to tumorigenesis and disease progression in multiple cancers, including CC. Furthermore, promoter methylation regulates MUC1 mRNA expression in pancreatic cancer, and is associated with patient prognosis 20,21. However, the role of MUC1 promoter methylation in CC remains unclear. Given the prognostic value of MUC1 expression and its epigenetic regulation in other cancers, further investigation is warranted to determine whether promoter methylation influences MUC1 expression and clinical outcomes in CC.
Conventional DNA methylation analysis methods—such as pyrosequencing and methylation-specific PCR—primarily report average methylation percentages but fail to capture the heterogeneity of methylation patterns within a sample. This limitation is significant because samples with identical average methylation levels may consist of markedly different CpG sequence patterns. For example, one sample may contain 25% fully unmethylated patterns (5'-UUUU-3') and 75% fully methylated patterns (5'-MMMM-3'), whereas another may contain four distinct partially methylated patterns (e.g., 5'-UMMU-3', 5'-MUMM-3', 5'-MMUM-3', 5'-MMMM-3'), each at 25%. Although both yield the same mean methylation value, their biological and prognostic implications may differ substantially. These considerations underscore the need for high-resolution sequencing approaches that can resolve methylation pattern composition, rather than relying solely on average values.
To overcome these limitations, we use bisulfite amplicon sequencing (BSAS), a high-resolution method capable of detecting diverse methylation patterns at CpG sites22. By focusing on sequential CpG methylation patterns, BSAS enables a detailed assessment of epigenetic modifications and their potential impact on gene regulation. In this study, we aimed to investigate whether the structural diversity of methylation patterns within the MUC1 promoter—rather than average methylation level—affects MUC1 mRNA expression and clinical outcomes in cholangiocarcinoma. To this end, we comprehensively characterized MUC1 promoter methylation patterns in both neoplastic and non-neoplastic regions of clinical CC samples. We further analyzed the expression of DNA methylation–regulating enzymes, including the TET and Dnmt families, as well as tumor microenvironment-related stress markers, to explore their potential involvement in MUC1 regulation. Through this integrative approach, we sought to clarify the clinical significance of methylation pattern heterogeneity and to propose a novel epigenetic stratification framework for prognostication in CC.
Materials and methods
Clinical information and bile tract tissue specimens
Freshly frozen tissue specimens were obtained from 131 patients who underwent surgical resection of a CC at Kagoshima University Hospital, Japan, between May 2009 and February 2019. Each tissue sample measured approximately 2 × 2 × 2 mm3 and was carefully dissected from the neoplastic region (tumor sites) and non-neoplastic region (surgical margins), followed by immediate freezing at -80 °C for storage.
Non-neoplastic tissue specimens were confirmed by pathological evaluation to be normal bile duct tissues without evidence of preneoplastic changes or contamination. The collected tissue sets included 111 neoplastic and 126 non-neoplastic specimens with 106 pairs. DNA was extracted from 95 non-neoplastic and 93 neoplastic specimens, of which 92 had matched pairs (Supplementary Table S1). Similarly, mRNA was extracted from 97 non-neoplastic and 84 neoplastic specimens, with 79 matched pairs (Supplementary Table S2). Data on the observation period were unavailable for 22 cases, while three cases lacked records of death events.
mRNA extraction and quantification
Total RNA was extracted from frozen neoplastic and non-neoplastic bile duct tissues using an RNeasy Mini Kit (Qiagen, Hilden, Germany). Reverse transcription of 500 ng total RNA was performed using a High-Capacity RNA-to-cDNA Kit (Applied Biosystems, Waltham, MA). Quantitative real-time polymerase chain reaction (qRT-PCR) was performed on a Roche LightCycler® 96 System with FastStart Essential DNA Green Master (Roche, Basel, Switzerland). Gene expression levels were normalized to β-actin mRNA. The primer sets used for qRT-PCR detection of MUC1 mRNA, other microenvironment stress-related marker mRNA, including 78-kD glucose-regulated protein (GRP78), carbonic anhydrase IX (CA9), acetyl-CoA synthetase 2 (ACSS2), and X-box binding protein 1 (XBP1), and other DNA methylation-related enzymes, including Ten-eleven translocation (TET) family, and DNA methyltransferase (Dnmt) family, are listed (Supplementary Table S3).
Genomic DNA extraction and bisulfite modification
Genomic DNA was extracted from frozen bile duct tissues using the DNeasy Blood & Tissue Kit (Qiagen). Bisulfite modification of DNA was performed using the EpiTect Bisulfite Kit (Qiagen), according to the manufacturer’s protocol. All steps were automated using the QIAcube Connect System (Qiagen) to ensure consistency and reproducibility.
Bisulfite amplicon sequencing of the MUC1 promoter region
Traditional methods for DNA methylation analysis, including methylation-specific PCR, mass spectrometry-based assays, and pyrosequencing, often provide only bulk methylation levels and do not evaluate the diversity of methylation patterns present in clinical samples. To address this limitation, we employed a previously established technique capable of sequentially analyzing CpG site-specific methylation patterns in the MUC1 promoter22,23.
The MUC1 promoter region, covering a 162-bp target sequence near the transcription start site, was amplified using a two-step nested PCR approach with the KAPA HiFi HotStart ReadyMix PCR Kit (Kapa Biosystems, Wilmington, MA) and the primers listed (Supplementary Table S3). This region contains eight CpG sites, allowing the identification of 256 distinct methylation patterns. The PCR products were subjected to library preparation using a GenNext NGS Library Prep Kit with TruSeq DNA CD indices (Illumina). Purification of amplicons was performed with MinElute® PCR Purification Kit (Qiagen) on a QIAcube Connect (Qiagen). Sequencing was performed using a MiSeq platform (Illumina). Sequence reads were processed using Bismark (v0.24.2) on Linux OS for quality control, filtering, chimeric read detection, and alignment with the reference sequence24. Methylation patterns were detected and quantified using MethPat (version 2.1.0) on Linux OS25. To facilitate comparative analysis, methylation pattern read counts were normalized against the total sequence read counts and presented as percentages. Only sequencing reads with a Q30 score of > 80 were considered for further analysis to maintain data integrity. Samples with fewer than 3,000 sequence reads were excluded to ensure adequate sequencing depth and reliability.
Statistical analysis
All statistical analyses were performed using R version 4.4.1 (RRID:SCR_001905) environment. The Kolmogorov–Smirnov test was used to assess the normality of the data distribution. Because the neoplastic and non-neoplastic specimens were analyzed independently, paired analyses were not performed. Welch’s t-test was used for parametric comparisons between the two groups, whereas the Wilcoxon rank-sum test was used for nonparametric comparisons. The Kruskal–Wallis test was used for analyses of multiple groups. Effect sizes were computed using Hedges’ g for parametric comparisons and Cliff’s delta for nonparametric comparisons. Eta-squared (η2) values were calculated for variance analyses, and adjusted R-squared values were reported for regression models.
For categorical variables, chi-square tests were conducted, with p-values computed using the “vcd” package (version 1.4–13). Cramer’s V was calculated using the “DescTools” package (version 0.99.60) to measure the strength of associations. Overall survival (OS) rates were estimated using the Kaplan–Meier method, and survival distributions were compared using log-rank tests. Cox proportional hazards regression models were used to adjust for confounding factors, including age, sex, tissue region, tumor stage, and American Society of Anesthesiologists (ASA) score. The optimal cutoff value was determined using the surv_cutpoint function from the “survminer” package (version 0.5.0), which employs the maximally selected rank statistics method to identify the threshold that best separates the survival outcomes.
Alpha diversity was evaluated using the Shannon–Wiener diversity and Simpson dominance indices, calculated via the “vegan” package (version 2.6–4) in R. Beta diversity of methylation patterns was assessed using t-distributed stochastic neighbor embedding (t-SNE), implemented through the “Rtsne” package (version 0.17), with perplexity set to 26 and theta set to 0. K-means clustering was performed to classify the methylation pattern compositions into two groups. The optimal number of clusters (k = 2) was determined by visually inspecting the t-SNE plot. All statistical tests were two-tailed, and a p-value < 0.05 was considered statistically significant. Patients with missing survival data (n = 22) or missing death event records (n = 3) were excluded from survival analyses.
Results
MUC1 mRNA expression and its relationship with clinical characteristics and OS
The expression of MUC1 mRNA was examined to determine its association with the clinical parameters and OS in patients with CC. When comparing non-neoplastic and neoplastic region, no significant difference in MUC1 mRNA levels was observed (Wilcoxon rank-sum test: delta = -0.076, 95% CI: -0.24 to 0.09, p = 0.378; Fig. 1A). Subgroup analyses revealed that in non-neoplastic region, MUC1 mRNA expression did not differ significantly between early-stage cases (without lymph node metastasis) and advanced-stage cases (with lymph node metastasis) (delta = 0.134, 95% CI: -0.14 to 0.39, p = 0.311). A similar result was observed in neoplastic region (delta = 0.066, 95% CI: -0.21 to 0.33, p = 0.653; Fig. 1A). In addition, comparisons among anatomical subtypes revealed negligible effect sizes for MUC1 mRNA expression in both non-neoplastic (Kruskal–Wallis rank-sum test: η2 = 0.045, 95% CI: -0.01 to 0.17, p = 0.066) and neoplastic region (Kruskal–Wallis rank-sum test: η2 = 0.072, 95% CI: -0.00 to 0.23, p = 0.033), although statistical significance was observed in neoplastic region (Fig. 1B).
Fig. 1.

Association between MUC1 mRNA expression and CC prognosis. (A) Comparison of MUC1 mRNA expression levels between non-neoplastic and neoplastic region in all cases, early-stage cases without lymph node metastasis, and advanced-stage cases with lymph node metastasis. (B) Kruskal–Wallis rank-sum test comparing MUC1 mRNA expression levels among different CC subtypes (d, d + p, i, and p). The effect size was calculated using η2. (C) Prognostic comparison between groups with high- and low-MUC1 mRNA expression groups. The threshold was set to -0.57 in the non-neoplastic region and -0.33 in the neoplastic region, determined based on the value that maximized the effect size for prognosis in each respective region. CC, cholangiocarcinoma; i, intrahepatic CC; p, perihilar CC; d, distal CC.
To assess the prognostic impact of MUC1 mRNA expression, patients were stratified into low- and high-MUC1 mRNA expression groups. Patients with high-MUC1 mRNA expression (threshold = -0.328) exhibited significantly worse OS than patients with low-expression in neoplastic region (hazard ratio: HR = 0.131, 95% CI: 0.02 to 0.95, p = 0.042; Fig. 1C, right panel), whereas no significant OS differences were observed in non-neoplastic region (HR = 0.229, 95% CI: 0.03 to 1.66, p = 0.184; Fig. 1C, left panel). Regression analyses were performed to evaluate the independent prognostic value of MUC1 mRNA expression. In non-neoplastic region, neither univariate (HR = 1.194, 95% CI: 0.40 to 3.58, p = 0.751) nor multivariate (HR = 1.511, 95% CI: 0.48 to 4.71, p = 0.477) analyses demonstrated a significant association with OS. In contrast, although univariate regression in neoplastic region did not reach significance (HR = 2.937, 95% CI: 0.93 to 9.26, p = 0.066), multivariate analysis adjusting for stage, sex, and age revealed a significant association between MUC1 mRNA expression and OS (HR = 4.498, 95% CI: 1.39 to 14.57, p = 0.012; Supplementary Table S4).
In summary, MUC1 mRNA expression levels did not differ significantly between non-neoplastic and neoplastic region. However, in the neoplastic region, high MUC1 mRNA expression was significantly associated with poor OS. Multivariate analysis indicated that MUC1 mRNA expression was an independent prognostic factor for OS.
Frequency of methylation pattern of MUC1 promoter
We analyzed the diversity of methylation patterns using BSAS to elucidate the methylation landscape of the MUC1 promoter. We identified approximately 250 distinct methylation patterns and revealed complex methylation patterns in the MUC1 promoter region. The most abundant methylation pattern was the completely unmethylated pattern (5’-UUUUUUUU-3,’ where “U” represents an unmethylated CpG site), followed by the methylation pattern featured methylation at the 8th CpG site (5’-UUUUUUUM-3,’ where “M” represents a methylated CpG site). The next most prevalent methylation patterns were the completely methylated pattern (5’-MMMMMMMM-3’) and the 7th and 8th CpG site methylated pattern (5’-UUUUUUMM-3’) (Fig. 2A).
Fig. 2.

Evaluation of the alpha and beta diversity of the methylated CpG site sequential pattern in the MUC1 promoter region. (A) Bar chart showing composition of methylation pattern in non-neoplastic and neoplastic region. The colored bars indicate the 10 major and other methylation patterns. The eight methylation sites of the promoter region are noted as letters of U or M to indicate unmethylated and methylated CpG sites, respectively. The eight letters of U or M are arranged from upstream (5-prime end) to downstream (3-prime end) around the transcription start site (TSS). (B) Alpha diversity was monitored using the Simpson and Shannon indices between non-neoplastic and neoplastic region. (C) Beta diversity analysis of methylation patterns using t-SNE and k-means clustering. t-SNE analysis was performed to evaluate the beta diversity of methylation pattern composition in non-neoplastic and neoplastic region. Each point represents an individual sample, with blue dots indicating non-neoplastic region and red dots indicating neoplastic region. K-means clustering (k = 2) identified two distinct clusters, A and B, which are outlined by convex hulls. A contour plot illustrates the spatial distribution of cluster centers and local density variations within the t-SNE plot. (D) Comparison of the abundance of completely unmethylated and completely methylated methylation patterns between clusters identified by k-means clustering on the t-SNE plot. TSS, transcriptional start site; t-SNE, t-distributed stochastic neighbor embedding; DIM, dimension.
Alpha diversity was evaluated to determine whether significant differences in heterogeneity of methylation patterns existed between the neoplastic and non-neoplastic region. The non-neoplastic region exhibited significantly higher alpha diversity indices than the neoplastic region, as measured by the Shannon index (delta = 0.436; 95% CI: 0.28 to 0.57; p < 0.001) and the Simpson index (delta = 0.451; 95% CI: 0.30 to 0.58; p < 0.001) (Fig. 2B). This pattern remained consistent when patients were divided into early- and advanced-stage groups (Supplementary Figure S1A). However, when comparing early-stage and advanced-stage cases, no significant differences in alpha diversity were observed in either the non-neoplastic or neoplastic region (Supplementary Figure S1B). In both the neoplastic and non-neoplastic region, the Shannon index showed no significant differences among the four anatomical subtypes. Although the Simpson index differed significantly in neoplastic region, the magnitude of the difference was very small, and the effect size was not significant (Kruskal–Wallis rank-sum test; η2 = 0.059; 95% CI: -0.01 to 0.18; p = 0.040; Supplementary Figure S1C). Analysis of methylation patterns with a median abundance > 1% revealed that methylation pattern in which all CpG sites are unmethylated exhibited markedly higher abundance in neoplastic region than in non-neoplastic region. In contrast, methylation patterns with methylation near the transcription start site, those with a high degree of methylation, and fully methylated methylation patterns were significantly more abundant in the non-neoplastic region. Methylation patterns displaying significant differences between non-neoplastic and neoplastic region are summarized in Supplementary Table S5.
In summary, BSAS of the MUC1 promoter region identified approximately 250 distinct methylation patterns, indicating a complex methylation landscape. Non-neoplastic region showed significantly higher alpha diversity of methylation patterns than neoplastic region. Completely unmethylated methylation patterns are more abundant in neoplastic region, whereas highly methylated methylation patterns are more abundant in non-neoplastic region.
Beta diversity analysis of methylation pattern composition
To investigate the overall methylation pattern diversity of the MUC1 promoter, we performed beta diversity (between-sample diversity) analysis of the composition of methylation pattern between non-neoplastic and neoplastic region using t-SNE. Based on the t-SNE results, k-means clustering identified two distinct clusters (A and B; Fig. 2C). Cluster A exhibited a significantly lower abundance of the completely unmethylated methylation pattern (5’-UUUUUUUU-3’) compared to Cluster B (delta = -0.847, 95% CI: -0.91 to -0.65, p < 0.001; Fig. 2D). Conversely, Cluster A showed a significantly higher abundance of the completely methylated methylation pattern (5’-MMMMMMMM-3’) than Cluster B (delta = 0.621, 95% CI: 0.51 to 0.75, p < 0.001; Fig. 2D). Chi-square tests revealed a significant distribution bias between non-neoplastic and neoplastic region (Cramer’s V = 0.338, 95% CI: 0.20 to 0.48, p < 0.001), indicating that region of tissue is an important factor influencing methylation diversity (Supplementary Table S6). However, no significant differences in clinical characteristics, such as sex, age, or presence of lymph node metastasis, were found between the clusters. Regarding MUC1 mRNA expression, Cluster A showed significantly lower expression than Cluster B in both non-neoplastic (delta = -0.304, 95% CI: -0.53 to -0.04, p = 0.036) and neoplastic region (delta = -0.438, 95% CI: -0.65 to -0.17, p = 0.002). Kaplan–Meier survival analysis revealed no significant differences in prognosis between clusters across both tissue regions (Supplementary Figure S2).
In summary, the beta diversity analysis using t-SNE and k-means clustering identified two distinct k-means clusters that were primarily distinguished between non-neoplastic and neoplastic region. Cluster A, enriched in the non-neoplastic region, was characterized by a lower abundance of unmethylated patterns and a higher abundance of methylated patterns and showed lower MUC1 mRNA expression. While reflecting tissue-specific composition of methylation pattern biases and MUC1 mRNA expression differences, these k-means clusters were not significantly associated with OS.
Alteration of methylation patterns composition and DNA methylation-related enzymes
To assess whether the expression of DNA methylation-related enzymes TET1, TET2, TET3, Dnmt1, and Dnmt3a affected the composition of methylation patterns, distance-based redundancy analysis (dbRDA) was conducted. Intersample distances were calculated using the Bray–Curtis dissimilarity index (Table 1). In the non-neoplastic region, none of these enzymes had a significant impact on the composition of methylation pattern. In contrast, in neoplastic region, TET3 mRNA expression demonstrated a significant effect. In univariate regression analysis, TET3 mRNA expression showed a significant effect (F = 4.364, Cohen’s f2 = 0.064, p = 0.010), which persisted in multivariate regression analysis (F = 5.045, η2 = 0.586, p = 0.006). These findings suggest that TET3 expression is associated with variations in methylation pattern composition within tumor tissues, indicating a possible regulatory relationship.
Table 1.
Distance-based redundancy analysis of MSP composition.
| Factor | F | Univariate Cohen’s f2 |
p | F | Multivariate Eta2 |
p |
|---|---|---|---|---|---|---|
| Neoplastic region | ||||||
| TET1 | 1.279 | 0.019 | 0.254 | 1.340 | 0.156 | 0.241 |
| TET2 | 0.367 | 0.005 | 0.783 | 0.900 | 0.105 | 0.398 |
| TET3 | 4.364 | 0.064 | 0.010 | 5.045 | 0.586 | 0.006 |
| Dnmt1 | 0.106 | 0.002 | 0.991 | 0.415 | 0.048 | 0.727 |
| Dnmt3a | 0.550 | 0.008 | 0.608 | 0.909 | 0.106 | 0.401 |
| Non-neoplastic region | ||||||
| TET1 | 1.645 | 0.024 | 0.150 | 1.606 | 0.409 | 0.162 |
| TET2 | 0.541 | 0.008 | 0.697 | 0.364 | 0.093 | 0.874 |
| TET3 | 0.388 | 0.006 | 0.861 | 0.369 | 0.094 | 0.875 |
| Dnmt1 | 0.826 | 0.012 | 0.471 | 1.290 | 0.329 | 0.250 |
| Dnmt3a | 0.626 | 0.009 | 0.613 | 0.296 | 0.075 | 0.935 |
MSP Methylation Site Sequential Pattern, dbRDA distance-based redundancy analysis. dbRDA is a multivariate statistical method used to examine the relationship between MSP composition and DNA methylation-related enzyme expression. Effect sizes are indicated as eta2 for multivariate dbRDA and Cohen’s f2 for univariate dbRDA. Eta2 represents the proportion of variance in MSP composition explained by the enzyme expression in multivariate analysis. Cohen’s f2 represents the effect size of enzyme expression on MSP composition in univariate analysis, with values of 0.02, 0.15, and 0.35 representing small, medium, and large effects, respectively. F values are F-statistics from dbRDA. P values are from F-tests in dbRDA.
Linear regression analyses were conducted to assess the relationship between the expression of DNA methylation-related enzymes and the abundance of the fully unmethylated pattern (5'-UUUUUUUU-3'), which exhibited the highest mean value among individual methylation patterns. In the non-neoplastic region, none of these enzymes was significantly associated with the abundance of fully unmethylated pattern (Supplementary Table S7). By contrast, in the neoplastic region, TET3 mRNA expression was significantly associated with abundance of methylation pattern. In univariate linear regression analysis, TET3 mRNA expression demonstrated a significant effect (Cohen’s f2 = 0.108, 95% CI: 0.01 to 0.34, p = 0.009), and this association remained significant in multivariate regression analysis (Cohen’s f2 = 0.131, 95% CI: 0.01 to 0.42, p = 0.005).
Distance-based redundancy analysis revealed that TET3 mRNA expression significantly affected composition of methylation pattern in neoplastic region, but not in non-neoplastic region, when intersample distances were calculated using the Bray–Curtis dissimilarity index. Linear regression analysis further showed that TET3 mRNA expression in the neoplastic region is significantly associated with the abundance of the completely unmethylated pattern (5'-UUUUUUUU-3'). These findings suggest that TET3 mRNA expression is significantly associated with the modulation of MUC1 promoter methylation patterns in the neoplastic region.
Methylation patterns and MUC1 mRNA expression
To elucidate the regulatory mechanisms underlying MUC1 mRNA expression, we examined the correlation between the methylation pattern profiles and mRNA expression levels (Supplementary Table S8). Among the identified methylation patterns, the completely unmethylated pattern (5'-UUUUUUUU-3') and the completely methylated pattern (5'-MMMMMMMM-3') were the most prevalent, constituting over 6% and 27% of the total composition of methylation pattern, respectively. The abundance of the completely unmethylated pattern was significantly and positively correlated with MUC1 mRNA expression in both non-neoplastic region (r = 0.279, 95% CI: 0.05 to 0.48, p = 0.017) and neoplastic region (r = 0.386, 95% CI: 0.17 to 0.57, p = 0.001). In contrast, several methylation patterns with methylation near the transcription start site exhibited a significant negative correlation with MUC1 mRNA expression, whereas completely methylated pattern did not show a significant correlation with mRNA expression in either region.
To further investigate transcriptional regulation, we evaluated the relationship between MUC1 mRNA expression, abundance of completely unmethylated pattern, and microenvironment stress markers using multiple regression analysis (Fig. 3). CA9 mRNA, which was upregulated under hypoxic and acidic conditions, demonstrated a significant positive correlation with MUC1 mRNA expression in both neoplastic (adjusted R2 = 0.389, p < 0.001) and non-neoplastic region (adjusted R2 = 0.363, p < 0.001). Similarly, XBP1 mRNA, which is activated during the late phase of ER stress, expression exhibited a significant positive correlation in both tissue regions (adjusted R2 = 0.357, p < 0.001 in the neoplastic region, and adjusted R2 = 0.329, p < 0.001 in the non-neoplastic region). In contrast, ACSS2, a marker of metabolic stress, and GRP78, an early ER stress marker, mRNA expression exhibited only weak positive correlations with MUC1 mRNA expression in the neoplastic region (adjusted R2 = 0.171, p < 0.001, and adjusted R2 = 0.127, p = 0.004, respectively). No significant correlations were observed in non-neoplastic region. These results indicate that the regulation of MUC1 mRNA expression depends not only on promoter unmethylation, but also on the activation of transcription factors that bind to unmethylated promoters under stress conditions, revealing distinct regulatory dynamics between neoplastic and non-neoplastic region.
Fig. 3.
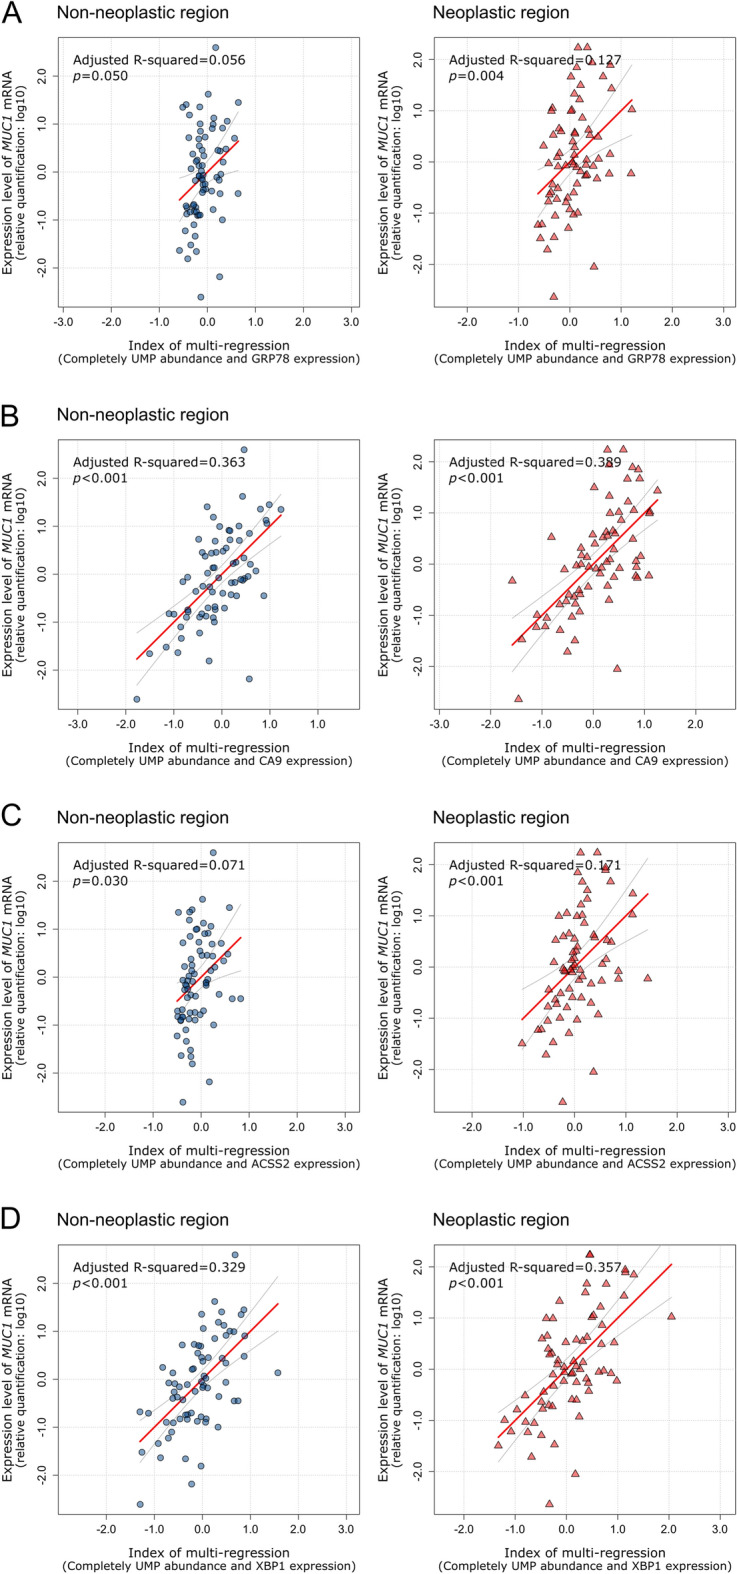
Multivariate Cox regression analysis of MUC1 mRNA expression. Multivariate Cox regression analysis of MUC1 mRNA expression was performed based on the expression of microenvironment stress marker genes and abundance of completely unmethylated methylation patterns. (A) Multivariate Cox regression analysis of GRP78 mRNA expression. The index was calculated as follows: non-neoplastic region, index = 0.08 + 0.37 × UMP + -0.07 × GRP78; neoplastic region, index = -0.08 + 0.38 × UMP + 0.06 × GRP78. (B) Multivariate Cox regression analysis of CA9 mRNA expression. The index was calculated as follows: non-neoplastic region, index = 0.14 + 0.38 × UMP + 0.56 × CA9; neoplastic region, index = -0.07 + 0.21 × UMP + 0.53 × CA9. (C) Multivariate Cox regression analysis based on ACSS2 mRNA expression. The index was calculated as follows: non-neoplastic region, index = 0.06 + 0.35 × UMP + 0.14 × ACSS2; neoplastic region, index = -0.05 + 0.32 × UMP + 0.22 × ACSS2. (D) Multivariate Cox regression analysis of XBP1 mRNA expression. The index was calculated as follows: non-neoplastic region, index = 0.02 + 0.28 × UMP + 0.56 × XBP1; neoplastic region, index = 0.00 + 0.21 × UMP + 0.48 × XBP1. ER, endoplasmic reticulum; UMP, abundance of completely unmethylated CpG site sequence pattern.
Alteration of methylation pattern and prognostic significance
To determine the prognostic relevance of specific methylation patterns, we analyzed the association between individual abundance of methylation patterns and OS in non-neoplastic and neoplastic region (Supplementary Table S9). In non-neoplastic region, pattern, 5′-UUUUUUMU-3′ showed no significant difference in OS. In contrast, patterns, 5′-UUUUMUUU-3′ and 5′-MUMMMMMM-3′ were significantly associated with favorable OS, while patterns, 5’-UUUUMUMU-3’, 5’-UUUUMMMU-3’, and 5’-MUUUUUUU-3’ were significantly associated with poor OS. However, in the neoplastic region, only pattern, 5’-UUUUUUMU-3’ demonstrated a significant association, indicating poorer OS. Notably, no single methylation pattern consistently predicted OS across both tissue regions, suggesting a tissue-dependent prognostic value and the absence of a universally prognostic methylation pattern for CC.
To further evaluate the prognostic effect of the overall alteration in composition of methylation pattern, we categorized the samples into Group A and Group B using a t-SNE-based linear group classification (Fig. 4A). Comparisons of clinical characteristics revealed no significant differences between the groups in terms of sex, age, ASA score, or tumor, node, and metastasis stage in either tissue region (Supplementary Table S10). However, neoplastic region in Group A showed significantly higher MUC1 mRNA expression than Group B (Hedge’s g = 0.318, 95% CI: 0.02 to 0.56, p = 0.024; Fig. 4B, right panel). Survival analysis indicated that Group A exhibited significantly poor OS than Group B in both non-neoplastic (HR = 0.358, 95% CI: 0.11 to 0.95, log-rank p = 0.039) and neoplastic region (HR = 0.291, 95% CI: 0.06 to 0.94, log-rank p = 0.037) (Fig. 4C). Multivariate analysis confirmed group classification as an independent prognostic factor (HR = 0.343, 95% CI: 0.14 to 0.85, p = 0.021), alongside age and lymph node metastasis, while sex and ASA score were not significant (Table 2).
Fig. 4.

Association between beta diversity of methylated CpG site sequential patterns and CC prognosis. Two groups (A and B) were classified using a linear boundary (Dim2 = -21.5 × Dim1 + 30.0) on the t-SNE plot, representing the beta diversity of methylation patterns. (B) Comparison of MUC1 mRNA expression levels between groups identified using the t-SNE plot. (C) Cox proportional hazards regression analysis comparing OS between Groups A and B in non-neoplastic and neoplastic region. t-SNE, t-distributed stochastic neighbor embedding; DIM, dimension; OS, overall survival.
Table 2.
Univariate and multivariate cox regression analysis of factors associated with overall survival.
| Factor | z | univariate | p | z | multivariate | p | ||
|---|---|---|---|---|---|---|---|---|
| HR | 95% CI | HR | 95% CI | |||||
| Group | -2.716 | 0.297 | 0.12 to 0.71 | 0.007 | -2.313 | 0.343 | 0.14 to 0.8 | 0.021 |
| Age | 3.412 | 1.084 | 1.04 to 1.14 | 0.001 | 2.431 | 1.089 | 1.02 to 1.17 | 0.015 |
| Sex | -1.052 | 0.687 | 0.34 to 1.38 | 0.293 | 0.237 | 1.098 | 0.51 to 2.38 | 0.813 |
| region | -0.206 | 0.934 | 0.49 to 1.78 | 0.837 | -0.227 | 0.928 | 0.49 to 1.77 | 0.821 |
| Metastasis | -4.250 | 0.233 | 0.12 to 0.46 | <0.001 | -3.032 | 0.337 | 0.17 to 0.68 | 0.002 |
| ASA Score | 2.784 | 1.951 | 1.22 to 3.12 | 0.005 | -0.001 | 1.000 | 0.53 to 1.90 | 0.999 |
HR, hazard ratio, CI, confidence interval, STG, pathological stage, Metastasis, lymph node metastasis, ASA score American Society of Anesthesiologists score. Number of events = 53. Results are from Cox proportional hazards regression analysis for overall survival. 'z' statistics and 'p' values were calculated using Cox regression. ‘Univariate’ refers to univariate Cox regression, and ‘multivariate’ refers to multivariate Cox regression.
In summary, t-SNE-based linear group classification, distinct from the k-means clusters and independent of tissue region, effectively stratified patients by OS, highlighting the prognostic significance of the overall alteration related to prognosis.
Discussion
MUC1, a transmembrane glycoprotein, is aberrantly expressed in CC and is consistently associated with aggressive tumor behavior and poor prognosis17,19,26,27. Our study reinforces this notion by demonstrating that elevated MUC1 mRNA expression in the neoplastic region was significantly correlated with reduced OS. Conversely, the absence of such a correlation in non-neoplastic region underscores the context-specific oncogenic role of MUC1 in CC, suggesting that its prognostic significance is specific to neoplastic region. To elucidate the regulatory mechanisms underlying MUC1 overexpression in CC, we focused on epigenetic modifications, particularly MUC1 promoter methylation.
DNA methylation, especially within gene promoter regions, is a critical epigenetic mechanism that typically represses gene transcription through histone structural changes and inhibition of transcription factor binding28,29. However, the precise role of promoter methylation in regulating MUC1 mRNA expression in CC remains unclear. Here, we unveiled the complex methylation landscape of the MUC1 promoter and identified approximately 250 distinct methylation patterns using BSAS. We observed significantly higher alpha diversity of methylation patterns in the non-neoplastic region than in the neoplastic region, suggesting that normal bile duct epithelial cells maintain a heterogeneous MUC1 promoter methylation profile that may be crucial for flexible gene regulation. In contrast, tumorigenesis appears to select for specific and less diverse methylation patterns, potentially contributing to the aberrant MUC1 expression observed in CC30,31.
To investigate the link between promoter methylation and MUC1 expression, we analyzed the correlation between abundance of methylation pattern and MUC1 mRNA expression. Our findings revealed a positive correlation between MUC1 promoter demethylation, including the abundance of completely unmethylated methylation patterns and increased MUC1 mRNA levels in both neoplastic and non-neoplastic region, indicating that promoter demethylation is associated with transcriptional activation of MUC1 expression. However, multivariate analyses revealed that MUC1 mRNA expression is not solely determined by promoter demethylation but is also influenced by stress-responsive transcription factors, as measured by alteration in CA9 and XBP1 expression. This supports a dual-layered regulatory model for MUC1 mRNA expression in CC, wherein promoter demethylation permits transcription, and stress-induced activation further amplifies expression, accounting for distinct dynamics in tumor versus normal tissues29,32. This model is further supported by our previous findings in pancreatic cancer cells, where the upregulation of MUC1 mRNA expression under hypoxia was dependent on promoter demethylation33.
Given that promoter demethylation may contribute to MUC1 mRNA expression, we explored the association between expression levels of the TET and Dnmt family enzymes and MUC1 promoter methylation patterns, which are key mediators of DNA methylation34. dbRDA revealed that TET3 mRNA expression modulates composition of methylation pattern, specifically in the neoplastic region. Furthermore, linear regression analysis demonstrated a significant positive correlation between TET3 mRNA expression and the abundance of the completely unmethylated pattern (5'-UUUUUUUU-3') in neoplastic region. These findings suggest that TET3 mRNA expression is significantly associated with MUC1 promoter methylation patterns in CC, potentially reflecting a regulatory relationship. Although TET3 is essential for normal development and differentiation and is generally considered a tumor suppressor, its role in cancer is increasingly recognized as complex and context-dependent35,36. TET3 exhibits tumor-suppressive activity in esophageal squamous cell carcinoma but paradoxically promotes malignancy in glioblastoma and breast cancer37,38. Although the precise functional consequences of TET3 activity and its interaction with MUC1 in CC pathogenesis warrant further investigation, the current study suggests that TET3 expression is positively associated with promoter demethylation of oncogenic MUC1, which may influence its expression in CC.
Moving beyond regulatory mechanisms, we sought to determine the prognostic significance of MUC1 promoter methylation patterns in CC. Analysis of individual methylation patterns revealed tissue-specific associations with prognosis, indicating that the prognostic value of specific methylation patterns differs between the non-neoplastic and neoplastic region. Importantly, no single methylation pattern consistently predicted OS across both tissue regions, suggesting the limited utility of individual methylation patterns as robust and universal prognostic markers. Notably, individual methylation patterns with prognostic value did not consistently correlate with MUC1 mRNA levels (Supplementary Tables S8 and S9). This finding is consistent with our multivariate analysis (Fig. 3), which suggested that high MUC1 expression likely requires both promoter demethylation and co-activation by stress-responsive factors. This layered regulation may obscure the impact of any single pattern. Therefore, when we shifted our focus from individual methylation patterns to overall composition of methylation pattern by analyzing beta diversity using t-SNE and linear group classification, a more robust prognostic association emerged. The linear group classification of t-SNE identified a distinct group that was associated with significantly favorable OS in both the non-neoplastic and neoplastic region. Multivariate analysis confirmed that the composition of methylation pattern-based classification was an independent prognostic factor beyond the established clinicopathological parameters. This highlights the potential of considering the global epigenetic landscape as reflected by compositional diversity of methylation pattern to improve prognostic risk stratification in CC39,40. Furthermore, similar alterations in composition of methylation pattern were observed in both non-neoplastic and neoplastic region, suggesting that MUC1 promoter methylation diversity could potentially be used to screen for high-risk CC patients with poor prognosis. This raises the possibility that assessing methylation heterogeneity in cytological specimens such as bile juice, including both non-neoplastic and neoplastic cells, might enable less invasive prognostic screening and contribute to surgical decision-making. Such approaches may be particularly valuable for patients with unresectable tumors or those undergoing preoperative evaluation, providing opportunities to tailor treatment strategies based on molecular risk profiles. This study has several limitations. Our findings are based on clinical correlations, and a direct causal link between specific methylation patterns and transcriptional activity was not functionally validated. Future studies employing reporter assays, engineered to maintain specific methylation patterns under simulated tumor microenvironment conditions, would be necessary to dissect these precise regulatory mechanisms. From a clinical biomarker perspective, MUC1 mRNA analysis is limited as a robust biomarker because its prognostic value was confined to pure neoplastic tissues and it relies on unstable, transient RNA molecules. In contrast, DNA methylation profiling offers a more robust alternative, utilizing a stable analyte (DNA) that reflects a long-term regulatory state. Most importantly, since the prognostic value of the methylation pattern composition was evident in both neoplastic and non-neoplastic tissues, this approach is uniquely suited for mixed-cell samples where signals from all cells are informative. Clarifying the prognosis for patients with discordant classifications between tissues will be a key next step in refining this biomarker. This overall potential suggests that developing robust, less invasive screening methods is a viable avenue that will become increasingly accessible with advancing sequencing technologies.
Conclusion
In conclusion, this study demonstrated that the structural diversity of MUC1 promoter methylation patterns, rather than average methylation levels, is significantly associated with MUC1 mRNA expression and clinical prognosis in cholangiocarcinoma. TET3 expression correlated with promoter demethylation exclusively in the neoplastic region, suggesting a potential link to tumor-specific epigenetic dynamics. Notably, the classification based on methylation pattern composition stratified prognosis independently of conventional clinical factors, underscoring its potential utility as a novel epigenetic biomarker. Moreover, the observation that methylation pattern shifts also occur in non-neoplastic regions suggests that this approach may be applicable to less invasive samples, such as cytological specimens or liquid biopsies. These insights provide a foundation for developing clinically relevant epigenetic stratification tools that can support precision medicine in cholangiocarcinoma.
Supplementary Information
Acknowledgements
We would like to thank Editage (www.editage.jp) for English language editing.
Abbreviations
- CC
Cholangiocarcinoma
- MUC
Mucin
- TET
Ten-eleven translocation methylcytosine dioxygenase
- Dnmt
DNA methyltransferase
- GRP78
78-KD glucose-regulated protein
- CA9
Carbonic anhydrase IX
- ACSS
Acetyl-CoA synthetase
- XBP
X-box binding protein
- t-SNE
t-Distributed stochastic neighbor embedding
- HR
Hazard ratio
- CI
95% confidence interval
Author contributions
SY and AT contributed to conceptualization and design of the study. IK, MH, MK, HN, TT, MM, and TO resources and/or collected data. SY, KM, TH, and TF were responsible for data curation. SY and TS were responsible for data analysis. SY, MH, and AT provided funding, resources and supervised the study. SY draft the manuscript. SY, and AT contributed to review and editing of the manuscript. All authors read and approved the final manuscript.
Funding
This study was supported in part by a grant from Grants-in-Aid for Scientific Research on Scientific Research (C) 24K10385 (C) 21K07222 to S. Yokoyama and Scientific Research (C) 25K19910 to M. Murakami from the Ministry of Education, Science, Sports, Culture and Technology, Japan and by the Pancreas Research Foundation of Japan (S. Yokoyama), and by Research Support Project for Life Science and Drug Discovery (Basis for Supporting Innovative Drug Discovery and Life Science Research (BINDS)) from AMED under Grant Number .JP24ama121054 (T. Furukawa). The funders had no role in study design, data collection and analysis, decision to publish, or the preparation of the manuscript.
Data availability
The datasets generated and/or analyzed during the current study are not publicly available due to ethical restrictions related to human subject research. Access to sequencing and gene expression data is restricted by the institutional ethics committee but may be available from the corresponding author upon reasonable request and with approval from the relevant ethics committee. Data are located in controlled access data storage at the Department of Pathology, Kagoshima University Graduate School of Medical and Dental Sciences.
Declarations
Competing interests
The authors declare no competing interests.
Ethical approval and consent to participate
This study was conducted in accordance with the principles of the Declaration of Helsinki. The ethics committee of Kagoshima University Hospital (revised 26–145) approved the IRB application titled “Establishment of a System for the Early Diagnosis and Staging of Pancreatobiliary Cancers Using Pancreatic Juice, Bile, and Duodenal Juice,” which covers the collection, storage, and research use of the tissue samples. Written informed consent was obtained from each patient.
Footnotes
Publisher’s note
Springer Nature remains neutral with regard to jurisdictional claims in published maps and institutional affiliations.
References
- 1.Popescu, I. & Dumitrascu, T. Curative-intent surgery for hilar cholangiocarcinoma: prognostic factors for clinical decision making. Langenbecks Arch. Surg.399, 693–705. 10.1007/s00423-014-1210-x (2014). [DOI] [PubMed] [Google Scholar]
- 2.Esmail, A. et al. Cholangiocarcinoma: the current status of surgical options including liver transplantation. Cancers (Basel)10.3390/cancers16111946 (2024). [DOI] [PMC free article] [PubMed] [Google Scholar]
- 3.DeOliveira, M. L. et al. Cholangiocarcinoma: thirty-one-year experience with 564 patients at a single institution. Ann. Surg.245, 755–762. 10.1097/01.sla.0000251366.62632.d3 (2007). [DOI] [PMC free article] [PubMed] [Google Scholar]
- 4.Lamarca, A., Edeline, J. & Goyal, L. How I treat biliary tract cancer. ESMO Open7, 100378. 10.1016/j.esmoop.2021.100378 (2022). [DOI] [PMC free article] [PubMed] [Google Scholar]
- 5.Cillo, U. et al. Surgery for cholangiocarcinoma. Liver Int.39(Suppl 1), 143–155. 10.1111/liv.14089 (2019). [DOI] [PMC free article] [PubMed] [Google Scholar]
- 6.Cidon, E. U. resectable cholangiocarcinoma: reviewing the role of adjuvant strategies. Clin. Med. Insights Oncol.10, 43–48. 10.4137/CMO.S32821 (2016). [DOI] [PMC free article] [PubMed] [Google Scholar]
- 7.Banales, J. M. et al. Cholangiocarcinoma 2020: the next horizon in mechanisms and management. Nat. Rev. Gastroenterol. Hepatol.17, 557–588. 10.1038/s41575-020-0310-z (2020). [DOI] [PMC free article] [PubMed] [Google Scholar]
- 8.van Vugt, J. L. A. et al. The prognostic value of portal vein and hepatic artery involvement in patients with perihilar cholangiocarcinoma. HPB (Oxford)20, 83–92. 10.1016/j.hpb.2017.08.025 (2018). [DOI] [PubMed] [Google Scholar]
- 9.Farges, O. et al. Multicentre European study of preoperative biliary drainage for hilar cholangiocarcinoma. Br. J. Surg.100, 274–283. 10.1002/bjs.8950 (2013). [DOI] [PubMed] [Google Scholar]
- 10.Sota, Y. et al. Recurrent cholangiocarcinoma with long-term survival by multimodal treatment: A case report. Mol. Clin. Oncol.14, 72. 10.3892/mco.2021.2234 (2021). [DOI] [PMC free article] [PubMed] [Google Scholar]
- 11.Bednarsch, J. et al. Compelling long-term results for liver resection in early cholangiocarcinoma. J. Clin. Med.10.3390/jcm10132959 (2021). [DOI] [PMC free article] [PubMed] [Google Scholar]
- 12.Mantas, A. et al. Clinical features and prediction of long-term survival after surgery for perihilar cholangiocarcinoma. PLoS ONE19, e0304838. 10.1371/journal.pone.0304838 (2024). [DOI] [PMC free article] [PubMed] [Google Scholar]
- 13.Hollingsworth, M. A. & Swanson, B. J. Mucins in cancer: protection and control of the cell surface. Nat. Rev. Cancer4, 45–60. 10.1038/nrc1251 (2004). [DOI] [PubMed] [Google Scholar]
- 14.Kufe, D. W. Mucins in cancer: function, prognosis and therapy. Nat. Rev. Cancer9, 874–885. 10.1038/nrc2761 (2009). [DOI] [PMC free article] [PubMed] [Google Scholar]
- 15.Kaur, S., Kumar, S., Momi, N., Sasson, A. R. & Batra, S. K. Mucins in pancreatic cancer and its microenvironment. Nat. Rev. Gastroenterol. Hepatol.10, 607–620. 10.1038/nrgastro.2013.120 (2013). [DOI] [PMC free article] [PubMed] [Google Scholar]
- 16.Yonezawa, S., Goto, M., Yamada, N., Higashi, M. & Nomoto, M. Expression profiles of MUC1, MUC2, and MUC4 mucins in human neoplasms and their relationship with biological behavior. Proteomics8, 3329–3341. 10.1002/pmic.200800040 (2008). [DOI] [PubMed] [Google Scholar]
- 17.Yonezawa, S. et al. Mucins in human neoplasms: clinical pathology, gene expression and diagnostic application. Pathol. Int.61, 697–716. 10.1111/j.1440-1827.2011.02734.x (2011). [DOI] [PubMed] [Google Scholar]
- 18.Yonezawa, S. & Sato, E. Expression of mucin antigens in human cancers and its relationship with malignancy potential. Pathol. Int.47, 813–830. 10.1111/j.1440-1827.1997.tb03713.x (1997). [DOI] [PubMed] [Google Scholar]
- 19.Sasaki, M., Nakanuma, Y. & Kim, Y. S. Characterization of apomucin expression in intrahepatic cholangiocarcinomas and their precursor lesions: an immunohistochemical study. Hepatology24, 1074–1078. 10.1002/hep.510240516 (1996). [DOI] [PubMed] [Google Scholar]
- 20.Yokoyama, S. et al. Aberrant methylation of MUC1 and MUC4 promoters are potential prognostic biomarkers for pancreatic ductal adenocarcinomas. Oncotarget7, 42553–42565. 10.18632/oncotarget.9924 (2016). [DOI] [PMC free article] [PubMed] [Google Scholar]
- 21.Yokoyama, S. et al. Predicted prognosis of patients with pancreatic cancer by machine learning. Clin. Cancer Res.26, 2411–2421. 10.1158/1078-0432.CCR-19-1247 (2020). [DOI] [PubMed] [Google Scholar]
- 22.Yokoyama, S. et al. Sequential evaluation of MUC promoter methylation using next-generation sequencing-based custom-made panels in liquid-based cytology specimens of pancreatic cancer. Diagn. Cytopathol.50, 499–507. 10.1002/dc.25022 (2022). [DOI] [PubMed] [Google Scholar]
- 23.Yokoyama, S., Matsuo, K. & Tanimoto, A. Methylation-specific electrophoresis. Methods Mol. Biol.2763, 259–268. 10.1007/978-1-0716-3670-1_22 (2024). [DOI] [PubMed] [Google Scholar]
- 24.Krueger, F. & Andrews, S. R. Bismark: a flexible aligner and methylation caller for bisulfite-seq applications. Bioinformatics27, 1571–1572. 10.1093/bioinformatics/btr167 (2011). [DOI] [PMC free article] [PubMed] [Google Scholar]
- 25.Wong, N. C. et al. MethPat: a tool for the analysis and visualisation of complex methylation patterns obtained by massively parallel sequencing. BMC Bioinform.17, 98. 10.1186/s12859-016-0950-8 (2016). [DOI] [PMC free article] [PubMed] [Google Scholar]
- 26.Zhang, G., Zheng, G., Zhang, H. & Qiu, L. MUC1 induces the accumulation of Foxp3(+) Treg cells in the tumor microenvironment to promote the growth and metastasis of cholangiocarcinoma through the EGFR/PI3K/Akt signaling pathway. Int. Immunopharmacol.118, 110091. 10.1016/j.intimp.2023.110091 (2023). [DOI] [PubMed] [Google Scholar]
- 27.Dadgar, N. et al. Advancing cholangiocarcinoma care: insights and innovations in T cell therapy. Cancers (Basel)10.3390/cancers16183232 (2024). [DOI] [PMC free article] [PubMed] [Google Scholar]
- 28.Tahghighi, A. et al. Epigenetic marvels: exploring the landscape of colorectal cancer treatment through cutting-edge epigenetic-based drug strategies. Clin. Epigenetics17, 34. 10.1186/s13148-025-01844-w (2025). [DOI] [PMC free article] [PubMed] [Google Scholar]
- 29.Kaluscha, S. et al. Evidence that direct inhibition of transcription factor binding is the prevailing mode of gene and repeat repression by DNA methylation. Nat. Genet.54, 1895–1906. 10.1038/s41588-022-01241-6 (2022). [DOI] [PMC free article] [PubMed] [Google Scholar]
- 30.Robertson, K. D. DNA methylation and human disease. Nat. Rev. Genet.6, 597–610. 10.1038/nrg1655 (2005). [DOI] [PubMed] [Google Scholar]
- 31.Sproul, D. et al. Transcriptionally repressed genes become aberrantly methylated and distinguish tumors of different lineages in breast cancer. Proc. Natl. Acad. Sci. U. S. A.108, 4364–4369. 10.1073/pnas.1013224108 (2011). [DOI] [PMC free article] [PubMed] [Google Scholar]
- 32.Urra, H., Aravena, R., Gonzalez-Johnson, L. & Hetz, C. The UPRising connection between endoplasmic reticulum stress and the tumor microenvironment. Trends Cancer10, 1161–1173. 10.1016/j.trecan.2024.09.011 (2024). [DOI] [PubMed] [Google Scholar]
- 33.Kitamoto, S. et al. MUC1 enhances hypoxia-driven angiogenesis through the regulation of multiple proangiogenic factors. Oncogene32, 4614–4621. 10.1038/onc.2012.478 (2013). [DOI] [PubMed] [Google Scholar]
- 34.Moore, L. D., Le, T. & Fan, G. DNA methylation and its basic function. Neuropsychopharmacology38, 23–38. 10.1038/npp.2012.112 (2013). [DOI] [PMC free article] [PubMed] [Google Scholar]
- 35.Scott-Browne, J. P., Lio, C. J. & Rao, A. TET proteins in natural and induced differentiation. Curr. Opin. Genet.Dev.46, 202–208. 10.1016/j.gde.2017.07.011 (2017). [DOI] [PMC free article] [PubMed] [Google Scholar]
- 36.Jeschke, J., Collignon, E. & Fuks, F. Portraits of TET-mediated DNA hydroxymethylation in cancer. Curr. Opin. Genet. Dev.36, 16–26. 10.1016/j.gde.2016.01.004 (2016). [DOI] [PubMed] [Google Scholar]
- 37.Zhu, M., Shi, B., Li, C. & Xu, S. TET3 governs malignant behaviors and unfavorable prognosis of esophageal squamous cell carcinoma by activating the PI3K/AKT/GSK3beta/beta-catenin pathway. Open Med. (Wars)17, 1883–1895. 10.1515/med-2022-0601 (2022). [DOI] [PMC free article] [PubMed] [Google Scholar]
- 38.Liu, Y. et al. ncRNAs-mediated overexpression of TET3 predicts unfavorable prognosis and correlates with immunotherapy efficacy in breast cancer. Heliyon10, e24855. 10.1016/j.heliyon.2024.e24855 (2024). [DOI] [PMC free article] [PubMed] [Google Scholar]
- 39.Kalra, A. & Meltzer, S. J. The role of DNA methylation in gastrointestinal disease: an expanded review of malignant and nonmalignant gastrointestinal diseases. Gastroenterology168, 245–266. 10.1053/j.gastro.2024.07.001 (2025). [DOI] [PMC free article] [PubMed] [Google Scholar]
- 40.Verma, M. et al. Epigenetic research in cancer epidemiology: trends, opportunities, and challenges. Cancer Epidemiol. Biomarkers Prev.23, 223–233. 10.1158/1055-9965.EPI-13-0573 (2014). [DOI] [PMC free article] [PubMed] [Google Scholar]
Associated Data
This section collects any data citations, data availability statements, or supplementary materials included in this article.
Supplementary Materials
Data Availability Statement
The datasets generated and/or analyzed during the current study are not publicly available due to ethical restrictions related to human subject research. Access to sequencing and gene expression data is restricted by the institutional ethics committee but may be available from the corresponding author upon reasonable request and with approval from the relevant ethics committee. Data are located in controlled access data storage at the Department of Pathology, Kagoshima University Graduate School of Medical and Dental Sciences.