

ABSTRACT
Extracellular vesicles (EVs) are biological nanovectors that retain molecular signatures of their cells of origin and mediate intercellular communication, resulting in ideal platforms for the development of diagnostic tools and bio‐inspired drug delivery technologies. Despite their potential, the mechanisms underlying EV release, uptake and distribution remain unclear. Here, we leverage high‐resolution live‐cell imaging, quantitative analytical methods and in vivo mouse models to define the major determinants of EV diffusion. Our findings reveal that cell density plays a crucial role in EV dissemination. Specifically, sparsely distributed cells exhibit higher EV release rates into the supernatant due to increased surface exposure in vitro. In contrast, densely packed cells promote EV internalization and degradation by adjacent cells, effectively restricting EV diffusion in vivo and in vitro. As a result, EVs travel only limited distances, with the majority being internalized by adjacent cells. These findings challenge the prevailing assumption that any EV can act as long‐range messengers and instead highlight their function as short‐range communication agents primarily confined within their tissue or organ of origin. This study provides fundamental insights into EV‐mediated intercellular signalling and has important implications for their use in diagnostic and therapeutic applications.
Keywords: cancer, exosomes, extracellular vesicles, intercellular communication, lattice light sheet microscopy, liquid biopsy, live cell microscopy, tumour microenvironment
1. Introduction
Extracellular vesicles (EVs) are membrane‐bound structures released by cells that play critical roles in intercellular communication by transferring proteins, lipids and nucleic acids to recipient cells (Cocucci et al. 2009). These vesicles are integral to numerous physiological processes, including immune responses (Lindenbergh and Stoorvogel 2018), development (Gross et al. 2012), and tissue homeostasis, as well as pathological conditions such as inflammation, cancer progression, and metastasis (Vader et al. 2014). Since the content of EVs is representative of their cell of origin, EVs released by diseased tissues carry cargoes that mirror the overall complexity of the underlying pathological process. For this reason, EVs represent a potential source of information for diagnostic and prognostic clinical use in cancer (Yekula et al. 2020; Pang et al. 2020; Lo and Lam 2020), neurodegenerative diseases (Lakshmi et al. 2020; Picca et al. 2022; Pinnell et al. 2021), or other conditions for which biopsies are the standard of care, but frequent repetition of the procedure is impractical due to invasiveness and cost (Armstrong and Wildman 2018).
Despite their biological significance, the mechanisms underlying EV release, uptake and spatial distribution within tissues remain incompletely understood. In particular, the extent to which the extracellular environment, including cell density, modulates EV movement and cell‐to‐cell exchange is still largely unexplored. This gap in knowledge limits our understanding of how EVs function as mediators of local versus long‐range signalling and may impact the interpretation of EV‐based diagnostic strategies.
In this study, we investigate how basic physiological parameters that control EV movement in the extracellular space, with a specific emphasis on cell density in the tumour microenvironment, affect the diffusion, uptake and degradation of EVs. By addressing these questions, we aim to provide new insight into the spatial constraints of EV‐mediated communication.
A key finding presented in this work is the inverse relationship between EV release per cell and cell density in vitro, suggesting that sparsely distributed cells release EVs more efficiently in the media due to greater exposure of the cell surface to the extracellular space. Conversely, higher cell density promotes EV internalization and degradation in adjacent recipient cells, emphasizing the pivotal role of cell proximity in modulating EV‐mediated signalling. Furthermore, experiments designed to measure the diffusion range of EVs within tissues demonstrate that EVs are primarily exchanged locally, with 80% of the signal retained within 40 µm from the donor cell in the tumour microenvironment. The limited diffusion of EVs underscores their major role as short‐range signalling agents, aligning with their function mainly in maintaining local tissue homeostasis and orchestrating paracrine signalling.
2. Materials and Methods
2.1. Reagents
The human triple‐negative breast cancer cell line SUM‐159PT (SUM) and the gene‐edited cell line AP2S1‐EGFP (SUM‐AP2‐EGFP) were a kind gift of Dr. Tomas Kirchhausen (Harvard Medical School, Boston, MA, USA) (Aguet et al. 2016); the human cervical cancer cell line HeLa and inducible knockdown for clathrin (HeLa CLTC) were from Drs. Pier Paolo Di Fiore and Sara Sigismund (IEO, European Institute of Oncology, Milano) (Caldieri et al. 2017). The mammalian expression vectors for Clathrin‐mRuby, mEmerald‐CD9 and mTagBFP‐Nucleus‐7 were generously provided by Dr. Michael Davidson (Addgene Plasmids: #55852, #54029 and #55265), while the one to express EGFP‐CD63 was provided by Dr. Martin Hemler. HaloTag ligands JF549 and JF635 are kind gifts of Dr. Luke Lavis (Janelia Research Campus). The expression vectors were propagated in DH5‐alpha E. coli (New England Biolabs), and plasmids were purified using Plasmid Miniprep or Midiprep Kits (Qiagen) or a PureLink HiPure Plasmid Filter Midiprep Kit (Thermo Fisher Scientific). Primers were obtained from IDT (Integrated DNA Technologies). Primary antibodies against clathrin heavy chain (mouse monoclonal, 610499, BD Biosciences), CD9 (mouse monoclonal, 2897163, EMD Millipore), CD63 (mouse monoclonal 561925, eBiosciences), CD81 (rabbit monoclonal, SN206‐01, Thermo Fisher), Vinculin (mouse monoclonal VCL/2575, AbCam), ESYT‐1 (rabbit monoclonal, HPA016858, Sigma‐Aldrich), ERGIC (rabbit polyclonal, ab121574, AbCam), Halo (mouse monoclonal, 28A8, ChromoTek), TSG101 (mouse monoclonal, 4A10, AbCam), and GAPDH (rabbit monoclonal, 14C10, Cell Signalling) were used for Western blotting together with anti‐mouse or anti‐rabbit IgG antibodies conjugated with horseradish peroxidase (goat‐polyclonals, 5178‐2504 or 1706515, both purchased from Bio‐Rad). Chemicals were bought from Sigma‐Aldrich unless specified otherwise.
2.2. Cell Handling and Transfection
Cell lines were cultured at 37°C and 5% CO2; SUM were grown in F12‐Glutamax (Thermo Fisher Scientific) supplemented with 5% foetal bovine serum (FBS) (VWR), 100U/mL penicillin and streptomycin (Thermo Fisher Scientific), 1 µg/mL hydrocortisone (H‐4001; Sigma‐Aldrich), 5 µg/mL insulin (128–100; Cell Applications) and 10 mM 4‐(2‐hydroxyethyl)‐1‐piperazine‐ethane‐sulfonic acid (HEPES), pH 7.4. HeLa cells were grown in DMEM‐high glucose supplemented with 10% FBS, 100U/mL penicillin and streptomycin and 1% Glutamax (Gibco). To induce clathrin knockdown, HeLa CLTC cells were cultured for 1 week in DMEM‐high glucose supplemented with 10% Tetracycline‐free FBS (Thermo Fisher), 100U/mL penicillin and streptomycin, 1% Glutamax (Gibco) and 0.5 µg/mL doxycycline (Sigma‐Aldrich). Cells were resuspended to be propagated or subjected to other experimental procedures by exposure to 0.25% trypsin‐EDTA (Thermo Fisher Scientific) for 3 min at 37°C, followed by a wash in 10 mL complete media and centrifugation at 300 × g for 5 min. Cells were counted and plated as needed. Cell culture flasks and multi‐well plates were bought from Greiner Bio‐One.
For transient transfections, 4 × 10⁵ cells were plated in one well of a 6‐well plate in complete medium. The following day, 3 µL of Mirus TransIT 2020 reagent (Mirus Bio, Madison, WI) and 1 µg of plasmid were combined in 250 µL Opti‐MEM (Thermo Fisher Scientific). After 30 min the mixture was added dropwise to the cells. Expression of Clathrin‐mRuby, CD9‐Emerald, nuclear‐BFP, CD9‐Halo and CD63‐GFP was obtained by transient transfections. To obtain SUM and HeLa cells stably expressing CD9‐Halo, the transiently transfected cells were expanded in T75 flasks in the presence of the antibiotic G418 (800 µg/mL for 15 days) and further enriched by two rounds of cell sorting and expansion over the course of 3 weeks.
2.3. Plasmid Assembly
The mammalian expression vector encoding for CD9‐Halo was developed starting from the mEmerald‐CD9 vector and a previously developed CALM‐Halo construct (Willy et al. 2021). Emerald was substituted with HaloTag using an approach based on isothermal assembly (Gibson et al. 2009). Briefly, two overlapping PCR products were generated using the high‐fidelity DNA polymerase Q5 (New England Biolabs): one was the linearized recipient CD9 plasmid; the second was the HaloTag insert. Primers to generate the CD9 linearized plasmid were:
FW: 5’‐cgagatttccggcggcagcggagggCCGGTCAAAGGAGGCACC‐3’
RW: 5’‐ tttctgccatGGTGGCGACCGGTAGCGC‐3’
Primers to amplify the HaloTag insert were:
FW: 5’‐ggtcgccaccATGGCAGAAATCGGTACTG‐3’
RW: 5’‐ctttgaccggccctccgctgccgccGGAAATCTCGAGCGTCGAC‐3’
Upper‐case characters in the primer sequences indicate the regions that anneal with the original constructs. The lower‐case characters indicate additional bases inserted to provide matching sequences between the two amplified PCR products and a flexible linker (SGGSGG) between the HaloTag and the CD9 sequence. The PCR products were ligated using the NEBuilder HiFi DNA Assembly kit (New England Biolabs, Ipswich, MA, USA) and transformed into competent DH5a E. coli (5‐alpha Competent E. coli) following the protocol provided by the company (New England Biolabs, Ipswich, MA). For colony selection, bacteria were plated on Luria Broth agar plates supplemented with kanamycin (25µg/mL). Plasmids were extracted using the QIAprep Miniprep Kit (Qiagen, Hilden, Germany) or HiPure Plasmid Filter Midiprep Kit (Thermo Fisher Scientific, Waltham, MA) and sequenced to ensure that the correct modifications were in place.
2.4. Cell Protein Extraction and Immunoblotting
HeLa and HeLa CLTC cells grown on 6 well plates at 80% confluence were detached, washed three times in phosphate‐buffered saline (PBS) and solubilized at 4°C in lysis buffer (50 mM Hepes pH 7.4, 150 mM NaCl, 15 mM MgCl2, 1 mM EGTA, 10% glycerol and 1% Triton X‐100) supplemented with a protease inhibitor mixture (Roche). Nuclei were removed from the lysates by centrifugation (800 × g, 10 min, 4°C). Protein concentration was measured by Bicinchoninic acid (BCA) assay (Pierce). Samples were loaded in precast 4%–20% gradient sodium dodecyl sulphate (SDS) polyacrylamide gels (Mini‐PROTEAN TGX gels, Bio‐Rad) and run at room temperature with 100 V (constant) before being transferred to polyvinylidene fluoride or nitrocellulose membranes using the Trans‐Blot Turbo system (Bio‐Rad) for 10 min at 2.5 A. Membranes were stained with Ponceau S solution then saturated in blocking buffer composed of Tris Buffer Saline (TBS) (150 mM NaCl and 50 mM Tris pH 7.4) supplemented with 5% nonfat dry milk and 0.05% Tween20. The membranes were then incubated for 1 h with the appropriate primary antibodies diluted in blocking buffer (100 ng/mL). After three washes of 5 min apiece in blocking buffer, the membranes were incubated with 1 µg/mL of secondary antibody for 1 h. After extensive washes in Tris‐buffered saline, the chemiluminescent signal was elicited by 5 min incubation with enhanced chemiluminescence substrate (ECL, Pierce, Thermo Fisher Scientific) and captured photographically on film (CL‐XPosure, Thermo Fisher Scientific).
2.5. Slot Blot for EV Protein Detection
SUM or HeLa cells were seeded in 6‐well plates at increasing density. 24 h post‐plating, the cells were washed twice with HBSS and maintained in Opti‐MEM (1 mL/well). After 24 h, the cell supernatants were collected and centrifuged at 5000 × g for 10 min to remove floating cells and debris. The resulting supernatants were spotted on a nitrocellulose membrane (0.45 µm, Bio‐Rad) using a slot blot apparatus. Briefly, pre‐wet nitrocellulose in TBS solution (150 mM NaCl, 50 mM Tris, pH 7.4) was inserted into a slot blot apparatus (Bio‐Rad) connected to vacuum aspiration. The samples (200 µL each) were loaded into the slot‐blot wells and dried out by vacuum. The process was repeated until the entire volume of each sample was loaded (1 mL each sample). An equal final volume of Opti‐MEM was spotted in separate wells as a negative control following the same procedure.
The nitrocellulose membrane was dried at room temperature (RT) for 2 h, then saturated for 1 h with blocking buffer (5% non‐fat dry milk in TBS + 0.05% Tween20). The membrane was incubated overnight at 4°C with the primary antibodies diluted in blocking buffer (100 ng/mL). The day after, the membrane was washed three times with blocking buffer, incubated with anti‐HRP secondary antibodies, and the signal was developed with ECL reaction. Densitometric analyses were performed with ImageJ software (NIH).
2.6. Nanoparticle Tracking Analysis (NTA)
Cells were seeded in 6‐well plates and grown in complete media. The day after, cells were washed four times with HBSS (Gibco) and incubated in Opti‐MEM (Gibco). After 24 h, the cell supernatants were collected and centrifuged at 5000 × g for 10 min to remove floating cells and debris. The resulting supernatants were collected and kept on ice before injection into the imaging chamber of NanoSight NS300 (Malvern Panalytical) by a syringe pump. Three videos of at least 30 s each were recorded for each sample. The instrument is equipped with a CMOS camera and controlled by NTA software (version 3.3). Camera shutter speed was set to 25 fps, camera gain to 250, and detection threshold to 5. Minimum expected particle size and minimum track length were set to automatic.
2.7. Live Cell Confocal Microscopy and Data Analysis
After transfection, cells were detached, counted, and mixed in a Falcon tube. The cell mixture containing EV‐donor (CD9‐Emerald or CD9‐Halo) and EV‐recipient cells (Clathrin‐mRuby, n‐BFP, AP2‐EGFP or CD63‐GFP) was plated on a 6‐well plate containing glass coverslips (#1.5; Warner Instruments, diameter 25 mm) previously cleaned by sonication (Ultrasonic Cleaner Branson 1800, Branson) in ethanol and dried at 120°C. For SUM co‐culture experiments, a total of 3 × 10⁵ cells were seeded per well, while for HeLa co‐cultures 6 × 10⁵ cells per well were used. The day after seeding, cells were treated with 50 nM Bafilomycin A1 or its solvent (DMSO) for 24 h. When CD9‐Halo cells were used as EV donors, the co‐cultures were incubated with HaloTag ligand JF549 (Grimm et al. 2015) (5 nM) dissolved in complete media. After 1 h of washing in cell media, the coverslips were moved into a metal chamber for live‐cell imaging (Thermo Fisher Scientific) and acquired with a Nikon A1R scanning confocal microscope equipped with a temperature and CO2‐controlled chamber. The microscope is controlled by the Nikon Imaging Software‐Elements (Nikon). Image stacks were acquired using a Plan Apo 100X oil immersion lens (NA:1.45); planes were spaced 0.25 µm along the z axis, and pixel size was 0.25 µm. ImageJ (NIH) was used to project the images across the z axis.
To define the concentration of HAloTag ligand JF549 that maximized CD9‐Halo labelling while preventing nonspecific fluorescent signal, HeLa cells stably transfected with CD9‐Halo were plated on 25 mm glass coverslips as described previously, exposed to increasing concentrations of Halo Ligand JF549 (2.5‐40 nM) for 1 h, then extensively washed with media for an additional hour. Nuclei were labelled with 2 µg/mL Hoechst (Thermo Fisher Scientific) for 10 min. Image stacks were acquired using a Plan Fluor 40X oil immersion lens (NA:1.3); planes were spaced 0.5 µm along the z axis, and pixel size was 0.62 µm.
Five fields of view were acquired by live cell confocal microscopy for each coverslip in order to have > 100 cells per condition. The images were analyzed using CellProfiler (Carpenter et al. 2006), which measured the intensity of each cell in the JF549 channel. A cell was defined by the software as the object comprised within the circle drawn 25 pixels around the perimeter of the nucleus, identified by the Hoechst staining.
To assess the extent of EV exchange at the cell–cell interface, HeLa cells expressing CD9‐Halo were seeded on glass coverslips with HeLa cells, labelled for 1 h with 2 µM Calcein‐AM (Thermo Fisher Scientific), at a 1:3000 ratio (80% confluency at seeding) to maximize the possibility that EV donor cells were surrounded by a confluent monolayer of recipient cells after 48 h. The day after seeding, cells were treated with 50 nM Bafilomycin A1 for 24 h. Before imaging, the cells were incubated with HaloTag ligand JF549 (5 nM, 1 h of incubation) to label CD9 and Hoechst (10 min of incubation) to stain nuclei. After extensive washes in complete media, the cells were imaged with the Nikon A1R confocal microscope using a Plan Fluor 40X oil immersion lens (NA:1.3); planes were spaced 0.3 µm along the z axis and pixel size was 0.62 µm.
Fields were selected with CD9‐Halo cells in the centre of the image. The images were segmented using a customized routine developed in MATLAB. First, the code generated a mask to outline the CD9‐Halo cells (origin of the EVs). Then, an algorithm subdivided the rest of the image into concentric surfaces at increasing distances from the edge of the cell. The lateral size of the concentric masks was constant and approximately set to half of the diameter of a HeLa cell (14 µm).
2.8. EV Exchange In Vivo: Tumour Establishment, Tissue Processing, and Analysis
To assess the extent of EV exchange in tissues, in vivo, primary tumours were established by subcutaneously injecting 2.5 × 10⁶ HeLa stably expressing CD9‐Halo or Staygold, a highly photostable and bright green fluorescent protein, as donor and recipient cells respectively in a ratio of 1:100 or 1:200 (donor:recipient cells) into both flanks of athymic nude mice (n = 5, Target Validation Shared Resource, The Ohio State University). As a control, 2.5 × 10⁶ donor or recipient cells were injected separately into the flanks of three additional mice (n = 3 for each condition). Fourteen days post‐injection (Day 14), when tumours became palpable, mice were treated intraperitoneally with 0.3 mg/kg Bafilomycin‐A1 (Li et al. 2021) (Selleckchem, USA). On Day 15, mice received intraperitoneal injection of 0.3 mg/kg Bafilomycin‐A1 and retro‐orbital injection of HAloTag ligand JF635 (100 nmol). On Day 16, the mice were euthanized, and tumours were harvested, fixed in 4% PFA for 5 h, and stored overnight in 30% sucrose dissolved in PBS. The following day, the tissues were embedded in Optimal Cutting Temperature (OCT) compound, sectioned, and mounted onto slides. Nuclei were counterstained using Fluoromount‐G Mounting Medium with DAPI (Thermo Fisher Scientific).
Confocal image stacks were acquired using a Nikon AR1 confocal microscope with a Plan Apo λ 20X lens (NA: 0.75) at a pixel size of 0.2 µm. Image analysis was performed using a Python‐based processing pipeline that can be found at https://github.com/CocucciLab/spatial‐limits‐of‐extracellular‐vesicles. First, an erosion morphological operation was applied to the images. Masks were then created to outline CD9‐Halo donor cells, and the distance from the thresholded signal surrounding the masks to the nearest boundary of the donor cells was computed. Based on these distance measurements, the images were segmented into concentric zones at intervals of 50 pixels (approximately 10 µm). For each segmented zone, the frequency of the CD9‐Halo signals was quantified and plotted. We estimated the long‐distance travel of EVs by measuring the signal surrounding recipient cells in tumours composed of donor and recipient cells (diffuse CD9‐Halo signal). For background analysis, the same pipeline was applied to regions randomly selected in tumours composed of only recipient cells. Finally, statistical differences were computed using the Mann‐Whitney U test between the signal of CD9‐Halo EVs released by donor cells in tumours composed of donor and recipient cells, or the CD9‐Halo signal surrounding recipient cells (diffuse CD9‐Halo signal), with the background of HaloTag ligand JF635 signal computed in tumour composed of only recipient cells.
2.9. Lattice Light Sheet Microscopy (LLSM) Live Cell Imaging, Data Acquisition and Visualization
We imaged HeLa cells with a lattice light‐sheet fluorescence microscope (Intelligent Imaging Innovation). Directly derived from the instrument patented by Dr. Eric Betzig and colleagues (Chen et al. 2014), this system utilizes Bessel beam lattice sheet illumination via cylindrical lenses and a high‐speed spatial light modulator (SLM) for multicolour imaging, as well as an annular mask array for the formation of various light sheets and galvo mirrors to control lattice movement in x and z. It has cameras in the image and Fourier space to inspect the lattice and annular mask shapes. Assembled on an active vibration isolation table equipped with active and passive systems for vibration cancellation (TMC, Ametek), it is equipped with four laser lines for sample excitation (405 nm, 300 mW, Omicron; 488 nm, 300 mW, Coherent; and 560 nm, 500 mW and 642 nm and 500 mW, MPB Communication) and the required filter sets necessary to efficiently image two colour sets at a time (Semrock). Two water immersion objectives control the illumination (28×/0.67 NA) and detection (25×/1.1 NA, expanded to reach a final 62.5× magnification). Two piezo controllers operate the translations of the stage and of the objective. The instrument is also equipped with a temperature‐controlled, 90 × 1500 cm (36″ × 60″) specimen chamber maintained at 37°C. Images are acquired by two high‐speed, high‐resolution 2K × 2K sCMOS camera with 82% QE (ORCA‐Flash4.0 V3, Hamamatsu). A computer workstation (Dell) is equipped with the software SlideBookTM 6 (Intelligent Imaging Innovation) that fully controls the instrument (high‐speed synchronization of laser firing, SLM pattern display, galvo movements, and imaging camera readout along with the ability to de‐skew and view data).
Data Acquisition and visualization. To acquire the images, we illuminated the sample with a dithered light sheet generated in the square lattice configuration (Chen et al. 2014) using an excitation NA of 0.550/0.493 and full width at half maximum (FWHM) beam length of 15 µm. SUM cells stably expressing CD9‐Halo or AP2‐EGFP were excited for 35 ms with the 488‐nm and 561‐nm lasers at a power of 12 and 27 mW, respectively, measured before the cylindrical lenses (500‐mW laser, acousto‐optic tunable filter 1 [AOTF 1]). Image stacks were composed of 40 sequential planes of 768 × 512 pixels spaced 0.6 µm in sample scan mode (corresponding to 73×53×13 µm volume spaced 0.35 µm over the z axis after de‐skewing). The movies we analyzed were composed of a variable number of stacks (from 234 to 932) acquired every 3 s to generate movies spanning from 11 to 46 min. For visualization, the de‐skewed stacks (Intelligent Imaging Innovation) were deconvolved using the Lucy–Richardson algorithm (MATLAB, MathWorks) and rendered with a 5D viewer developed in MATLAB environment (Wait et al. 2019). The 3D rendered images were exported as .tiff images or movies in .mp4 format.
2.10. Estimation of EV Diffusion
We estimated the diffusion of EVs after being released in the extracellular space in in vitro cultures using the Stokes‐Einstein equation, a widely accepted method for evaluating nanoparticle diffusion. This equation serves as the foundation for the nanoparticle tracking analysis (NTA), a technology that can effectively estimate EV size using their diffusion properties (Filipe et al. 2010).
The Stokes–Einstein equation is:
where:
kB = 1.38×10⁻²³ J
T = 310°K (absolute temperature for 37°C),
η = 0.00069 Pa (dynamic viscosity of water at 37°C), r () = 50×10−9 m (radius of a particle with 100 nm diameter).
Using this equation, an EV of 100 nm in diameter randomly diffuses at a speed of D = 6.578 µm2/s in water at 37°C.
Additionally, the Central Limit Theorem states that the sum of many independent variables tends toward a normal (Gaussian) distribution. For this reason, in the context of diffusion, the cumulative effect of many small, random movements results in a Gaussian distribution of particles over time. The standard deviation (SD) of the Gaussian accounts for the spread of the particle positions from the point of release. Therefore, to compute the distance travelled by particles after one or 2 days of diffusion, we used the equation:
where D = 6.578 µm2/s (diffusion coefficient from Stokes–Einstein equation), and t is the time expressed in seconds (86400 s for 1 day). Consequently, SD is 1.066 mm after 1 day and 1.507 mm after 2 days of diffusion. Therefore, based on the properties of normal distribution, 99.7% of EVs are expected to be within a radius of 3SD from the point of origin, if freely diffusing in the extracellular space. This corresponds to 3.198 mm after 1 day and 4.521 mm after 2 days of diffusion.
2.11. Flow Cytometry and Cell Sorting
HeLa or SUM cells plated on 6‐well plates were transfected with CD9‐Emerald or n‐BFP. After 24 h, the cells were detached by 0.25% trypsin‐EDTA (Thermo Fisher Scientific), counted, and mixed 1:1 in a Falcon tube. For each condition, a total of 120,000 HeLa cells (60,000 CD9‐Emerald and 60,000 n‐BFP) were mixed. In the experiments using SUM, a total of 60,000 cells per condition were used (30,000 CD9‐Emerald and 30,000 n‐BFP).
Mixtures were seeded in multiwell plates and left to adhere and spread for 48 h. The day after seeding, cells were treated with 50 nM Bafilomycin A1 for 24 h. Then, the cell co‐cultures were detached by 0.25% trypsin‐EDTA, rinsed in complete media, and analyzed by flow cytometry (Gallios, Beckman Coulter). Unstained cells and single‐colour controls (CD9‐Emerald+ and n‐BFP+) were used to set photomultiplier voltages. Analyses were performed using Kaluza software (Beckman Coulter).
Alternatively, double‐positive n‐BFP/CD9‐Emerald cells were sorted using an ARIA III cell sorter (Beckton Dickinson and Company). Sorted cells were seeded on a glass coverslip for cell imaging. After spreading, cells were labelled with 1 µM Cell Trace‐Far Red (Thermo Fisher Scientific) in serum‐free medium for 20 min. After two washes in complete medium, coverslips were inserted into a metal chamber for live‐cell confocal imaging with a Nikon A1R microscope. Image stacks were acquired using a Plan Apo 100X oil immersion lens (NA:1.45); planes were spaced 0.25 µm along the z axis, and pixel size was 0.25 µm. ImageJ (NIH) was used to project the images across the z axis.
To biochemically confirm that EVs were internalized by a biochemistry approach, we used stably transfected HeLa cell lines expressing CD9‐Halo (donor) and clathrin‐Halo (acceptor). CD9‐Halo cells were labelled with HaloTag ligand JF635 (5 nM), and clathrin‐Halo cells with HAloTag ligand JF503 (20 nM) overnight. The following day, 1.3 × 10⁶ cells of each line were mixed and co‐cultured in the presence of Bafilomycin for 24 h. Double‐positive cells (JF635+ and JF503+) were sorted, pelleted, and lysed along with controls (CD9‐Halo and clathrin‐Halo cells alone) using standard lysis buffer. Fifteen micrograms of each lysate were resolved by SDS‐PAGE, transferred to nitrocellulose membranes, and stained with Ponceau. After blocking in 5% milk in TBST for 1 h, membranes were incubated overnight at 4°C with anti‐Halo antibody and either anti‐vinculin or anti‐GAPDH as loading controls.
2.12. Cell Viability Assay
A 3‐(4,5‐dimethylthiazol‐2‐yl)‐2,5‐diphenyltetrazolium bromide (MTT) assay was performed to assess cell viability upon treatment with Bafilomycin A1. HeLa cells plated in 96‐well plates (10,000 cells/well) were treated with increasing concentrations of Bafilomycin A1 (0‐400 nM) or its solvent (DMSO) for 24 h. Afterwards, MTT (5 mg/mL) was added to each well and incubated at 37°C for 2 h. The cell media was removed and replaced with DMSO to dissolve formazan crystals, the MTT metabolite. The plate was kept under agitation for 15 min, then the absorbance was measured at 560 nm using a plate reader (BioTek SynergyH1).
Flow cytometry analysis of cells labelled with Annexin V and PI was performed to assess viability of cells upon increasing cell density. HeLa and SUM were plated at different numbers on a 6‐well plate: 106, 5 × 10⁵, 2.5 × 10⁵, 105, 5 × 10⁴ and 2.5 × 10⁴. After 24 h, cells were washed twice with 2 mL of HBSS and incubated with 1 mL of Opti‐mem for additional 24 h. Then, while the supernatants were collected and used for additional characterization (see slot‐blot for EV protein detection), the cells were trypsinized and centrifuged at 300 × g for 5 min. Annexin V‐PI staining was performed as suggested by the company (BD #556547). Briefly, the cell pellet (consisting of ∼100,000 cells) was resuspended in 100 µL of 1X binding buffer, 4 µL of PI of Annexin V were added. Cells were vortexed gently and incubated for 15 min in the dark. An additional 400 µL of binding buffer was added, and the cells were acquired by flow cytometry (Gallios, Beckman Coulter) within 1 h.
2.13. Transmission Electron Microscopy (TEM) of EV Pellets
SUM cells were seeded at 70% confluence in two T175 flasks. After spreading, cells were washed in HBSS and incubated in Opti‐MEM for 24 h. The conditioned media were collected and centrifuged at 5000 × g for 10 min to remove cell debris. The resulting supernatants were transferred into ultracentrifuge‐proof tubes and centrifuged for 1 h at 110,000 × g using a swing rotor (SW32, Beckman Coulter). The supernatants were discarded, and the pellets were resuspended in 60 µL of HBSS. 20 µL of EV suspension was adsorbed onto 400‐mesh formvar/carbon‐coated grids for 10 min at RT. Adherent EVs were stained with uranyl‐acetate and immediately imaged using a Tecnai G2 Biotwin transmission electron microscope (FEI).
2.14. Approaches to Study EV Exchange In Vitro
To study the impact of cell distance to EV exchange in vitro we used two strategies. The first one was based on the design and fabrication of plastic rings for cell culture. Cell rings were designed using the online software Tinkercad (Autodesk). For the Close configuration, we designed rings of 1 cm radius and 0.5 cm height. For the Far configuration, we designed two rings (1 cm radius and 0.5 cm height) connected by a stem of 4 cm. We chose to plate the cells at 40 mm apart to maximize the distance between donor and acceptor cells within a standard 10 cm petri dish, while still allowing for straightforward and reproducible plating. Rings were 3D‐printed in a biocompatible resin (Surgical Guide) using a Form 3B+ printer (Formlabs) following the company's protocol. After printing, the rings were washed extensively in iso‐propanol and cured. The curing procedure consisted of simultaneously exposing the printed parts to heat (60°C) and light (405 nm) for 60 min in a Form Cure station (Formlabs).
Ring patterns were placed into 10 cm Petri dishes. To plate cells in the Close configuration, we mixed HeLa cells transfected with CD9‐Emerald or n‐BFP at a 1:1 ratio. The Far configuration consisted of plating donor and recipient cells in two different rings connected by a 4 cm stem. 60,000 HeLa cells transfected with CD9‐Emerald were plated in one ring, and 60,000 HeLa cells transfected with n‐BFP were plated in the other ring. After 24 h, the culture media and the rings themselves were removed from the dishes. The Petri dishes were then washed in HBSS, and the cells were incubated in complete DMEM media. The following day, the cells were treated with 50 nM Bafilomycin A1 for 24 h. Some plates were placed on an orbital shaker at 37°C to promote media movement, while other plates were kept still in the incubator. After 24 h, cells were detached by trypsinization, centrifuged and analyzed by flow cytometry to measure the percentage of double‐positive CD9‐Emerald/n‐BFP cells.
In other experiments, we used HeLa stably transfected with CD9‐Halo cells as donors. The donor cells were plated on six‐well‐plates wells and labelled with HaloTag ligand JF635 (5 nM) overnight. The HeLa acceptor cells were labelled with 5 µg/mL of Hoechst dissolved in media for 15 min. After extensive washes, the cells were either mixed and plated on a single glass coverslip (close configuration) or plated separately on two different coverslips. Coverslips with donor or acceptor cells were then secured on a 10 cm petri dish using a small drop of Dow Corning high vacuum grease at 3 or 30 mm of distance. The plate was covered with 8 mL of media supplemented with Bafilomycin A1. After 24 h the coverslips were retrieved in 6‐well plates and separately trypsinized and analyzed by flow cytometry. This approach allowed us to isolate donor and acceptor cell populations with minimal risk of cross contamination. The 3 mm distance was selected because it approximates the maximum theoretical diffusion distance for EVs over 24 h, based on the Stokes–Einstein equation, while the 30 mm distance serves as a far‐range control.
2.15. Design and Fabrication of a Millifluidic Device for Studying EV Exchange in Dynamic Conditions
The millifluidic device was designed using the online software Tinkercad (Autodesk) and printed in a biocompatible resin (Surgical guide) using the protocol described in the previous section. The device consists of a rectangular prism (D 15 × W 20 × H 6 mm) embedding two circular chambers (Ø: 6 mm, height: 1.7 mm) connected by a channel of 3 mm length. We chose to connect the two chambers with a channel of 3 mm in length to minimize the dead volume between them, while placing the two chambers at a distance corresponding to the maximum theoretical diffusion range of EVs over 24 h, as estimated by Stokes–Einstein equation. An inlet and an outlet channel allow the directional fluid flow between the chambers, which are designed to host 5 mm glass coverslips carrying EV donor and/or recipient cells.
HeLa/CD9‐Emerald (EV donor) and HeLa/n‐BFP (EV recipient) cells were seeded at high density on 48‐well plates containing 5 mm glass coverslips, previously cleaned by ethanol and glow discharge. For the “Close configuration” donor and recipient cells were mixed at 1:1 ratio, and 20 µL of the mixture (containing 10,000 donor and 10,000 recipient cells) were dropped onto each coverslip. Instead, for the “Far configuration” donor and recipient cells were seeded on distinct coverslips (10,000 cells each). After cells spreading coverslips were gently washed in complete DMEM media to remove floating cells, then transferred into the millifluidic device. The coverslips carrying EV donor cells were placed in the left chambers of the devices while the ones carrying the EV recipient cells on the right chambers. The devices were sealed by applying a biocompatible tape on the top surface, then filled with complete DMEM (without phenol red) supplemented with Bafilomycin A1 (50 nM).
Some devices were connected to an infusion syringe pump to deliver media from the chambers containing the donor cells to the chambers containing the recipient cells. To do so, a 10 mL syringe was filled with complete DMEM + Bafilomycin A1 and connected to a transparent tube (Tygon R3603). The syringe was then inserted into a pump for fluid delivery (Chemyx Fusion 200). A flow rate of 200 µL/min was set to fill the tube. Then, the tube was inserted into the device using a connector made from a syringe needle (Gauge 27). The inlet channel was sealed using Dow Corning high vacuum grease to avoid fluid leakage from the chamber.
The flux was reduced to 5 µL/min. The progression of the media across the device can be monitored by observing the contrast between the transparent media contained in the chambers and the one with phenol red, used to deliver the Bafilomycin A1 and the CD9‐Emerald EVs once released by the donor cells. At this flow rate, the media filling the device is replaced every 20–25 min. After 18 h at 37°C, the coverslips carrying EV donor and recipient cells (“Close configuration”) and the coverslips containing the recipient cells of the “Far configuration” were removed from the chambers and placed into a 48‐well plate. Cells were gently washed twice in PBS and detached with PBS/EDTA (300 µL). The cell suspensions were transferred into flow tubes and analyzed by flow cytometry to measure the percentage of double‐positive CD9‐Emerald/n‐BFP cells. Untransfected, CD9‐Emerald+, and n‐BFP+ cells were used as single‐colour controls.
2.16. Transferrin‐647 Uptake to Evaluate the Functionality of Clathrin‐Mediated Endocytosis
HeLa CLTC cells were treated or not with 0.5 µg/mL doxycycline for 1 week to induce the expression of shRNA specific for clathrin heavy chain. Then, the cells were washed with HBSS and exposed to 0.5 µg/mL Transferrin‐Alexa Fluor 647 (A647‐Tf, Thermo Fisher Scientific) dissolved in complete DMEM for 10 min at 37°C. Afterwards, the dishes containing the cells were set on ice to block endocytosis, and the cells were washed with ice‐cold HBSS. To measure the amount of transferrin receptor present at rest on the cell surface, cells in other wells were exposed to A647‐Tf at 4°C for 10 min. To remove the surface‐bound fluorescent ligand, some wells were exposed twice to an acidic solution for 1 min (150 mM NaCl and 0.1 M glycine, pH 2.5). After two more washes in ice‐cold HBSS, the cells were detached by trypsinization, collected in flow tubes containing 1 mL of media to inactivate trypsin, centrifuged at 300 × g, and resuspended in ice‐cold media. The samples were then quantified by flow cytometry (Gallios, Beckman Coulter), and the resulting data were analyzed by Kaluza software (Beckman Coulter). Transferrin internalization was normalized to the amount of surface‐bound. The experiment was repeated three times, and the normalized means obtained across the experiments were compared using an unpaired t‐test (GraphPad Prism).
2.17. Statistical Analysis and Figure Preparation
Statistical analyses were performed using the software Prism (GraphPad), MATLAB (MathWorks), and Python packages; figures were assembled in Adobe Illustrator (Adobe).
3. RESULTS
3.1. Increasing Cell Density Decreases the Number of EVs Retrieved in the Cell Supernatant
To investigate the role of cell–cell contact in EV release, we plated SUM159‐PT (SUM) cells, a model of metastatic breast cancer (Flanagan et al. 1999), at increasing densities. To avoid the confounding contribution of EVs derived from foetal bovine serum (FBS), we cultured the cells in Opti‐MEM, which sustains cell growth in the absence of serum. After 24 h, we collected the supernatants and processed them for Nanoparticle Tracking Analysis (NTA) to quantify EV concentration (Vestad et al. 2017). While the absolute number of EVs retrieved in the supernatant increased with increasing cell density, the number of EVs released per cell decreased significantly (Figure 1a). Increasing cell density did not significantly modify the size of the EVs, which maintained a mode diameter distribution between 129 and 152 nm (Figures 1b,c and Figure S1a). We also observed the typical cup shape that EV samples present when processed for transmission electron microscopy analysis (Figure 1d) (Rikkert et al. 2019). We repeated this experiment using both SUM and HeLa cells, two models that have been used extensively in EV and membrane trafficking studies (Willy et al. 2021; Mathieu et al. 2021; Bonsergent et al. 2021). This time we analyzed the supernatant by slot blot. Slot blot analysis showed that the recovered media is enriched in EVs (Figure S1e), and that the signals of the tetraspanins CD9 and CD63, well‐known EV markers, followed a similar trend in both SUM and HeLa cells (Figure S1b,c). When we compared EV yield per cell, measured by NTA (Figure 1a) or estimated from EV marker analysis by slot blot (Fig. S1d), we observed that the number of EVs retrieved at high cell density consistently represented 50% or less of the maximum amount released at lower cell densities. To exclude the possibility that culturing cells at high density in Opti‐MEM could affect their viability, we analyzed cells by flow cytometry using Annexin V and PI staining. This study showed no significant increase in cell death or stress in either SUM or HeLa cells when cells plated at increasing densities were compared to those seeded at 2.5 × 10⁵ cells within each group (Figure S1f,g).
FIGURE 1.

The number of EVs collected in the supernatant is inversely proportional to cell density. (a–c) SUM cells were plated (6‐well plate; well surface = 9.6 cm2) at increasing densities in Opti‐MEM for 24 h. After removing cell debris from the supernatants of each sample by centrifugation (5000 × g for 10 min), both the EV concentration and the size distribution were assessed by Nanoparticle Tracking Analysis (NTA). (a) While EV concentration increases with the number of cells (blue line), the number of EVs released per cell is inversely proportional to cell density (red line). The graph reports the mean ± SEM of three independent experiments. (b) Size frequency distributions (mean = black line; SD = blue area) of EVs collected from cells plated at increasing numbers (indicated on top of each peak). Increasing cell density did not significantly influence the distribution of EV sizes. As tabulated in (c), the mean of the modal peak across all cell densities was between 129 and 152 nm. The plotted curves in (b) and the quantification in c are the mean of three independent experiments. (d) TEM micrograph of EVs obtained from Opti‐MEM conditioned by SUM cells for 24 h. EVs were enriched by ultracentrifugation (110,000 × g for 1 h) and the resulting pellets were negatively stained with uranyl acetate for visualization. (e) Illustration of the proposed relationship between cell density and EV retrieval from the supernatant. When cells are sparsely distributed, EVs can be released from both the apical and the lateral surfaces of the cells and promptly reach the extracellular space (top panel). In contrast, at high cell density, only EVs released from the apical surface can promptly reach the extracellular space (bottom panel).
Since CD9 and CD63 are markers of ectosomes and exosomes (Mathieu et al. 2021; Jackson et al. 2017), this result suggests that either EVs budding from the plasma membrane or EVs secreted upon multivesicular body fusion are influenced by cell density. A possible explanation is that sparse cells expose more surface to the extracellular space for EV release than densely packed cells (Figure 1e).
3.2. Cell Density Favours EV Internalization Without Hindering Production
However, the experiments presented so far could not discriminate between alternative mechanisms, including whether increased cell density can either prevent EV release by donor cells, or promote EV internalization and degradation by neighbouring cells (Heusermann et al. 2016; Chen et al. 2016; Maugeri et al. 2019; Joshi et al. 2020). To assess this, we developed an unbiased approach to quantify the fraction of cells that accumulate EVs. The experiment was based on a co‐culture of EV‐donor and EV‐recipient cells. EV‐donor cells were transfected with the tetraspanin CD9 conjugated at its N‐terminal with the monomeric fluorescent protein Emerald (CD9‐Emerald), an improved version of EGFP (Day and Davidson 2009). CD9‐Emerald was distributed on the cell surface (Figure S2a), and its over‐expression did not influence EV release either quantitatively or qualitatively (Figure S2b–e). The EV‐recipient cells were transfected with nuclear‐tagBFP (n‐BFP). Co‐culture experiments were set up using either SUM or HeLa cells, with each cell type used as both donor and acceptor within its respective experiment. Twenty‐four hours after transfection, both donor and recipient cells were plated in the same well (Figure 2a). We reasoned that the inhibition of vacuolar H+‐ATPase by Bafilomycin A1 (Bafilomycin) could show whether internalized EVs are degraded in lysosomes (Cashikar and Hanson 2019; Ortega et al. 2019; Savina et al. 2003; Tapper and Sundler 1995; Edgar et al. 2016). For this reason, we added either 50 nM Bafilomycin, a concentration that had non‐toxic effects on our cell models (Figure S2f), or its solvent (DMSO) to the culture dishes. The following day, we resuspended and analyzed the cells by flow cytometry. Cells retaining both n‐BFP and CD9‐Emerald signals accounted for the fraction of n‐BFP cells that engulfed CD9‐Emerald EVs. In some experiments, the cells were sorted and plated on coverslips to confirm by confocal microscopy that EVs labelled by CD9‐Emerald were indeed internalized by the recipient cells (Figure 2b). In other experiments, we used HeLa cells transfected with CD9‐Halo, a self‐labelling enzyme (Los et al. 2008), as donor cells. The sorted cells were lysed to confirm by western blot analysis that CD9‐EVs were internalized in recipient cells (Figure S2g).
FIGURE 2.

Endosomal alkalization reveals EV exchange in high‐density cultures. (a–e) Flow cytometry assay to define the fraction of recipient cells that engulf EVs. (a) Scheme representing the co‐culture of CD9‐Emerald (donor) and n‐BFP (recipient) cells. (b) Representative flow cytometry analysis (left) and confocal microscopy imaging of sorted n‐BFP+/CD9‐Emerald+ HeLa cells (right). The confocal Z projection and relative YZ profile (computed at the white dashed line) show that EVs are engulfed in the intracellular space of the recipient cells. The confocal data is composed of 40 planes spaced every 250 nm on the z axis. (c and d) The fraction of SUM and HeLa recipient cells (n‐BFP+) internalizing EVs (n‐BFP+/CD9‐Emerald+ cells) was quantified by flow cytometry. The co‐cultures exposed to Bafilomycin or DMSO are shown in blue and red respectively. In yellow, cultures solely composed of n‐BFP+ cells (Emerald‐) were used as negative controls to define the threshold for Emerald+ signal (red dashed line). (e) Statistical analysis of three independent co‐culture experiments (mean ± SEM). The fraction of cells that engulfed EVs increased from 49% ± 2% to 80% ± 3% (1.6 times; mean ± SD) in SUM and from 45% ± 6% to 80% ± 4% (1.8 times; mean ± SD) in HeLa cells when treated with Bafilomycin in comparison to the vehicle. Data were compared using a two‐tailed t‐test where ** p value < 0.001. (f–i) Co‐cultures of CD9‐Emerald donor cells and Clathrin‐mRuby recipient cells were imaged by live cell confocal microscopy. Donor and recipient cells were mixed and seeded at a 1:1 ratio to reach 80% confluence after 48 h. White square indicates the region that is magnified in the right panel and the dotted line the plane at which the YZ planes are computed. Experiments were performed using either SUM (f and h) or HeLa cells (g and i). After 24 h of incubation, the co‐cultures were exposed to 50 nM Bafilomycin A1 or its solvent (DMSO) for an additional 24 h.
The fraction of n‐BFP cells that accumulated CD9‐Emerald labelled EVs significantly increased in both SUM and HeLa cells upon exposure to Bafilomycin (Figures 2c–e). We confirmed our results by confocal microscopy. In this set of experiments, recipient cells were labelled with clathrin‐light chain mRuby (Clathrin‐mRuby) (Cocucci et al. 2012) to clearly visualize their surface (Figures 2f,g). Upon Bafilomycin treatment, CD9‐Emerald EVs accumulated in the cytosolic space of the recipient cells (Figures 2h,i). An increase in EV release upon Bafilomycin treatment may have partially contributed to the accumulation of EVs in the endocytic pathway (Cashikar and Hanson 2019; Ortega et al. 2019; Savina et al. 2003; Tapper and Sundler 1995; Edgar et al. 2016). Thus, to assess whether Bafilomycin enhanced EV release in our cell models, we quantified the number of EVs released by cells cultured in Opti‐Mem media in the presence of the drug or its solvent by NTA. We detected ∼3 times more EVs upon Bafilomycin administration (Figure S2h), in agreement with previous results (Cashikar and Hanson 2019; Ortega et al. 2019; Savina et al. 2003; Tapper and Sundler 1995; Edgar et al. 2016). When the supernatants of either SUM or HeLa cells treated or not with Bafilomycin were probed for CD63, CD9 or TSG101 by slot blot (Figure S2i–l), we observed a trend toward increased signal for all three markers in HeLa cells and for CD9 and CD63 in SUM cells upon Bafilomycin treatment when compared with their respective controls.
3.3. Real‐Time Visualization of EV Exchange in High‐Density Cell Culture Models Using Lattice Light Sheet Microscopy (LLSM)
We reasoned that co‐culture experiments could be extended to the visualization of EV exchange in real‐time. To this end, we used lattice light sheet microscopy (LLSM) since image acquisition is faster and less phototoxic than with confocal microscopes. LLSM allows visualization of the entire cell volume while retaining single object/single molecule resolution, resulting in one of the most effective approaches to study cell biology events in four or more dimensions (Willy et al. 2021; Elgamal et al. 2020; Chen et al. 2014). SUM donor cells were transfected with CD9‐Halo and labelled with 5 nM of photostable HaloTag ligand JF549 (Figure S3a) (Willy et al. 2021; Zheng and Lavis 2017). As expected, CD9‐Halo labelled the cell surface, including filopodia and membrane ruffles (Figure S3b). When SUM‐CD9‐Halo cells were co‐cultured with cells expressing CD63‐EGFP, CD9‐Halo‐EVs accumulated in endosomes and lysosomes, organelles that are labelled by CD63 (Kobayashi et al. 2000) (Figure S3c). This result recapitulates our previous findings that CD9 EVs are entrapped in the endo‐lysosomal system upon endocytosis, suggesting that Bafilomycin treatment prevents their degradation. For live cell imaging, we used, as recipient cells, SUM cells gene‐edited to express the subunit mu of the adaptor protein complex AP2 labelled with EGFP (AP2M1‐EGFP), a well‐established marker of clathrin‐mediated endocytosis (CME) (Aguet et al. 2016). While it is well known that clathrin‐coated vesicle formation takes roughly 60 s and that a frequency of volume acquisition of 0.3 Hz is sufficient to detect the dynamics of CME (Aguet et al. 2016; Willy et al. 2021), the time course of EV release and uptake in real‐time is poorly investigated. Since a particle of 100 nm in diameter diffuses in the extracellular space at ∼6.57 µm2/s at 37°C (see Estimation of EV diffusion in the material and methods section) (Lee et al. 2021), we reasoned that to successfully track single EVs from release to uptake, it was necessary to focus on the cell–cell interface. At this location, EVs entrapped between contiguous cells would be subjected to constrained diffusion. Although we collected 23 movies ranging from 15 to 40 min of acquisition (a total of 12 h of imaging), we only identified 10 events that unambiguously corresponded to EVs released from donor cells that were internalized by recipient cells (Figure 3a,b,d,e; Movies 1 and 2). At least two reasons explain why EV internalization was rarely detected: first, because a cell releases roughly 3400 EVs in 24 h (see Figure 1a), which corresponds to only ∼3 EVs per minute; second, because we were restricting our studies to a subfraction of EVs by solely monitoring vesicles labelled with CD9. Despite these limitations, we could observe EV exchange in real‐time. EVs either budded from the cell surface or were released upon the sudden rupture of the tips of filopodia, strengthening the general assumption that CD9 is a marker of ectosomes (Welsh et al. 2024). In addition, filopodia can undergo additional scission events after being released, producing smaller EVs (Movie 3). Notably, the few EVs that were internalized did not colocalize with AP2‐EGFP at any point in time, while other CD9‐EVs that were entrapped in clathrin‐coated vesicles were never endocytosed (Figure 3c). These results suggested that CD9‐EVs are not internalized by CME in our cellular model. To unequivocally confirm our observations, we used a HeLa cell model in which complete depletion of clathrin heavy chain could be obtained by activating a doxycycline‐dependent shRNA system (Figure 3f) (Caldieri et al. 2017), thereby inhibiting CME, as revealed by the inhibition of transferrin internalization (Figure 3g). HeLa cells depleted or not of clathrin heavy chain were transfected with n‐BFP and co‐cultured with CD9‐Emerald HeLa cells. Flow cytometry analysis showed that CME inhibition by clathrin heavy chain depletion did not impair the endocytosis of CD9‐EVs (Figure 3h,i), strengthening our conclusions.
FIGURE 3.
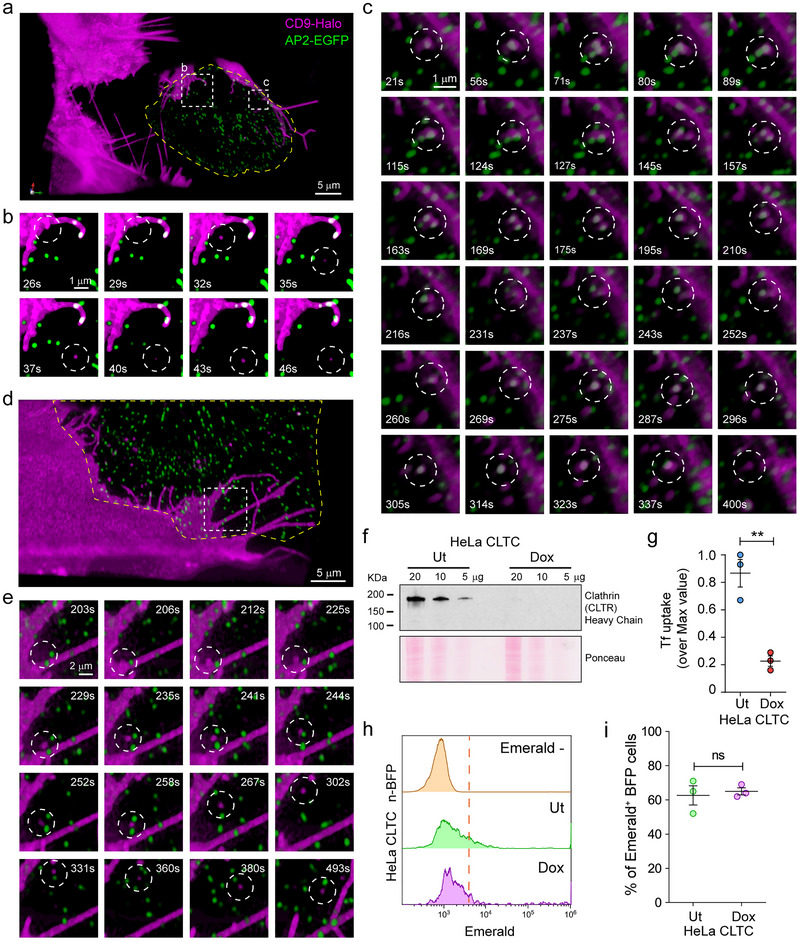
5‐D microscopy reveals both the dynamics of EV transfer, and that EV uptake is independent of clathrin‐mediated endocytosis. (a–e) SUM cells expressing either CD9‐Halo (EV donor) or AP2‐EGFP (EV recipient) were mixed and seeded at a 1:1 ratio, stained with 5 nM of HaloTag ligand JF549 for 1 h, and imaged by Lattice Light Sheet Microscopy (LLSM). All movies were acquired in sample scan mode and were composed of sequential volumes of 73 × 53 × 13 µm (corresponding to 40 sequential optical sections acquired with 35 ms of exposure for each channel and spaced every 350 nm after de‐skewing; the final frequency of acquisition of the movie was of 0.3 Hz). (a and d) Three‐dimensional renderings extrapolated from Movies 1 and 2. The dotted squares define the regions corresponding to the magnified image sequences plotted in Panels b, c, and e. The yellow lines highlight the edges of the acceptor cells, obtained by thresholding the cytosolic AP2‐EGFP signal. (b and e) Internalized CD9‐EVs. The lack of co‐localization between CD9‐Halo and AP2‐EGFP upon vesicle internalization (white circle) suggests that clathrin mediated endocytosis (CME) does not support CD9‐EV uptake. (c) An example of a CD9‐EV that remained at the cell–cell interface for more than 5 min without being efficiently internalized by clathrin‐coated vesicles despite recurrent colocalization with AP2‐EGFP puncta (see also Movie 1). (f–i) To assess the role of CME in CD9‐EV uptake, HeLa cells stably expressing a doxycycline (Dox)‐inducible shRNA sequence against clathrin heavy chain (HeLa CLTC) were cultured in the presence of Dox for 1 week to downregulate clathrin expression. (f) Immunoblotting demonstrated that the Dox‐inducible shRNA system abolished the expression of clathrin heavy chain as compared to untreated (Ut) cells. (g) Clathrin heavy chain depletion impairs CME. HeLa CLTC depleted (Dox) or not (Ut) of clathrin heavy chain were exposed to fluorescently labelled transferrin (A647‐Tf), a CME cargo, for 15 min at 37°C to allow the ligand to internalize (TfINT), or at 4°C to label the surface receptor by preventing its endocytosis (TfSRF). After washes, the cells were analyzed by flow cytometry. The graph shows the ratios between TfINT and TfSRF represented as % of the maximal value (three independent experiments, mean ± SEM). Data were compared using a two‐tailed t‐test. ** p value < 0.001. (h) HeLa cells expressing CD9‐Emerald were co‐cultured at high density (80% confluence at 48 h) with either HeLa CLTC Ut‐n‐BFP or HeLa CLTC Dox‐n‐BFP. 24 h post‐seeding, the cells were treated with 50 nM Bafilomycin for 4 h before quantifying the fraction of double‐positive CD9‐Emerald/n‐BFP cells by flow cytometry. The results from three independent experiments are summarized in (i) (data analysis was performed using a two‐tailed t‐test; ns = not significant) and indicated that CME does not significantly contribute to the uptake of CD9‐EVs.
3.4. Cell Density Influences the Exchange of EVs
If it is true that EVs are mainly exchanged at the cell–cell interface, high cell density may maximize the number of cells that internalize EVs. To explore this possibility, we seeded co‐cultures of HeLa cells expressing either CD9‐Emerald (EV‐donor) or n‐BFP (EV‐recipient) at increasing cell density. Cells were also exposed to Bafilomycin (as described previously) to maximize the detection of EV exchange. Then, each co‐culture was analyzed by flow cytometry to assess the fraction of n‐BFP cells that internalized EVs. As expected, cells at confluence had the largest number of double‐positive cells while the fraction was significantly reduced at lower densities (Figure 4a,b). Since low cell density may result in inefficient EV exchange due to a decrease in the absolute number of the EVs released in the extracellular space, we set up a compartmentalized co‐culture system where the same number of EV‐donor and EV‐recipient cells were seeded in either a Close or Far configuration. To achieve this, we printed ad hoc cell culture rings in a biocompatible material using a stereolithography 3D printer (Figure S4a,b). The rings were used to plate the cells in a confined space (Figure 4e; S4c). After cell spreading occurred, the rings were removed and media containing Bafilomycin was added to fill the dish (Figure S4d). The following day, the cells were detached and analyzed by flow cytometry to quantify the amount of EV transfer. When cells were plated in the Close configuration, the fraction of double‐positive cells was significantly higher in comparison with the cells plated in the Far configuration (Figure 4c,d). However, assuming that all the EVs that were released could freely diffuse in the extracellular space, they would follow a Gaussian Density distribution with a standard deviation of ∼1 mm after 24 h (see Estimation of EV diffusion in the material and methods section), suggesting that cells plated 40 mm from the donor cells (Far configuration) could not have been significantly exposed to the labelled EVs, since 99.7% of the particles would not be able to travel more than ∼3 mm from the donor cells.
FIGURE 4.

EV exchange is favoured by cell proximity. (a and b) Co‐cultures of HeLa cells expressing either n‐BFP or CD9‐Emerald were used to assess the impact of cell proximity on the efficiency of EV exchange. To do so, EV donor (CD9‐Emerald) and EV recipient (n‐BFP) cells were seeded at decreasing cell densities (100%–15%; confluence at 48 h). 24 h post‐seeding, the cells were treated with 50 nM Bafilomycin for an additional 24 h before analysis by flow cytometry. (a) The density plots show the density distributions of n‐BFP+ cells according to the CD9‐Emerald signal, in function of the cell density (cell confluence). The double‐positive cell populations correspond to the events in the histograms on the right side of the red line, which marks the threshold for Emerald+ signal, defined using the control population (nBFP+/Emerald− cells). The results from three independent experiments (mean ± SD) are shown in the graph in (b). Data were compared using One‐way ANOVA and Tukey's post‐hoc test (ns = not significant; **p value < 0.01). (c–e) To further explore the effect of the intercellular distance on the amount of EV transfer, custom‐made rings (1 cm radius, 0.5 cm height; see also Figure S4) were printed in a biocompatible material using a stereolithographic 3D device (Formlabs). The rings were used as mobile chambers to control the distance between EV donor and EV recipient cells when plating. The pictogram in (e) outlines the Close and Far configurations that characterize the experiment (for more details, see Figure S4a–d). Close configuration (e, Top panel): EV donor (CD9‐Emerald) and EV recipient cells (n‐BFP) were seeded together at a 1:1 ratio in one ring in the middle of the dish (100% final confluence) to generate a dense co‐culture. Far configuration (e, Bottom panel): using two connected rings (4 cm apart), an equal number of EV donor (CD9‐Emerald) and EV recipient (n‐BFP) cells were seeded in each ring. After 24 h, the rings were removed in both conditions and the dishes were filled with complete media supplemented with 50 nM Bafilomycin. 24 h post‐treatment, the cells were detached and analyzed by flow cytometry to compare the efficiency of EV transfer when the two cell types were seeded together versus separately. One representative experiment is shown in (c) while data from three independent experiments are summarized in (d). (c) n‐BFP+ cells seeded without donor cells were used as negative controls to define the threshold for Emerald+ signal (yellow distribution and red dashed line). The red and blue distributions depict the CD9‐Emerald intensities that were recorded in the n‐BFP+ recipient cell population when co‐cultured in either the Close (red) or Far (blue) configurations with CD9‐Emerald donor cells. (d) When cells were cultured in the Close configuration, 60% ± 6% (mean ± SEM) of n‐BFP+ cells had internalized CD9‐Emerald+ EVs. In contrast, only 6.4% ± 6% (mean ± SEM) of n‐BFP+ cells cultured in the Far configuration received EVs from the CD9‐Emerald donor cells located 4 cm away. The differences in EV transfer between the two configurations were statistically significant (data analysis was performed using a two‐tailed t‐test where *** p value < 0.001). To test the contribution of paracellular fluid flow in EV transport, we set up two approaches. First, we established three modalities of co‐cultures (f and g): one was plated in the Close configuration as a control of EV exchange while the other two were seeded as Far configurations. Of the two Far configurations, one co‐culture was placed on an orbital shaker at 37°C to promote media movement and simulate the flow of extracellular fluid (Far [shaken]) while the other remained stationary (Far [still]). After 24 h, the cells from each condition were detached and analyzed by flow cytometry to measure the percentage of n‐BFP+/CD9‐Emerald+ cells. n‐BFP+ cells seeded without donor cells were used as negative controls to define the minimum value limit for Emerald+ signal (yellow distribution and red dashed line). The red distribution in (f) accounts for the CD9‐Emerald intensities recorded in the n‐BFP+ cell population cultured in the Close configuration, while the blue and the green distributions account for the cells seeded in the Far (still) and Far (shaken) configurations respectively. The results from three independent experiments are reported in (g). Data were compared using One‐way ANOVA and Tukey's post‐hoc test (ns = not significant; **p value < 0.01 and ***p value < 0.001). In a second approach (h–j) we implemented a millifluidic device (see also Figure S4). The millifluidic device is composed of two chambers that can host 5 mm glass coverslips on which EV donor and/or EV recipient cells were plated. The experiment was run in different configurations to mimic exchange of EVs between neighbour cells or cells located in different districts in the presence or absence of directional flow (j). The “Close configuration” setup consisted of EV‐donor (HeLa/CD9‐Emerald) and EV‐recipient cells (HeLa/n‐BFP) mixed at 1:1 ratio and seeded onto a single glass coverslip (80% seeding density, blue/green disk, top pictogram in j). Instead, for the “Far configuration” donor and recipient cells were seeded on distinct coverslips (green disk, donor cells; blue disk recipient cells, pictogram in the middle in j). After cell spreading coverslips were placed into the millifluidic devices according to the scheme in (j). The chambers were tape‐sealed, filled with complete DMEM supplemented with Bafilomycin (50 nM), and incubated at 37°C for 18 h. In some experiments “Far configuration” set‐ups were connected to the injection system to create a directional flow (Far Flow, bottom pictogram in j) between the first chamber (containing the donor cells, on the left) and the second chamber (hosting the recipient cells, on the right). A tube connects a syringe filled with complete DMEM + Bafilomycin A1 to the chambers allowing the device to be placed in an incubator for the entire experiment. (h and i) After 18 h the coverslips were removed from the chambers and placed in a multiwell plate. Cells were detached by exposure to trypsin and analyzed by flow cytometry to measure the fraction of n‐BFP cells that internalized CD9‐Emerald EVs. A representative experiment is shown in (h). n‐BFP+ cells seeded without donor cells were used as negative controls to define the threshold for Emerald+ signal (yellow distribution and red dashed line). The graph in (i) shows the fraction of Emerald+/n‐BFP+ cells from three independent experiments. Statistical comparisons were performed using One‐way ANOVA and Tukey's post‐hoc test (ns = not significant; *p value < 0.05). (k and l) Co‐cultures of HeLa cells stably expressing CD9‐Halo labelled with HaloTag ligand JF635 (donor cells) and HeLa cells labelled with Hoechst (acceptor cells) were used to further explore the effect of the intercellular distance on the amount of EV transfer. The cells were either mixed (close configuration) or plated on different coverslips. Coverslips of donor and acceptor cells were placed in 10 cm petri dishes in two Far configurations, either distant 3 mm or 30 mm from each other secured on the bottom of the petri dish using Silicon. The dish was filled with 8 mL of complete media supplemented with 50 nM Bafilomycin. 24 h post‐treatment, the cells were detached and analyzed by flow cytometry to compare the efficiency of EV transfer when the two cell types were seeded together versus separately. One representative experiment is shown in (k) while data from three independent experiments are summarized in (l). (k) Hoechst+ cells seeded without donor cells were used as negative controls to define the threshold for JF635+ signal (yellow distribution and red dashed line). The red distribution depicts the CD9‐Halo‐JF635+ intensities that were recorded in the Hoechst+ recipient cell population when co‐cultured in Close configurations, while Far configuration distant 3 mm or 30 mm apart are plotted in blue and green, respectively. The graph in (l) shows the fraction of CD9‐Halo‐JF365+/Hoechst cells from three independent experiments. Statistical comparisons were performed using One‐way ANOVA and Tukey's post‐hoc test (ns = not significant; ****p value < 0.0001).
To include these considerations on EV diffusion in our experiment set‐up, we developed two approaches. First, we performed an additional experiment where CD9‐Emerald and n‐BFP HeLa cells seeded in the Far configuration were incubated either motionless or under continuous agitation in the presence of Bafilomycin. A co‐culture of CD9‐Emerald and n‐BFP HeLa cells plated in the Close configuration was used as a reference (Figure 4e; S4c). Interestingly, when cells were analyzed by flow cytometry, there was no significant difference in the fraction of cells that internalized EVs between the two conditions when seeded in the Far configuration (Figure 4f,g). Conversely, the fraction of internalized EVs in the cells plated in the Close configuration was significantly higher when compared with both samples plated in the Far configuration (Figure 4g).
Second, to further explore the role of fluid dynamics in EV uptake, we developed a millifluidic device that features two chambers designed to host 5 mm glass coverslips for plating EV‐donor and/or EV‐recipient cells, enabling the study of EV exchange under stationary or dynamic configurations (Figure 4j and Figure S4e–i). In the millifluidic Close configuration, donor (CD9‐Emerald HeLa) and recipient (n‐BFP HeLa) cells were co‐seeded at a 1:1 ratio on a single coverslip at 80% density, facilitating direct cell–cell contact (Figure 4j, top panel, and Figure S4g). Conversely, the millifluidic Far configuration involved seeding donor and recipient cells on separate coverslips placed in distinct chambers within the device (Figure 4j, middle and bottom panels). For some Far configuration setups, a directional flow was introduced by connecting chambers via a syringe‐driven injection system, creating a flow of media supplemented with Bafilomycin (Figure 4j, bottom panel, and Figure S4h,i). After 18 h of incubation at 37°C, cells were detached and analyzed via flow cytometry to quantify the proportion of n‐BFP cells that internalized CD9‐Emerald EVs (Figures 4h,i). There was no significant difference in EV transfer between the millifluidic Far configuration with or without directional flow, confirming that EV exchange is more efficient when cells are adjacent in two‐dimensional cell cultures.
We observed that although statistically sound, the experiments evaluating EV exchange over distance displayed a certain degree of variability (compare Figure 4d with Figure 4g,i). To investigate this further, we used HeLa cells stably expressing CD9‐Halo as donor cells. These cells were labelled with a Halo ligand conjugated with JF635, that is a fluorogenic dye with exceptional brightness (Mohar et al. 2022), to maximize EV detection. Then, to assess the role of distance more precisely, we plated donor and acceptor cells either on the same 25 mm coverslip (close configuration) or on separate coverslips. These coverslips were then secured to a 10 cm petri dish surface with silicon grease, positioned at a distance of either 3 mm or 30 mm. This experimental design allowed us to recover and analyze donor and acceptor cells separately, thereby minimizing the possibility of cross‐contamination of the two populations during flow cytometry analysis. As shown in Figure 4k,l, this approach confirmed that close proximity favours EV exchange. However, the efficiency of EV transfer was similar at both tested distances, with 5.16% ± 0.42% (mean ± SD) of acceptor cells positive for CD9‐Halo‐JF635 at 3 mm, and 4.22% ± 0.75% (mean ± SD) at 30 mm, with no statistically significant difference between the two conditions. In conclusion, these experiments revealed that cell‐to‐cell proximity significantly enhances the intercellular transfer of EVs, suggesting that EV exchange occurs more efficiently between neighbouring cells.
3.5. EVs Are Locally Exchanged
These observations raised an additional question: how far can EVs travel between adjacent cells? To explore this, we plated CD9‐Halo HeLa cells (donor cells) with HeLa cells loaded with Calcein‐AM (recipient cells) at a ratio of 1:3000 to ensure that donor cells would be surrounded by a monolayer of recipient cells (Figure 5a). After 48 h, the cells were imaged by confocal microscopy to capture images of the sparse donor cells (Figure 5b–d). We developed a segmentation protocol that identifies the donor cells and designs concentric regions of interest to measure the relative intensity of EV signal as a function of the distance from the edges of the donor cells (Figure 5f,g). Our results demonstrated that EV signal decays exponentially with increased distance from the contours of the donor cell (Figure 5e), with the maximum signal occurring within the first 14 µm (accounting for 53% of the total detected EV signal). This region roughly corresponds to the first layer of recipient cells. Moreover, 95% of the EV signal is retained within 60 µm from the donor cells, corresponding to approximately three layers of recipient cells. These results suggest that EVs are exchanged locally and are internalized by adjacent recipient cells.
FIGURE 5.

EVs are exchanged at the cell–cell interface. To assess the propagation of EVs between adjacent cells, we set up an in vitro and in vivo approach. The in vitro system was based on co‐seeding (pictogram in a) on glass coverslips HeLa cells expressing CD9‐Halo with HeLa cells labelled with Calcein‐AM at a 1:3000 ratio and 80% seeding density to maximize the possibility that EV donor cells were surrounded by a confluent monolayer of recipient cells after 48 h. 24 h post‐seeding, the cells were treated with 50 nM Bafilomycin for 24 h. Before imaging, the cells were incubated with 5 nM HaloTag ligand JF549 for 1 h to label CD9‐Halo. Additionally, the cells were incubated with Hoechst for 10 min to stain nuclei. After two washes in complete media, the cells were imaged by confocal microscopy (b). Magnification of an area at the edge of b (d) shows negligible CD9‐Halo fluorescence in comparison to the accumulation of CD9‐EVs observed within recipient cells in immediate proximity to the donor cells (magenta in c). (f) by thresholding Calcein‐AM signal and Hoechst signal it was possible to define the cytosolic area occupied by the acceptor cells (black and blue masks). The edges of the cells are highlighted by a green line. Orange arrowheads indicate EV (magenta mask) engulfed in the acceptor cells. The white coloured area indicates the extracellular space (glass surface). (g) To quantify the accumulation of EVs in recipient cells within the context of their proximity to donor cells, we developed a segmentation analysis that correlates the intensity of CD9‐Halo fluorescence with the distance from the edge of the nearest donor cell. We achieved this by normalizing the absolute CD9‐Halo intensity to the respective segmented surface area. The results in e show that 53% of EVs are transferred to cells that are within 14 µm from the edge of a donor cell, while 95% of the signal is retained within 56 µm from the edge of donor cells. The black numbers on the top of the plot indicate the fraction of EV signal detected in each surface segment (% EVs), while the red numbers the cumulative sum of the EV signal (Cumol. % EVs). The colour‐coded dots on the top of the plot correspond to the segmented surface areas shown in (g). To estimate the propagation of EVs in living tissues, we set up a tumour model (h). We injected HeLa donor and recipient cells (in a ratio of 1:100–1:200), or only HeLa recipient cells, in the flank of nude mice. After 14 days, time necessary for the tumour to grow, we dispensed Bafilomycin to the mice to prevent EV degradation. On Day 15, we injected HaloTag ligand JF635 retro‐orbitally and an additional dose of Bafilomycin ip; the following day (Day 16), the mice were sacrificed and the tissues processed for confocal imaging. A representative field of view is in (i), with the relative magnification in (j) and the result of the segmentation analysis in (k). In (k), blue masks correspond to the donor cells, while magenta show the surrounding EV signal. The intensity colour gradient defines the area of segmentation (10 µm increments). To estimate long travelling EVs we defined the amount of diffuse CD9‐Halo EV signal in tumours composed of donor and recipient cells by using as reference recipient cells distant from donor cells (e.g., Panel l). The results of the experiment are summarized in the graph in (m): the pink traces show the distribution of CD9‐Halo EV signal in function of distance from the donor cells, the red trace represents the data obtained from (i–k), while the black trace shows the average distribution of all the pink and red traces. The blue trace shows the average distribution of the diffuse CD9‐Halo signal from confocal images of tumours with donor and recipient cells (16 frames), while the yellow trace shows the average distribution of the HaloTag ligand JF635 background in tumours with only recipient cells (6 frames). Gray lines indicate the last statistically significant point between the CD9‐Halo EV signal (black) and the HaloTag ligand JF635 background (yellow), calculated using Mann Whitney U‐test, that is 40 µm of distance from the donor cells (see also Figure 5S). Data is shown as mean ± SD. (n) Cell density plays a crucial role in EV exchange. In densely packed environments, such as tissues, EVs are predominantly captured by neighbouring cells. As a result, EV‐mediated intercellular communication primarily operates as a paracrine system, effectively influencing microdomains of approximately 40 µm in diameter. In this illustration, cells are depicted as hexagons of distinct colours. To simplify the figure, only four cells are considered as donors: one purple, one green, one red, and one blue. The EVs released by these donor cells can travel to and interact with neighbouring cells. The influenced cells are colour‐coded with gradient shades corresponding to the colour of the donor cell. These gradients stand for the extent to which a cell can exert influence via EVs, based on the distance the EVs can travel from their cell of origin, as indicated by our data.
However, the motion of interstitial fluids could propel EVs to reach more distant cells in the same or in other tissues. To address this concern, we designed an in vivo approach to study EV exchange within tissues (Figure 5h) by inducing the formation of tumours composed of EV donor and recipient cells. Donor cells were labelled with CD9‐Halo, while the recipient cells were labelled with an EGFP variant (Staygold [Hirano et al. 2022]). We injected either a mixed population of HeLa EV‐donor and HeLa EV‐recipient cells or a homogenous population of HeLa recipient cells into the flanks of nude mice at a 1:200 or 1:100 ratio. Fourteen days post‐tumour cell inoculation, mice were treated with Bafilomycin for 48 h to limit EV degradation (Days 14 and 15). On Day 15, mice were also retro‐orbitally injected (Mohar et al. 2022) with the HaloTag ligand JF635 (Grimm et al. 2017) to label the CD9‐Halo donor cells and the released CD9‐Halo‐EVs. The following day (Day 16), the mice were sacrificed and tumours processed for confocal microscopy (Figure 5i,j,l, and Figure S5a–f). To quantify the accumulation of CD9‐Halo EVs in recipient cells within the context of their proximity to donor cells, we developed a segmentation analysis that correlates CD9‐Halo fluorescence with distance from the edge of the nearest donor cell (Figure 5k and Figure S5g–l). We did this by normalizing the CD9‐Halo EV signal (Figure 5k and Figure S5g–l, magenta) to the respective nearest segmented surface area of the donor cell (Figure 5k and Figure S5g–l, blue mask). When we analyzed the distribution of the EV signal, we observed that it quickly decreased from the edge of the donor cell (Figure 5m, black trace), recapitulating the results obtained in the in vitro model (Figure 5e, black trace). To unbiasedly estimate the distance that EVs can travel, we used the same segmentation analysis, but the signal distribution was computed from randomly chosen cells in tumours composed solely of recipient cells (Fig. S5n), which resulted in the averaged yellow trace in Figure 5m and Figure S5o. When we compared EV signal detected from donor cells with the HaloTag ligand JF635 background, the difference was statistically significant for the first 40 µm from the nearest edge of the donor cell (compare the black with the yellow histograms in Figure S5p).
Since the cancer cells grew in the tumour over 15 days, and during this time donor cells had constantly secreted EVs, it was possible that EVs travelled long distances and were distributed through the tumour tissues. This would have resulted in a diffuse CD9‐Halo EV signal. To consider this possibility, we calculated the CD9‐Halo EV signal from randomly chosen recipient cells in tumours composed of donor and recipient cells (Figure 5l and Figure S5m) that we called “diffuse CD9‐Halo EV signal”. When we compared the obtained averaged traces (Figure 5m, Figure S5o,p blue trace), we realized that there was no statistical significant difference between the diffuse CD9‐Halo EV signal measured in tumour composed of donor and recipient cells with the HaloTag ligand JF635 background signal measured in tumours composed only of recipient cells (compare the blue with the yellow trace or histograms in Figure 5m and Figure S5o,p). These data demonstrate that EVs released by cancer cells over the course of ∼15 days did not significantly distribute throughout the tumour, but rather that EVs, after being released, were mainly internalized and degraded by surrounding cells, suggesting that long distance travel of EVs is limited in the cancer mass.
Because the conclusions above were constrained by the sensitivity of our microscopy system and could not quantify EV‐associated signal below the background treshold, we estimated the subthreshold fraction by fitting an exponential decay to the data points exceeding the threshold (0–40 µm from the donor cell). This model predicted that 50% of the EV‐associated signal was retained within 17 µm from the donor cell boundaries (95% CI 46.6%–52.1%) and 80% (95% CI 74.1%–84.9%) within 40 µm (Figure S6a,b), supporting the previous analysis. Moreover, the model estimated that less than 5% of the EVs travel beyond 100 µm from their cell of origin within the tumour parenchyma.
In conclusion, these experiments strongly support a model in which EVs are mainly exchanged locally, at the cell–cell interface.
4. DISCUSSION
In this work, we used various approaches to investigate the dynamics of EV exchange, from single cells to the tissue models. We demonstrated an inverse correlation between EV release per cell and cell culture density, driven by the endocytic activity of surrounding cells. Using LLSM and taking advantage of the limited diffusion of EVs at cell–cell interfaces, we observed real‐time EV exchange and showed that CD9‐EVs are internalized via clathrin‐independent pathways. Our in vitro and in vivo experiments highlight the limited diffusion of EVs, challenging the assumption that any EV can mediate long‐distance intercellular communication. Rather, we propose a new paradigm where EVs are mainly contributing to short‐range intercellular communication. This is supported by our in vivo experiments, where the majority of EVs were retained within a ∼40 µm radius of their donor cells within the tumour microenvironment (Figure 5n).
Here, we discuss key findings, relevant comparisons with past studies, and the importance of both this work and the proposed model for the future understanding of EV‐mediated intercellular communication and their potential for therapeutic and diagnostic applications.
4.1. Real‐Time Visualization of EV Transfer Between Neighbouring Cells
Experiments performed thus far to elucidate the mechanisms of EV internalization have either been based on in‐bulk approaches, or limited spatial and/or temporal resolution (Verweij et al. 2021; Colombo et al. 2021). Therefore, these experiments, although informative, were unable to dissect the internalization pathways of specific subclasses of EVs in physiological conditions (Verweij et al. 2021; Colombo et al., 2021). To resolve this issue, we decided to directly visualize the exchange of EVs between cells using Lattice Light Sheet Microscopy (LLSM). The use of LLSM minimizes phototoxicity, enabling the rapid acquisition of the entire cell volume (Chen et al. 2014). This capability is essential for tracking the internalization of fast‐diffusing objects across the entire cell surface, including EVs. By capturing EV dynamics with single‐object resolution, we were able to study rare cellular events, such as EV budding and internalization, with unprecedented precision. However, despite collecting more than 12 h of movies of live cells, we observed only a few EV release and uptake events. This scarcity is likely due to two factors: (i) the relatively low release rate of EVs, with only about three EVs released per minute (as estimated from Fig. 1a) and (ii) the selective labelling of EVs with CD9, restricting observations to this specific EV subclass. This specificity, while limiting EV quantity, enhanced the clarity of the study by focusing on a well‐defined vesicle type. A critical finding of this study is that CD9‐EVs do not rely on clathrin‐mediated endocytosis for internalization. This selectivity in uptake challenges the assumption that EV internalization occurs exclusively through multiple redundant pathways and instead suggests that certain subclasses of EVs may be internalized through more defined molecular mechanisms, potentially depending on specific ligands present on their surface (Rennick et al. 2021). Although we do not further characterize the molecular machinery involved in CD9‐EV internalization, it is possible that macropinocytosis contributes to the uptake, as has recently been reported in specific cell types such as macrophages and astrocytes (Feng et al. 2010; Pantazopoulou et al. 2023). Additionally, our study focused only on cancer cells, and we cannot exclude the possibility that CD9‐EVs released by other cell types may differ in size and composition. Such differences could influence how these EVs are internalized. Likewise, variability in ligand‐receptor interactions at the surface of recipient cells may lead to the use of distinct internalization pathways, depending on the acceptor cell type.
Therefore, future studies should aim to determine the extent to which the presence of distinct ligands confers specificity for the internalization of EVs via different pathways. This understanding could enable the scientific community to classify EVs with respect to their specific internalization mechanisms. Such classifications may pave the way for developing inhibitors to limit well‐defined EV effects or for utilizing particular EV subclasses to target specific cell types or subcellular compartments.
4.2. Influence of Cell Density and Diffusion on EV Distribution and Uptake
This study demonstrates that in two‐dimensional cell cultures, while increased cell density leads to a higher absolute number of EVs in the cell supernatant, the EV release rate per cell decreases. The data suggest that sparsely distributed cells, with more exposed surface area release EVs more efficiently into the extracellular space. Conversely, EV internalization is enhanced by high cell density, with internalized EVs promptly trafficked to the endo‐lysosomal system for degradation. This is proven by the accumulation of EVs in the endo‐lysosomal network of recipient cells when lysosomal degradation is inhibited, such as through Bafilomycin treatment (Feng et al. 2010). Indeed, although Bafilomycin can also impair protein recycling (Johnson et al. 1993) and macropinocytosis (Zhang et al. 2022), potentially limiting the internalization of EVs, this effect is minimal in our cellular system since Bafilomycin administration resulted in the accumulation of CD9‐EVs in the endo‐lysosomal network.
While EV uptake was strongly favoured by proximity of the cells in the in vitro cell culture systems, a limited but measurable level of EV exchange was still observed when cells were separated by several millimetres. Moreover, our data showed that EV exchange remained comparable regardless of whether cells were placed 40 mm apart in a steady state, or in agitation. Although there were consistent trends and statistical significance of these experiments, we observed high variability, that prompted us to conduct a more controlled assay using HeLa cells stably expressing CD9‐Halo. Donor and acceptor cells were plated on separate coverslips positioned either 3 or 30 mm apart and analyzed independently. This approach allowed us to isolate the two cell populations and significantly reduce experimental noise, likely by minimizing variability introduced by transient transfection. Importantly, under these optimized conditions, only ∼5% of acceptor cells internalized EVs when plated either 3 mm or 30 mm apart, compared to ∼60% when donor and acceptor cells were intermixed. Nonetheless, the consistent 5% fraction of cells that uptake EVs observed at both ‘far’ distances suggests that EVs can travel farther than predicted by Stokes–Einstein equation, which estimates that EVs should not diffuse beyond ∼3 mm over the course of 1 day in free media. These results suggest that additional factors may influence EV diffusion in vitro, such as subtle temperature fluctuations or mechanical vibrations from the incubator.
Moreover, assuming equal exposure to freely diffusing EVs, this may reflect intrinsic heterogeneity among recipient cells, such as differences in cell cycle stage, endocytic capacity or physical positioning (e.g., at the edge of the coverslip), that could influence uptake efficiency. Further investigation will be required to elucidate these variables. For example, our system is based on immortalized cultured cancer cells, and we cannot exclude that other cell types that are more competent for particle internalization, such as macrophages (Czernek et al. 2015), could capture the fraction of EVs released in the extracellular space more efficiently.
In conclusion, these results highlight that close cell proximity significantly enhances EV exchange, and that low cell density can conversely increase the relative fraction of EVs that cells release in the supernatant. From a technological perspective, our findings indicate that optimizing cell plating strategies can significantly enhance EV production, improving scalability for drug development. Furthermore, bioengineering advancements could lead to the development of cell lines or bioreactors specifically tailored for optimized EV harvesting.
4.3. How Far Can an EV Travel?
Understanding how far EVs can travel is instrumental to elucidate their potential role in intercellular communication and as biomarkers. To this end, we combined insights from two complementary approaches: an in vitro two‐dimensional co‐culture model and an in vivo tumour model. The results across both systems were consistent, revealing that EVs are predominantly internalized by neighbouring cells, and have limited capacity for long‐range intercellular trafficking. Both systems suggested that the majority of EVs are retained within 40 µm from the cells of origin.
The tumour model was well‐designed to estimate EV distribution in a tissue over time. Given that interstitial fluid in tissues moves at speeds of 0.1–1 µm/s (Chary and Jain 1989; Munson and Shieh 2014), allowing a theoretical travel distance of 17–170 mm over 48 h, and the high frequency of donor cells within the tissue, we expected to observe a homogenous increase in the EV signal across the tissue if long‐range EV traveling occurred. Such a diffuse increase would have resulted in a significant statistical difference between the diffuse CD9‐Halo EV signal measured through the entire parenchyma in tumours composed of both donor and recipient cells and HaloTag ligand JF635 background signal in tumours composed of only recipient cells. However, no statistically significant difference was observed between these two groups. Therefore, this finding strongly suggests that EVs do not freely travel through interstitial spaces following the fluid flow as small molecules do (Chary and Jain 1989). Instead, they appear to be constrained within the tissue microenvironment and are internalized by neighbouring cells, consistent with their role as local communication vectors. Because this conclusion was constrained by the sensitivity of our microscopy system, we extended the analysis by fitting the EV‐associated signal‐distance profile above background with an exponential decay. Near exponential tails are expected for finite‐time diffusion of particles in heterogeneous media with intermittent trapping and jump‐like relocations, and are well described by continuous‐time random walk models (Hu et al. 2023; Barkai and Burov 2020). This framework is consistent with EV motion in the extracellular space, where random walks constrained by local microarchitecture govern transport, and the exponential model well captured the observed radial decay of EV‐associated signal. The model predicts that 50% of the EV‐associated signal is retained within the first 17 µm from the donor cell, 80% within 40 µm, and less than 5% of the signal extends beyond 100 µm in the tumour microenvironment.
The local accumulation of EVs underscores their primary role as short‐range signalling agents within tissues. The general inability of EVs to mediate long‐distance communication can be explained by the interplay of their release, diffusion, and internalization kinetics. Studies, including our own, estimate that cells release approximately three EVs per minute (Son et al. 2016; Chiu et al. 2016). In contrast, the endocytic capacity of surrounding cells far exceeds this rate: it is well accepted that cells can recycle their entire cell surface in roughly 1 h (Steinman et al. 1976), suggesting that EVs can be quickly endocytosed. This is due at least in part to EVs being coated with ligands (Altei et al. 2020; Higginbotham et al. 2011), which can enhance their adhesion to and internalization by neighbouring cells while also hindering their escape. The stickiness of EVs is evident from their behaviour upon release by migrating cells, as they remain stationary on the substrate where they were deposited, whether biological or synthetic (Sung et al. 2015; Ma et al. 2014). Furthermore, tissues are densely packed, and cells are interconnected by intercellular junctions that allow the diffusion of molecules with diameters smaller than 40 nm (Adil et al. 2020). This dense architecture largely prevents the escape of EVs, while allowing the quick movement of the fluids. This is also reflected in estimates showing that the majority of EVs in circulation originates from blood cells, while EVs derived from other tissues account for a fraction of the circulating EV pool (Auber and Svenningsen 2022; Li et al. 2020; Fordjour et al. 2023). These factors collectively reduce the likelihood of EVs escaping local uptake to traverse multiple cellular layers, as proven by our results, in the tumour microenvironment.
4.4. EVs as Paracrine vs. Endocrine Effectors in Various Biological Contexts
Our findings align with previous observations that EVs primarily function as paracrine effectors in intercellular communication, exerting their effects locally across various biological systems. For brevity, we discuss a few of the many examples that support this concept. First, in the central nervous system, EVs play a crucial role in maintaining tropism by paracrine secretion (Frühbeis et al. 2013; Lopez‐Leal and Court 2016). Similarly, during development, EVs have been observed to travel approximately 50 µm to mediate signalling, emphasizing their localized role in these processes (Hurbain et al. 2022). Second, EVs released by cardiomyocytes contribute to cardio protection by orchestrating paracrine signalling directed to fibroblasts (Li et al. 2021). Third, EVs released by keratinocytes can modulate the pigmentation and the morphology of melanocytes in the skin (Prospéri et al. 2024; Cicero et al. 2015). Finally, the action of EVs appears localized even in the context of antigen presentation (Lindenbergh and Stoorvogel 2018). For instance, migratory dendritic cells (DCs) home to lymphoid organs where they locally release EVs that are efficiently captured by lymph node–resident DCs (Allan et al. 2006; Montecalvo et al. 2008). In contrast, EVs isolated from cultured DCs subsequently injected into circulation are inefficient at stimulating T‐cell responses in vivo (Montecalvo et al. 2008), reinforcing the concept that EVs mediate short‐range intercellular communication.
Although EVs predominantly function locally, this does not preclude their potential to act systemically. For example, in polarized epithelial cells, EVs are primarily secreted from the apical side (Colombo et al. 2021), leading to their accumulation in bodily fluids such as bile (Masyuk et al. 2010), milk (Feng et al. 2021) or urine (Pisitkun et al. 2004). Furthermore, disease states characterized by inflammation can increase local vascular permeability and pressure, facilitating the release of EVs into circulation. Notably, long‐range signalling axes mediated by EVs have been observed under conditions that are characterized by tissue damage and/or inflammation, such as those induced by exercise (Whitham et al. 2018), obesity (Huang‐Doran et al. 2017), cancer (Wang et al. 2023; Peinado et al. 2012), or bacterial infection (Bittel et al. 2021). Our results do not contradict these observations but rather suggest that EVs detected in circulation predominantly originate from blood cells or cells located in close proximity to lymphatic vessels or capillaries, rather than being indiscriminately released from the entire tissue. This has significant implications for the use of EVs in liquid biopsy, as it suggests that not all regions of a tissue contribute equally to the circulating EV pool.
In conclusion, we have defined key factors that limit EV diffusion and quantified the effective range over which EVs can travel. Because we estimate that only about 20% of EVs are predicted to travel beyond 40 µm from their donor cells, the EV flux reaching a given recipient cell will be dominated by nearby sources. Consequently, the likelihood of eliciting a biological meaningful response is substantially higher for neighbouring donors than for distant ones, consistent with short‐range signalling. Therefore, our data suggest a model in which each cell influences, via EVs, a tissue microdomain with a radius of approximately 40 µm in the cancer microenvironment (Figure 5n). Within this microdomain, EVs support tropism and other localized effects. While our study focused on the mobility of EVs of approximately 100 nm in diameter, it is plausible that smaller EVs may travel farther in the same tissue environments, whereas larger EVs may exhibit even greater diffusion constraints. Tissue architecture may also influence EV diffusion. Cancerous tissues are characterized by high cellularity and looser intercellular connections, whereas healthy tissues are composed of more orderly cells with well‐organized intercellular spaces (Nyga et al. 2021; Almagro et al. 2022). Whether these structural differences translate into distinct local diffusion distances for EVs between cancer and normal tissues remains to be determined. Similarly, we cannot exclude the possibility that EVs with distinct composition may travel varying distances, depending on the surface‐exposed ligands that could either promote or inhibit their endocytosis by surrounding cells.
Future studies employing advanced in vivo models are required to construct a comprehensive map of tissue‐specific EV contributions to systemic circulation that take into consideration the tissue architecture, the endocytic capacity of the surrounding cells, vessel permeability, and EV composition. Such knowledge will be essential for harnessing EVs as biomarkers or therapeutic nanovectors in a targeted and effective manner.
Author Contributions
Federico Colombo: conceptualization, investigation, formal analysis, validation, writing – review and editing, methodology, data curation. Kartik Nimkar: investigation, writing – review and editing, methodology, software, formal analysis, data curation, validation. Erienne Grace Norton: methodology, investigation, writing – review and editing. Francesca Lovat: conceptualization, methodology, data curation, formal analysis, validation, investigation, writing – review and editing. Emanuele Cocucci: conceptualization, supervision, methodology, software, data curation, investigation, validation, writing—original draft, writing—review and editing, funding acquisition, project administration.
Conflicts of Interest
The authors declare no conflicts of interest.
Supporting information
Supplementary Figure: jev270169‐sup‐0001‐FigureS1.tif
Supplementary Figure: jev270169‐sup‐0002‐FigureS2.tif
Supplementary Figure: jev270169‐sup‐0003‐FigureS3.tif
Supplementary Figure: jev270169‐sup‐0004‐FigureS4.tif
Supplementary Figure: jev270169‐sup‐0005‐FigureS5.tif
Supplementary Figure: jev270169‐sup‐0006‐FigureS6.tif
Supplementary Materials: jev270169‐sup‐0007‐SuppMat.docx
Supplementary Materials: jev270169‐sup‐0008‐VideoS1.mp4
Supplementary Materials: jev270169‐sup‐0009‐VideoS2.mp4
Supplementary Materials: jev270169‐sup‐0010‐VideoS3.mp4
Supplementary Materials: jev270169‐sup‐0011‐.docx
Supplementary Materials: jev270169‐sup‐0012‐.pdf
Acknowledgements
We thank Jeff Tonniges (The Ohio State University, Campus Microscopy and Imaging Facility) for helping with TEM sample staining and image acquisition. We acknowledge the use of Microscopy, Genomics, Biospecimen Services, and Flow Cytometry Shared Resources at The Ohio State University, which are supported by the National Cancer Institute (NCI, P30CA016058). We thank the Advanced Imaging Center (AIC) at Janelia Research Campus for training on their LLSM. The AIC is jointly supported by the Howard Hughes Medical Institute and the Gordon and Betty Moore Foundation. We are grateful to Dr. Luke Lavis (HHMI Janelia Research Campus) for their valuable discussions and for generously providing Halo conjugated with Janelia Fluor ligands that significantly contributed to the success of the study. We thank Dr. Saveez Saffarian (The University of Utah) for productive discussions. E.C. was supported by the OSU Comprehensive Cancer Centre, the Ohio Cancer Research via the McCurdy/Kimball Midwest Research Fund, and NCI R01CA270251. F.C. was supported by an American–Italian Cancer Foundation Postdoctoral Research Fellowship and by a Pelotonia Postdoctoral Fellowship.
Colombo, F. , Nimkar K., Norton E. G., Lovat F., and Cocucci E.. 2025. “Exploring the Spatial Limits of Extracellular Vesicles‐Mediated Intercellular Communication.” Journal of Extracellular Vesicles 14, no. 11: e70169. 10.1002/jev2.70169
Federico Colombo and Kartik Nimkar contributed equally to this study.
Funding: This study was funded by the National Cancer Institute (Grant number R01CA270251).
Data Availability Statement
The data that support the findings of this study are available from the corresponding author upon reasonable request.
References
- Adil, M. S. , Narayanan S. P., and Somanath P. R.. 2020. “Cell–Cell Junctions: Structure and Regulation in Physiology and Pathology.” Tissue Barriers 9: 1848212. 10.1080/21688370.2020.1848212. [DOI] [PMC free article] [PubMed] [Google Scholar]
- Aguet, F. , Upadhyayula S., Gaudin R., et al. 2016. “Membrane Dynamics of Dividing Cells Imaged by Lattice Light‐Sheet Microscopy.” Molecular Biology of the Cell 27: 3418–3435. 10.1091/mbc.e16-03-0164. [DOI] [PMC free article] [PubMed] [Google Scholar]
- Allan, R. S. , Waithman J., Bedoui S., et al. 2006. “Migratory Dendritic Cells Transfer Antigen to a Lymph Node‐Resident Dendritic Cell Population for Efficient CTL Priming.” Immunity 25: 153–162. 10.1016/j.immuni.2006.04.017. [DOI] [PubMed] [Google Scholar]
- Almagro, J. , Messal H. A., Elosegui‐Artola A., Van Rheenen J., and Behrens A.. 2022. “Tissue Architecture in Tumor Initiation and Progression.” Trends in Cancer 8: 494–505. 10.1016/j.trecan.2022.02.007. [DOI] [PubMed] [Google Scholar]
- Altei, W. F. , Pachane B. C., Dos Santos P. K., et al. 2020. “Inhibition of αvβ3 Integrin Impairs Adhesion and Uptake of Tumor‐Derived Small Extracellular Vesicles.” Cell Communication and Signaling 18: 1–15. 10.1186/s12964-020-00630-w. [DOI] [PMC free article] [PubMed] [Google Scholar]
- Armstrong, D. , and Wildman D. E.. 2018. “Extracellular Vesicles and the Promise of Continuous Liquid Biopsies.” Journal of Pathology and Translational Medicine 52: 1–8. 10.4132/jptm.2017.05.21. [DOI] [PMC free article] [PubMed] [Google Scholar]
- Auber, M. , and Svenningsen P.. 2022. “An Estimate of Extracellular Vesicle Secretion Rates of Human Blood Cells.” Journal of Extracellular Biology 1: e46. 10.1002/jex2.46. [DOI] [PMC free article] [PubMed] [Google Scholar]
- Barkai, E. , and Burov S.. 2020. “Packets of Diffusing Particles Exhibit Universal Exponential Tails.” Physical Review Letter 124: 060603. 10.1103/PhysRevLett.124.060603. [DOI] [PubMed] [Google Scholar]
- Bittel, M. , Reichert P., Sarfati I., et al. 2021. “Visualizing Transfer of Microbial Biomolecules by Outer Membrane Vesicles in Microbe‐Host‐Communication In Vivo.” Journal of Extracellular Vesicles 10: e12159. 10.1002/jev2.12159. [DOI] [PMC free article] [PubMed] [Google Scholar]
- Bonsergent, E. , Grisard E., Buchrieser J., Schwartz O., Théry C., and Lavieu G.. 2021. “Quantitative Characterization of Extracellular Vesicle Uptake and Content Delivery Within Mammalian Cells.” Nature Communications 12: 1864. 10.1038/s41467-021-22126-y. [DOI] [PMC free article] [PubMed] [Google Scholar]
- Caldieri, G. , Barbieri E., Nappo G., et al. 2017. “Reticulon 3‐Dependent ER‐PM Contact Sites Control EGFR Nonclathrin Endocytosis.” Science 356: 617–624. 10.1126/science.aah6152. [DOI] [PMC free article] [PubMed] [Google Scholar]
- Carpenter, A. E. , Jones T. R., Lamprecht M. R., et al. 2006. “CellProfiler: Image Analysis Software for Identifying and Quantifying Cell Phenotypes.” Genome Biology 7: 1–11. 10.1186/gb-2006-7-10-r100. [DOI] [PMC free article] [PubMed] [Google Scholar]
- Cashikar, A. G. , and Hanson P. I.. 2019. “A Cell‐Based Assay for CD63‐Containing Extracellular Vesicles.” PLoS ONE 14: e0220007. 10.1371/journal.pone.0220007. [DOI] [PMC free article] [PubMed] [Google Scholar]
- Chary, S. R. , and Jain R. K.. 1989. “Direct Measurement of Interstitial Convection and Diffusion of Albumin in Normal and Neoplastic Tissues by Fluorescence Photobleaching.” Proceedings of the National Academy of Sciences 86: 5385–5389. 10.1073/pnas.86.14.5385. [DOI] [PMC free article] [PubMed] [Google Scholar]
- Chen, B.‐C. , Legant W. R., Wang K., et al. 2014. “Lattice Light‐Sheet Microscopy: Imaging Molecules to Embryos at High Spatiotemporal Resolution.” Science 346: 1257998. 10.1126/science.1257998. [DOI] [PMC free article] [PubMed] [Google Scholar]
- Chen, C. , Zong S., Wang Z., et al. 2016. “Imaging and Intracellular Tracking of Cancer‐Derived Exosomes Using Single‐Molecule Localization‐Based Super‐Resolution Microscope.” ACS Applied Materials & Interfaces 8: 25825–25833. 10.1021/acsami.6b09442. [DOI] [PubMed] [Google Scholar]
- Chiu, Y. J. , Cai W., Shih Y. R. V., Lian I., and Lo Y. H.. 2016. “A Single‐Cell Assay for Time Lapse Studies of Exosome Secretion and Cell Behaviors.” Small 12: 3658–3666. 10.1002/smll.201600725. [DOI] [PMC free article] [PubMed] [Google Scholar]
- Cicero, A. L. , Delevoye C., Gilles‐Marsens F., et al. 2015. “Exosomes Released by Keratinocytes Modulate Melanocyte Pigmentation.” Nature Communications 6: 7506. 10.1038/ncomms8506. [DOI] [PMC free article] [PubMed] [Google Scholar]
- Cocucci, E. , Aguet F., Boulant S., and Kirchhausen T.. 2012. “The First Five Seconds in the Life of a Clathrin‐Coated Pit.” Cell 150: 495–507. 10.1016/j.cell.2012.05.047. [DOI] [PMC free article] [PubMed] [Google Scholar]
- Cocucci, E. , Racchetti G., and Meldolesi J.. 2009. “Shedding Microvesicles: Artefacts no More.” Trends in Cell Biology 19: 43–51. 10.1016/j.tcb.2008.11.003. [DOI] [PubMed] [Google Scholar]
- Colombo, F. , Casella G., Podini P., et al. 2021. “Polarized Cells Display Asymmetric Release of Extracellular Vesicles.” Traffic 22: 98–110. 10.1111/tra.12775. [DOI] [PubMed] [Google Scholar]
- Colombo, F. , Norton E. G., and Cocucci E.. 2021. “Microscopy Approaches to Study Extracellular Vesicles.” Biochimica et Biophysica Acta ‐ General Subjects 1865: 129752. 10.1016/j.bbagen.2020.129752. [DOI] [PubMed] [Google Scholar]
- Czernek, L. , Chworos A., and Duechler M.. 2015. “The Uptake of Extracellular Vesicles Is Affected by the Differentiation Status of Myeloid Cells.” Scandinavian Journal of Immunology 82: 506–514. 10.1111/sji.12371. [DOI] [PubMed] [Google Scholar]
- Day, R. N. , and Davidson M. W.. 2009. “The Fluorescent Protein Palette: Tools for Cellular Imaging.” Chemical Society Reviews 38: 2887–2921. 10.1039/b901966a. [DOI] [PMC free article] [PubMed] [Google Scholar]
- Edgar, J. R. , Manna P. T., Nishimura S., Banting G., and Robinson M. S.. 2016. “Tetherin Is an Exosomal Tether.” Elife 5: e17180. 10.7554/eLife.17180. [DOI] [PMC free article] [PubMed] [Google Scholar]
- Elgamal, S. , Colombo F., Cottini F., Byrd J. C., and Cocucci E.. 2020. “Imaging Intercellular Interaction and Extracellular Vesicle Exchange in a Co‐Culture Model of Chronic Lymphocytic Leukemia and Stromal Cells by Lattice Light‐Sheet Fluorescence Microscopy.” in Methods in Enzymology, 645: 79–107 Academic Press Inc. 10.1016/bs.mie.2020.06.015. [DOI] [PubMed] [Google Scholar]
- Feng, D. , Zhao W.‐L., Ye Y.‐Y., et al. 2010. “Cellular Internalization of Exosomes Occurs Through Phagocytosis.” Traffic 11: 675–687. 10.1111/j.1600-0854.2010.01041.x. [DOI] [PubMed] [Google Scholar]
- Feng, X. , Chen X., Zheng X., et al. 2021. “Latest Trend of Milk Derived Exosomes: Cargos, Functions, and Applications.” Frontiers in Nutrition 8: 747294. 10.3389/fnut.2021.747294. [DOI] [PMC free article] [PubMed] [Google Scholar]
- Filipe, V. , Hawe A., and Jiskoot W.. 2010. “Critical Evaluation of Nanoparticle Tracking Analysis (NTA) by NanoSight for the Measurement of Nanoparticles and Protein Aggregates.” Pharmaceutical Research 27: 796–810. 10.1007/s11095-010-0073-2. [DOI] [PMC free article] [PubMed] [Google Scholar]
- Flanagan, L. , Weelden K. V., Ammerman C., Ethier S. P., and Welsh J.. 1999. “SUM‐159PT Cells: A Novel Estrogen Independent Human Breast Cancer Model System.” Breast Cancer Research and Treatment 58: 193–204. 10.1023/A:1006331716981. [DOI] [PubMed] [Google Scholar]
- Fordjour, F. K. , Abuelreich S., Hong X., et al. 2023. “Exomap1 mouse: a Transgenic Model for in Vivo Studies of Exosome Biology.” Extracellular Vesicle 2: 100030. 10.1016/j.vesic.2023.100030. [DOI] [PMC free article] [PubMed] [Google Scholar]
- Frühbeis, C. , Fröhlich D., Kuo W. P., et al. 2013. “Neurotransmitter‐Triggered Transfer of Exosomes Mediates Oligodendrocyte‐Neuron Communication.” Plos Biology 11: e1001604. 10.1371/journal.pbio.1001604. [DOI] [PMC free article] [PubMed] [Google Scholar]
- Gibson, D. G. , Young L., Chuang R.‐Y., Venter J. C., Hutchison C. A., and Smith H. O.. 2009. “Enzymatic Assembly of DNA Molecules up to Several Hundred Kilobases.” Nature Methods 6: 343–345. 10.1038/nmeth.1318. [DOI] [PubMed] [Google Scholar]
- Grimm, J. B. , English B. P., Chen J., et al. 2015. “A General Method to Improve Fluorophores for Live‐Cell and Single‐Molecule Microscopy.” Nature Methods 12: 244–250. 10.1038/nmeth.3256. [DOI] [PMC free article] [PubMed] [Google Scholar]
- Grimm, J. B. , Muthusamy A. K., Liang Y., et al. 2017. “A General Method to Fine‐Tune Fluorophores for Live‐Cell and In Vivo Imaging.” Nature Methods 14: 987–994. 10.1038/nmeth.4403. [DOI] [PMC free article] [PubMed] [Google Scholar]
- Gross, J. C. , Chaudhary V., Bartscherer K., and Boutros M.. 2012. “Active Wnt Proteins Are Secreted on Exosomes.” Nature Cell Biology 14: 1036–1045. 10.1038/ncb2574. [DOI] [PubMed] [Google Scholar]
- Heusermann, W. , Hean J., Trojer D., et al. 2016. “Exosomes Surf on Filopodia to Enter Cells at Endocytic Hot Spots, Traffic Within Endosomes, and Are Targeted to the ER.” Journal of Cell Biology 213: 173–184. 10.1083/jcb.201506084. [DOI] [PMC free article] [PubMed] [Google Scholar]
- Higginbotham, J. N. , Demory Beckler M., Gephart J. D., et al. 2011. “Amphiregulin Exosomes Increase Cancer Cell Invasion.” Current Biology 21: 779–786. 10.1016/j.cub.2011.03.043. [DOI] [PMC free article] [PubMed] [Google Scholar]
- Hirano, M. , Ando R., Shimozono S., et al. 2022. “A Highly Photostable and Bright Green Fluorescent Protein.” Nature Biotechnology 40: 1132–1142. 10.1038/s41587-022-01278-2. [DOI] [PMC free article] [PubMed] [Google Scholar]
- Hu, M. , Chen H., Wang H., Burov S., Barkai E., and Wang D.. 2023. “Triggering Gaussian‐to‐Exponential Transition of Displacement Distribution in Polymer Nanocomposites via Adsorption‐Induced Trapping.” ACS Nano 17: 21708–21718. 10.1021/acsnano.3c06897. [DOI] [PubMed] [Google Scholar]
- Huang‐Doran, I. , Zhang C. Y., and Vidal‐Puig A.. 2017. “Extracellular Vesicles: Novel Mediators of Cell Communication in Metabolic Disease.” Trends in Endocrinology and Metabolism 28: 3–18. 10.1016/j.tem.2016.10.003. [DOI] [PubMed] [Google Scholar]
- Hurbain, I. , Macé A.‐S., Romao M., et al. 2022. “Microvilli‐Derived Extracellular Vesicles Carry Hedgehog Morphogenic Signals for Drosophila Wing Imaginal Disc Development.” Current Biology 32: 361–373.e6. 10.1016/j.cub.2021.11.023. [DOI] [PubMed] [Google Scholar]
- Jackson, C. E. , Scruggs B. S., Schaffer J. E., and Hanson P. I.. 2017. “Effects of Inhibiting VPS4 Support a General Role for ESCRTs in Extracellular Vesicle Biogenesis.” Biophysical Journal 113: 1342–1352. 10.1016/j.bpj.2017.05.032. [DOI] [PMC free article] [PubMed] [Google Scholar]
- Johnson, L. S. , Dunn K. W., Pytowski B., and McGraw T. E.. 1993. “Endosome Acidification and Receptor Trafficking: Bafilomycin A1 Slows Receptor Externalization by a Mechanism Involving the Receptor's Internalization Motif.” Molecular Biology of the Cell 4: 1251–1266. 10.1091/mbc.4.12.1251. [DOI] [PMC free article] [PubMed] [Google Scholar]
- Joshi, B. S. , De Beer M. A., Giepmans B. N. G., and Zuhorn I. S.. 2020. “Endocytosis of Extracellular Vesicles and Release of Their Cargo From Endosomes.” ACS Nano 14, no. 4: 4444–4455. 10.1021/acsnano.9b10033. [DOI] [PMC free article] [PubMed] [Google Scholar]
- Kobayashi, T. , Vischer U. M., Rosnoblet C., et al. 2000. “The Tetraspanin CD63/lamp3 Cycles Between Endocytic and Secretory Compartments in Human Endothelial Cells.” Molecular Biology of the Cell 11: 1829–1843. 10.1091/mbc.11.5.1829. [DOI] [PMC free article] [PubMed] [Google Scholar]
- Lakshmi, S. , Essa M. M., Hartman R. E., Guillemin G. J., Sivan S., and Elumalai P.. 2020. “Exosomes in Alzheimer's Disease: Potential Role as Pathological Mediators, Biomarkers and Therapeutic Targets.” Neurochemical Research 45: 2553–2559. Preprint at. 10.1007/s11064-020-03111-1. [DOI] [PubMed] [Google Scholar]
- Lee, B. J. , Cheema Y., Bader S., and Duncan G. A.. 2021. “Shaping Nanoparticle Diffusion Through Biological Barriers to Drug Delivery.” JCIS Open 4: 100025. 10.1016/j.jciso.2021.100025. [DOI] [Google Scholar]
- Li, J. , Salvador A. M., Li G., et al. 2021. “Mir‐30d Regulates Cardiac Remodeling by Intracellular and Paracrine Signaling.” Circulation Research 128. 10.1161/CIRCRESAHA.120.317244. [DOI] [PMC free article] [PubMed]
- Li, Y. , He X., Li Q., et al. 2020. “EV‐Origin: Enumerating the Tissue‐Cellular Origin of Circulating Extracellular Vesicles Using exLR Profile.” Computational and Structural Biotechnology Journal 18: 2851–2859. 10.1016/j.csbj.2020.10.002. [DOI] [PMC free article] [PubMed] [Google Scholar]
- Li, Y. , Zhang J., Zhou K., et al. 2021. “Elevating sestrin2 Attenuates Endoplasmic Reticulum Stress and Improves Functional Recovery Through Autophagy Activation After Spinal Cord Injury.” Cell Biology and Toxicology 37: 401–419. 10.1007/s10565-020-09550-4. [DOI] [PubMed] [Google Scholar]
- Lindenbergh, M. F. S. , and Stoorvogel W.. 2018. “Antigen Presentation by Extracellular Vesicles From Professional Antigen‐Presenting Cells.” Annual Review of Immunology 36: 435–459. 10.1146/annurev-immunol-041015-055700. [DOI] [PubMed] [Google Scholar]
- Lo, Y. M. D. , and Lam W. K. J.. 2020. “Towards Multi‐Cancer Screening Using Liquid Biopsies.” Nature Reviews Clinical Oncology 17: 525–526. 10.1038/s41571-020-0404-0. [DOI] [PubMed] [Google Scholar]
- Lopez‐Leal, R. , and Court F. A.. 2016. “Schwann Cell Exosomes Mediate Neuron–Glia Communication and Enhance Axonal Regeneration.” Cellular and Molecular Neurobiology 36: 429–436. Preprint at. 10.1007/s10571-015-0314-3. [DOI] [PMC free article] [PubMed] [Google Scholar]
- Los, G. V. , Encell L. P., Mcdougall M. G., et al. 2008. “HaloTag: A Novel Protein Labeling Technology for Cell Imaging and Protein Analysis.” ACS Chemical Biology 3: 373–382. 10.1021/cb800025k. [DOI] [PubMed] [Google Scholar]
- Ma, L. , Li Y., Peng J., et al. 2014. “Discovery of the Migrasome, an Organelle Mediating Release of Cytoplasmic Contents During Cell Migration.” Cell Research 25: 24–38. 10.1038/cr.2014.135. [DOI] [PMC free article] [PubMed] [Google Scholar]
- Masyuk, A. I. , Huang B. Q., Ward C. J., et al. 2010. “Biliary Exosomes Influence Cholangiocyte Regulatory Mechanisms and Proliferation Through Interaction With Primary Cilia.” American Journal of Physiology Gastrointestinal and Liver Physiology 299: G990–G999. 10.1152/ajpgi.00093.2010. [DOI] [PMC free article] [PubMed] [Google Scholar]
- Mathieu, M. , Névo N., Jouve M., et al. 2021. “Specificities of Exosome Versus Small Ectosome Secretion Revealed by Live Intracellular Tracking of CD63 and CD9.” Nature Communications 12: 2020.10.27.323766. 10.1038/s41467-021-24384-2. [DOI] [PMC free article] [PubMed] [Google Scholar]
- Maugeri, M. , Nawaz M., Papadimitriou A., et al. 2019. “Linkage Between Endosomal Escape of LNP‐mRNA and Loading Into EVs for Transport to Other Cells.” Nature Communications 10: 4333. 10.1038/s41467-019-12275-6. [DOI] [PMC free article] [PubMed] [Google Scholar]
- Mohar, B. , Michel G., Wang Y. Z., et al. 2025. “DELTA: A Method for Brain‐Wide Measurement of Synaptic Protein Turnover Reveals Localized Plasticity During Learning. 28: 1089–1098.” 10.1101/2022.11.12.516226. [DOI] [PMC free article] [PubMed] [Google Scholar]
- Montecalvo, A. , Shufesky W. J., Beer Stolz D., et al. 2008. “Exosomes as a Short‐Range Mechanism to Spread Alloantigen Between Dendritic Cells During T Cell Allorecognition.” Journal of Immunology 180: 3081–3090. 10.4049/jimmunol.180.5.3081. [DOI] [PubMed] [Google Scholar]
- Munson, J. M. , and Shieh A. C.. 2014. “Interstitial Fluid Flow in Cancer: Implications for Disease Progression and Treatment.” Cancer Management and Research 6: 317–328. 10.2147/CMAR.S65444. [DOI] [PMC free article] [PubMed] [Google Scholar]
- Nyga, A. , Muñoz J. J., Dercksen S., et al. 2021. “Oncogenic RAS Instructs Morphological Transformation of Human Epithelia via Differential Tissue Mechanics.” Science Advances 7: 6467–6480. 10.1126/sciadv.abg6467. [DOI] [PMC free article] [PubMed] [Google Scholar]
- Ortega, F. G. , Roefs M. T., De Miguel Perez D., et al. 2019. “Interfering With Endolysosomal Trafficking Enhances Release of Bioactive Exosomes.” Nanomedicine 20: 102014. 10.1016/j.nano.2019.102014. [DOI] [PubMed] [Google Scholar]
- Pang, B. , Zhu Y., Ni J., et al. 2020. “Extracellular Vesicles: The Next Generation of Biomarkers for Liquid Biopsy‐Based Prostate Cancer Diagnosis.” Theranostics 10: 2309–2326. 10.7150/thno.39486. [DOI] [PMC free article] [PubMed] [Google Scholar]
- Pantazopoulou, M. , Lamprokostopoulou A., Karampela D. S., et al. 2023. “Differential Intracellular Trafficking of Extracellular Vesicles in Microglia and Astrocytes.” Cellular and Molecular Life Sciences 80: 1–25. 10.1007/s00018-023-04841-5. [DOI] [PMC free article] [PubMed] [Google Scholar]
- Peinado, H. , Alečković M., Lavotshkin S., et al. 2012. “Melanoma Exosomes Educate Bone Marrow Progenitor Cells Toward a Pro‐Metastatic Phenotype Through MET.” Nature Medicine 18: 883–891. 10.1038/nm.2753. [DOI] [PMC free article] [PubMed] [Google Scholar]
- Picca, A. , Guerra F., Calvani R., Coelho‐Junior H. J., Bucci C., and Marzetti E.. 2022. “Circulating Extracellular Vesicles: Friends and Foes in Neurodegeneration.” Neural Regeneration Research 17: 534–542. 10.4103/1673-5374.320972. [DOI] [PMC free article] [PubMed] [Google Scholar]
- Pinnell, J. R. , Cui M., and Tieu K.. 2021. “Exosomes in Parkinson Disease.” Journal of Neurochemistry 157: 413–428. 10.1111/jnc.15288. [DOI] [PMC free article] [PubMed] [Google Scholar]
- Pisitkun, T. , Shen R. F., and Knepper M. A.. 2004. “Identification and Proteomic Profiling of Exosomes in Human Urine.” PNAS 101: 13368–13373. 10.1073/pnas.0403453101. [DOI] [PMC free article] [PubMed] [Google Scholar]
- Prospéri, M. T. , Giordano C., Gomez‐Duro M., et al. 2024. “Extracellular Vesicles Released by Keratinocytes Regulate Melanosome Maturation, Melanocyte Dendricity, and Pigment Transfer.” PNAS 121: e2321323121. 10.1073/pnas.2321323121. [DOI] [PMC free article] [PubMed] [Google Scholar]
- Rennick, J. J. , Johnston A. P. R., and Parton R. G.. 2021. “Key Principles and Methods for Studying the Endocytosis of Biological and Nanoparticle Therapeutics.” Nature Nanotechnology 16: 266–276. 10.1038/s41565-021-00858-8. [DOI] [PubMed] [Google Scholar]
- Rikkert, L. G. , Nieuwland R., Terstappen L. W. M. M., and Coumans F. A. W.. 2019. “Quality of Extracellular Vesicle Images by Transmission Electron Microscopy Is Operator and Protocol Dependent.” Journal of Extracellular Vesicles 8: 1555419. 10.1080/20013078.2018.1555419. [DOI] [PMC free article] [PubMed] [Google Scholar]
- Savina, A. , Furlán M., Vidal M., and Colombo M. I.. 2003. “Exosome Release Is Regulated by a Calcium‐Dependent Mechanism in K562 Cells.” Journal of Biological Chemistry 278: 20083–20090. 10.1074/jbc.M301642200. [DOI] [PubMed] [Google Scholar]
- Son, K. J. , Rahimian A., Shin D.‐S., Siltanen C., Patel T., and Revzin A.. 2016. “Microfluidic Compartments With Sensing Microbeads for Dynamic Monitoring of Cytokine and Exosome Release From Single Cells.” Analyst 141: 679–688. 10.1039/C5AN01648G. [DOI] [PubMed] [Google Scholar]
- Steinman, R. M. , Brodie S. E., and Cohn Z. A.. 1976. “Membrane Flow During Pinocytosis. A Stereologic Analysis.” Journal of Cell Biology 68: 665–687. 10.1083/jcb.68.3.665. [DOI] [PMC free article] [PubMed] [Google Scholar]
- Sung, B. H. , Ketova T., Hoshino D., Zijlstra A., and Weaver A. M.. 2015. “Directional Cell Movement Through Tissues Is Controlled by Exosome Secretion.” Nature Communications 6: 1–14. 10.1038/ncomms8164. [DOI] [PMC free article] [PubMed] [Google Scholar]
- Tapper, H. , and Sundler R.. 1995. “Bafilomycin A1 Inhibits Lysosomal, Phagosomal, and Plasma Membrane H+‐ATPase and Induces Lysosomal Enzyme Secretion in Macrophages.” Journal of Cellular Physiology 163: 137–144. 10.1002/jcp.1041630116. [DOI] [PubMed] [Google Scholar]
- Vader, P. , Breakefield X. O., and Wood M. J. a. 2014. “Extracellular Vesicles: Emerging Targets for Cancer Therapy.” Trends in Molecular Medicine 20: 385–393. 10.1016/j.molmed.2014.03.002. [DOI] [PMC free article] [PubMed] [Google Scholar]
- Verweij, F. J. , Balaj L., Boulanger C. M., et al. 2021. “The Power of Imaging to Understand Extracellular Vesicle Biology In Vivo.” Nature Methods 18: 1013–1026. 10.1038/s41592-021-01206-3. [DOI] [PMC free article] [PubMed] [Google Scholar]
- Vestad, B. , Llorente A., Neurauter A., et al. 2017. “Size and Concentration Analyses of Extracellular Vesicles by Nanoparticle Tracking Analysis: A Variation Study.” Journal of Extracellular Vesicles 6: 1344087. 10.1080/20013078.2017.1344087. [DOI] [PMC free article] [PubMed] [Google Scholar]
- Wait, E. , Winter M., and Cohen A. R.. 2019. “Hydra Image Processor: 5‐D GPU Image Analysis Library With MATLAB and Python Wrappers.” Bioinformatics 35: 5393–5395. 10.1093/bioinformatics/btz523. [DOI] [PMC free article] [PubMed] [Google Scholar]
- Wang, G. , Li J., Bojmar L., et al. 2023. “Tumour Extracellular Vesicles and Particles Induce Liver Metabolic Dysfunction.” Nature 618: 374–382. 10.1038/s41586-023-06114-4. [DOI] [PMC free article] [PubMed] [Google Scholar]
- Welsh, J. A. , Goberdhan D. C. I., O'Driscoll L., et al. 2024. “Minimal Information for Studies of Extracellular Vesicles (MISEV2023): From Basic to Advanced Approaches.” Journal of Extracellular Vesicles 13: e12404. 10.1002/jev2.12404. [DOI] [PMC free article] [PubMed] [Google Scholar]
- Whitham, M. , Parker B. L., Friedrichsen M., et al. 2018. “Extracellular Vesicles Provide a Means for Tissue Crosstalk During Exercise.” Cell metabolism 27: 237–251.e4. 10.1016/j.cmet.2017.12.001. [DOI] [PubMed] [Google Scholar]
- Willy, N. M. , Colombo F., Huber S., et al. 2021. “CALM Supports Clathrin‐Coated Vesicle Completion Upon Membrane Tension Increase.” PNAS 118: e2010438118. 10.1073/pnas.2010438118. [DOI] [PMC free article] [PubMed] [Google Scholar]
- Yekula, A. , Muralidharan K., Kang K. M., Wang L., Balaj L., and Carter B. S.. 2020. “From Laboratory to Clinic: Translation of Extracellular Vesicle Based Cancer Biomarkers.” Methods 177: 58–66. 10.1016/j.ymeth.2020.02.003. [DOI] [PMC free article] [PubMed] [Google Scholar]
- Zhang, M. S. , Cui J. D., Lee D., et al. 2022. “Hypoxia‐Induced Macropinocytosis Represents a Metabolic Route for Liver Cancer.” Nature Communications 13: 954. 10.1038/s41467-022-28618-9. [DOI] [PMC free article] [PubMed] [Google Scholar]
- Zheng, Q. , and Lavis L. D.. 2017. “Development of Photostable Fluorophores for Molecular Imaging.” Current Opinion in Chemical Biology 39: 32–38. 10.1016/j.cbpa.2017.04.017. [DOI] [PubMed] [Google Scholar]
Associated Data
This section collects any data citations, data availability statements, or supplementary materials included in this article.
Supplementary Materials
Supplementary Figure: jev270169‐sup‐0001‐FigureS1.tif
Supplementary Figure: jev270169‐sup‐0002‐FigureS2.tif
Supplementary Figure: jev270169‐sup‐0003‐FigureS3.tif
Supplementary Figure: jev270169‐sup‐0004‐FigureS4.tif
Supplementary Figure: jev270169‐sup‐0005‐FigureS5.tif
Supplementary Figure: jev270169‐sup‐0006‐FigureS6.tif
Supplementary Materials: jev270169‐sup‐0007‐SuppMat.docx
Supplementary Materials: jev270169‐sup‐0008‐VideoS1.mp4
Supplementary Materials: jev270169‐sup‐0009‐VideoS2.mp4
Supplementary Materials: jev270169‐sup‐0010‐VideoS3.mp4
Supplementary Materials: jev270169‐sup‐0011‐.docx
Supplementary Materials: jev270169‐sup‐0012‐.pdf
Data Availability Statement
The data that support the findings of this study are available from the corresponding author upon reasonable request.