Abstract
The G protein Gsα is essential for hormone-stimulated cAMP generation and is an important metabolic regulator. We investigated the role of liver Gs-signaling pathways by developing mice with liver-specific Gsα deficiency (LGsKO mice). LGsKO mice had increased liver weight and glycogen content and reduced adiposity, whereas survival, body weight, food intake, and metabolic rates at ambient temperature were unaffected. LGsKO mice had increased glucose tolerance with both increased glucose-stimulated insulin secretion and increased insulin sensitivity in liver and muscle. Fed LGsKO mice were hypoglycemic and hypoinsulinemic, with low expression of hepatic gluconeogenic enzymes and PPARγ coactivator–1. However, LGsKO mice maintained normal fasting glucose and insulin levels, probably due to prolonged breakdown of glycogen stores and possibly increased extrahepatic gluconeogenesis. Lipid metabolism was unaffected in fed LGsKO mice, but fasted LGsKO mice had increased lipogenic and reduced lipid oxidation gene expression in liver and increased serum triglyceride and FFA levels. LGsKO mice had very high serum glucagon and glucagon-like peptide–1 levels and pancreatic α cell hyperplasia, probably secondary to hepatic glucagon resistance and/or chronic hypoglycemia. Our results define novel roles for hepatic Gs-signaling pathways in glucose and lipid regulation, which may prove useful in designing new therapeutic targets for diabetes and obesity.
Introduction
Glucose production and utilization are regulated by a complex hormonal system that keeps serum glucose levels in a narrow range. Insulin stimulates glucose uptake, glycolysis, and glycogen synthesis and inhibits gluconeogenesis (1). These actions are counteracted by various hormones, including glucagon, epinephrine, growth hormone, and glucocorticoids, which stimulate glycogenolysis and gluconeogenesis primarily in the liver. Insulin also promotes lipogenesis and inhibits fatty acid release and metabolism, while counterregulatory hormones have opposite effects on lipid metabolism. One hallmark of diabetes is dysregulated hepatic glucose production, which results from both insulin resistance and elevated glucagon levels (2). Inhibiting glucagon action may reverse many of the features of diabetes (3–6), although there may be a greater predilection for fasting hypoglycemia (5). It is unclear to what extent the whole-body metabolic effects of glucagon and other counterregulatory hormones result from their actions on the liver, as receptors for these hormones are present in many tissues.
Glucagon binds to a 7-transmembrane receptor, which activates the heterotrimeric G protein Gs, a ubiquitously expressed G protein that couples many receptors to adenylyl cyclase and is required for hormone-stimulated cAMP production (7, 8). cAMP mediates many of its effects by stimulating cAMP-dependent protein kinase, which phosphorylates many substrates including cAMP response element–binding protein (CREB) (9). While most of the metabolic actions of glucagon and epinephrine are mediated through this pathway, both may stimulate other pathways, such as phospholipase C and protein kinase C pathways, through other G proteins (10). We have previously created mice with genetic disruption of Gnas, the gene encoding the stimulatory G protein α subunit (Gsα) and other alternative gene products (11). These mice had a complicated phenotype, with significant metabolic changes, including increased insulin sensitivity (12–14). However, it is difficult to evaluate the effects of Gsα deficiency in specific metabolic tissues in these mice, as only heterozygotes survived. Moreover, the original mutation also disrupted expression of alternative Gnas gene products, which are generated by alternative promoters and first exons (15). To address this latter issue, we have recently generated mice with a germline deletion of Gsα exon 1, which specifically disrupts Gsα expression (16). However the use of this model to examine tissue-specific roles of Gsα is limited by the fact that these mice are also heterozygous and subject to imprinting effects. To address this problem, we have now generated Gsα floxed mice with loxP recombination sites surrounding Gsα exon 1, which can be used to study the effects of complete Gsα deficiency in specific tissues without affecting the expression of other Gnas gene products. In this study, we use this system to examine the metabolic effects of disrupting the Gsα pathway in liver.
Results
Generation and characterization of liver-specific Gs α–knockout mice.
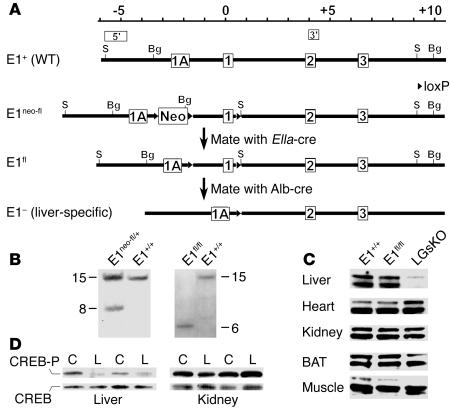
To develop liver-specific Gsα–knockout (LGsKO) mice, we first generated mice that contained loxP sites surrounding Gsα exon 1 (E1fl allele; Figure 1A and Methods). Correct initial targeting and removal of the Neo cassette were confirmed by Southern blot analysis of tail genomic DNA using 5′ and 3′ probes (Figure 1, A and B, and data not shown). LGsKO mice were generated by repeated mating of E1fl/+ and E1fl/fl mice with albumin promoter–cre–transgenic mice (Alb-cre), a line that has specific and highly efficient loxP recombination in hepatocytes (17). Efficient liver-specific deletion of Gsα exon 1 in LGsKO mice was confirmed by PCR (data not shown). Immunoblotting of tissue lysates using a Gsα-specific antibody showed markedly reduced Gsα protein expression in liver, with no change in kidney, muscle, brown adipose tissue (BAT), or heart (Figure 1C). The minimal residual hepatic Gsα expression likely reflects Gsα expression in liver stromal, vascular, and Kupffer cells. There was no effect on Gsα expression in E1fl/flAlb-cre–) littermates (Figure 1C). Because of this, as well as the fact that these mice were phenotypically similar to E1+/+ mice, all E1+/+ or Alb-cre– littermates were used as controls. Consistent with the presence of liver-specific Gsα deficiency, isoproterenol-stimulated CREB phosphorylation was markedly reduced in liver, but not in kidneys, of LGsKO mice relative to controls (Figure 1D).
Figure 1.
Generation of LGsKO mice. (A) The upstream portion of the wild-type Gnas allele (E1+) including alternative first exon 1A and Gsα exons 1, 2, and 3 is shown at the top, with the positions of the 5′ and 3′ probes used for Southern blot analysis shown above. The scale is in kilobases, with position 0 being the Gsα translational start site. The E1neo-fl allele is shown below E1+, with loxP sites represented as triangles. E1neo-fl mice were mated with EIIa-cre mice to generate mice with the E1fl allele. Repeated mating of E1fl and Alb-cre–transgenic mice produced LGsKO (E1fl/flAlb-cre+) mice with liver-specific deletion of Gsα exon 1 (E1–) in both alleles. S, SacI; Bg, BglII; Neo, neomycin resistance gene. (B) Southern blot analysis of founder mice (2 left lanes) or offspring of E1neo-fl mice crossed with EIIa-cre mice (2 right lanes) after SacI digestion and hybridization with the 5′ probe. Genotypes are indicated above each lane. (C) Immunoblot analysis of protein extracts (60 μg/lane) of various tissues from E1+/+, E1fl/fl, and LGsKO mice, using a Gsα-specific antibody. The doublet represents the long and short forms of Gsα produced by alternative splicing of exon 3. (D) Immunoblot of liver (left) and kidney (right) extracts from control (C) and LGsKO mice (L) with anti–phospho-CREB (CREB-P; top row) and anti-CREB Abs (bottom row). Pairs are indicated by the lines above.
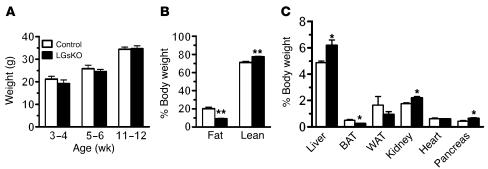
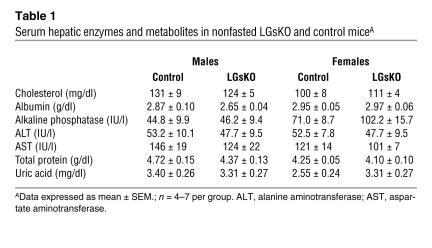
LGsKO mice have normal survival, no obvious phenotype on visual inspection, and normal body weight (Figure 2A). Liver weights were approximately 25% greater in LGsKO mice (Figure 2C), which may be accounted for by the fact that LGsKO mice have increased glycogen stores in the fed state (see below). Overall liver function was normal in LGsKO mice, based upon the fact that these mice had no differences in serum hepatic enzymes, albumin, total protein, cholesterol, and uric acid (Table 1) or gross changes in liver histology (data not shown). Body composition analysis by NMR showed LGsKO mice to have reduced fat mass (Figure 2B). Consistent with this, the relative weights of both BAT and white adipose tissue (WAT) pads were reduced in LGsKO mice (Figure 2C).
Figure 2.
Body weight, organ weights, and body composition. (A) Body weights of male LGsKO mice (black bars) and controls (white bars) at indicated ages (n = 16/group). (B) Body composition determined by NMR analysis (n = 5–6/group). (C) Organ weights expressed as percent of total body weights (n = 4–6/group). WAT, epididymal WAT. *P < 0.05; **P < 0.01.
Table 1.
Serum hepatic enzymes and metabolites in nonfasted LGsKO and control miceA
LGsKO mice have both increased glucose-stimulated insulin secretion and increased insulin sensitivity.
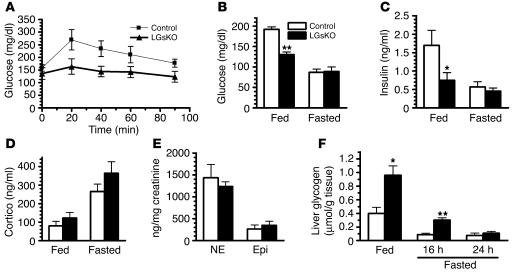
Consistent with loss of hepatic glucagon/Gsα signaling, LGsKO mice did not have the hyperglycemic response to glucagon that was present in controls (Figure 3A). Serum glucose and insulin levels were both significantly lower in fed LGsKO mice relative to controls (Figure 3, B and C). Glucose levels tended to also be lower in LGsKO mice after 6 or 16 hours of fasting, although the differences were not significant (data not shown). However, by 24 hours of fasting, both glucose and insulin levels were reduced to similar levels in control and LGsKO mice (Figure 3, B and C). The ability of LGsKO mice to maintain normal fasting glucose levels is not primarily due to overcompensation by other counterregulatory hormones, as fed and fasted serum corticosterone levels were only slightly elevated, and these changes were not significant (Figure 3D). Moreover, urinary norepinephrine and epinephrine levels were not altered in overnight-fasted LGsKO mice (Figure 3E). One possible explanation for the ability of LGsKO mice to maintain euglycemia after prolonged fasting is the fact that they accumulate more than 2-fold greater stores of liver glycogen during the fed state (Figure 3F). While glycogen stores were depleted in controls by 16 hours of fasting, LGsKO mice still had significant glycogen stores, which continued to be broken down to glucose between 16 to 24 hours of fasting.
Figure 3.
Glucose metabolism in fed and fasted LGsKO mice. (A) Blood glucose was measured at indicated times before and after glucagon administration in LGsKO (filled triangles) and control (filled squares) mice (n = 5/group). Serum glucose (B), insulin (C), and corticosterone (Cortico; D) levels in fed (left) and fasted (right) LGsKO and control mice (n = 5–7/group). (E) Urine norepinephrine (NE) and epinephrine (Epi) levels corrected for urine creatinine in overnight-fasted mice (n = 9/group). (F) Liver glycogen content in fed and 16-hour- and 24-hour-fasted mice (n = 6–7/group). *P < 0.05; **P < 0.01.
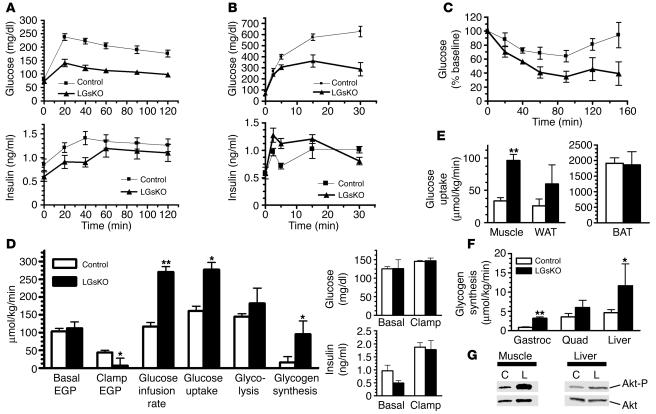
Glucose tolerance tests showed glucose levels to be significantly lower in LGsKO mice than in controls at all time points after glucose administration (Figure 4A). Although LGsKO mice had lower insulin levels throughout the study, these levels, particularly toward the end of the study, appeared to be inappropriately elevated given the large disparity in glucose levels between LGsKO mice and controls. First- and second-phase insulin secretory response after administration of high-dose glucose was greater in LGsKO mice, in spite of the fact that these mice achieved much lower serum glucose levels (Figure 4B). This greater insulin secretory response in LGsKO mice is most likely secondary to the fact that these mice have increased serum levels of glucagon-like peptide–1 (GLP-1), an incretin hormone known to increase pancreatic β cell survival and insulin secretion (see below) (18).
Figure 4.
Glucose tolerance, insulin sensitivity, and secretion. (A) Blood glucose (top) and serum insulin (bottom) was measured at indicated time points before and after i.p. glucose administration (2 mg/g body weight) in overnight-fasted LGsKO (filled triangles) and control (filled squares) mice (n = 13–15/group). (B) Short-term glucose tolerance test using 3 mg/g glucose (n = 6/group). (C) Blood glucose was measured before and after i.p. insulin administration (n = 3/group). (D) Whole-body glucose fluxes in LGsKO and control mice during euglycemic-hyperinsulinemic clamp studies (n = 3–7/group). EGP, endogenous glucose production. Basal and clamp glucose and insulin levels are shown on the right. (E) Tissue glucose uptake rates during clamp studies. (F) Glycogen synthesis rates in gastrocnemius (Gastroc) and quadriceps (Quad) muscles and liver during clamp studies. (G) Immunoblot of muscle (left) and liver (right) extracts from control and LGsKO mouse with anti–phospho-Akt1 (top) and anti-Akt Abs (bottom). *P < 0.05; **P < 0.01.
Insulin tolerance tests showed that LGsKO mice have a greater than normal hypoglycemic response to insulin, consistent with greater whole-body insulin sensitivity in LGsKO (Figure 4C). Glucose levels failed to rebound in LGsKO mice, possibly due to loss of counterregulatory hormone action in the livers of these mice. These results were confirmed in euglycemic-hyperinsulinemic clamp studies. Prior to the clamp, LGsKO mice and controls had similar endogenous glucose production rates, despite the fact that LGsKO mice had lower insulin levels, consistent with greater insulin sensitivity in liver (Figure 4D). The insulin infusion was adjusted in order to maintain similar levels of blood glucose and insulin during the clamp (Figure 4D). Glucose infusion rates and rates of whole-body glucose uptake and glycogen synthesis during the clamp were significantly greater in LGsKO mice, with a 3-fold greater glucose uptake in skeletal muscle and an almost 2-fold greater glucose uptake in WAT (Figure 4, D and E). Glucose uptake in BAT was unaffected in LGsKO mice. Glycogen synthesis in both muscle and liver was significantly greater in LGsKO mice during the clamp (Figure 4F), consistent with fed LGsKO mice having higher liver glycogen content. In addition, endogenous glucose production rate was suppressed to a significantly greater degree in LGsKO mice (Figure 4D). Consistent with the clamp results, Akt phosphorylation after insulin administration was increased in both liver and skeletal muscle (Figure 4G). Overall, these findings demonstrate that LGsKO mice have increased insulin sensitivity in liver and muscle, and probably in WAT as well.
Changes in lipid metabolism in LGsKO mice.
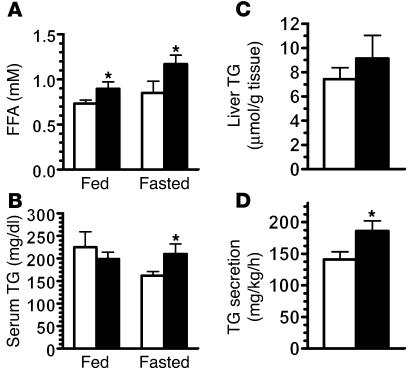
Despite having reduced adiposity, LGsKO mice had significantly increased serum FFA levels in both the fed and fasted states (Figure 5A). This may be secondary to increased lipolysis in adipose tissue due to low circulating insulin levels and high circulating levels of glucagon. In the fed state, serum triglycerides were similar in control and LGsKO mice (Figure 5B). While triglyceride levels fell in control mice after 24 hours of fasting, they were unaffected by fasting in LGsKO mice, resulting in significantly elevated levels in fasted LGsKO mice relative to controls. LGsKO mice had only a minimal increase in liver triglyceride content (Figure 5C) but had an increased rate of triglyceride secretion (Figure 5D), consistent with increased hepatic lipogenesis. Fasted LGsKO mice have increased hepatic expression of genes involved in lipogenesis and reduced expression of genes involved in fatty acid oxidation (see below). LGsKO mice were also unable to clear an intragastrically administered triglyceride load (data not shown). LGsKO mice had normal fed and fasting levels of β-hydroxybutyrate (data not shown).
Figure 5.
Lipid metabolism in LGsKO mice. Serum (A) FFA and (B) triglyceride (TG) levels in LGsKO (black bars) and control (white bars) mice (n = 5–7/group). (C) Liver triglyceride content (n = 7/group). (D) Triglyceride secretion rates (n = 4–5/group). *P < 0.05.
Food intake and metabolic rates in LGsKO mice.
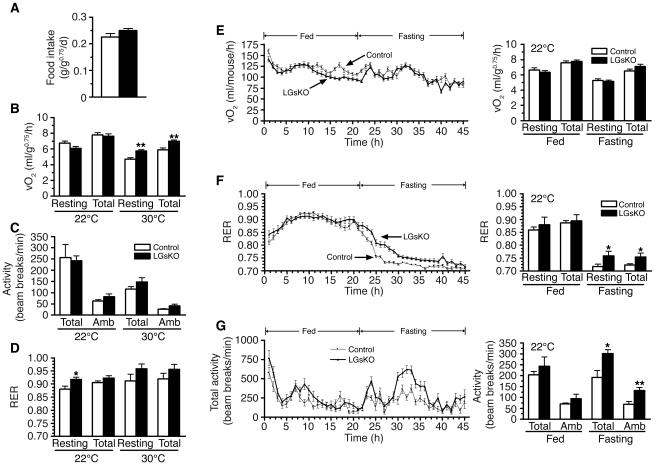
Food intake measured over 14 days was no different between control and LGsKO mice (Figure 6A). There were also no differences in resting or total energy expenditure rates (measured as rate of O2 consumption over 24 hours) or in activity levels at ambient temperature (22°C) (Figure 6, B and C). These results are consistent with the fact that LGsKO mice have normal body weight and no change in sympathetic nervous system activity based upon urinary catecholamine measurements. However, LGsKO mice had increased resting and total energy expenditure rates at 30°C, a thermoneutral temperature at which energy requirements for adaptive thermogenesis are minimized (Figure 6B). There were no differences in activity levels at 30°C. There were also no differences in respiratory exchange ratios (RERs; ratio of CO2 produced to O2 consumed), except for a small increase in resting RER at 22°C in LGsKO mice (Figure 6D).
Figure 6.
Food intake, energy expenditure, and activity studies. (A) Food intake measured over 14 days in LGsKO (black bars) and control (white bars) mice (n = 6/group). (B) Resting and total O2 consumption, (C) total and ambulatory (Amb) activity levels, and (D) resting and total RER measured over 24 hours at 22°C (left) and 30°C (right) (n = 6/group). Time course of total O2 consumption rate (E), total RER (F), and total activity(G) over a 45-hour period (fed, hours 1–21; fasting, hours 22–45) at 22°C in LGsKO (filled triangles) and control (filled squares) mice (n = 6/group). To the right of each graph are panels showing the mean ± SEM of each parameter during the fed and fasting periods.*P < 0.05; **P < 0.01. vO2, volume of O2 consumed.
We next examined energy expenditure, RER, and activity over a 45-hour period during which mice were provided food for the first 21 hours (hours 1–21) and then fasted over the next 24 hours (hours 22–45). There were no differences in resting or total energy expenditure between LGsKO mice and controls during either the fed or fasting periods (Figure 6E). While there were no differences in RER during the fed period, LGsKO mice had significantly greater RERs during the fasting period (Figure 6F). As RER reflects the ratio of carbohydrate to fatty acid oxidation, these results are consistent with LGsKO mice using a relative greater ratio of carbohydrate as a fuel source during the fast. This most likely is due to the fact that these mice have greater liver (and possibly muscle) glycogen stores that are available as a glucose source for a longer period of time during the fast. LGsKO mice also have increased activity levels during the fasting period (Figure 6G), but the underlying cause of this difference is unclear.
Gene expression changes in LGsKO mice.
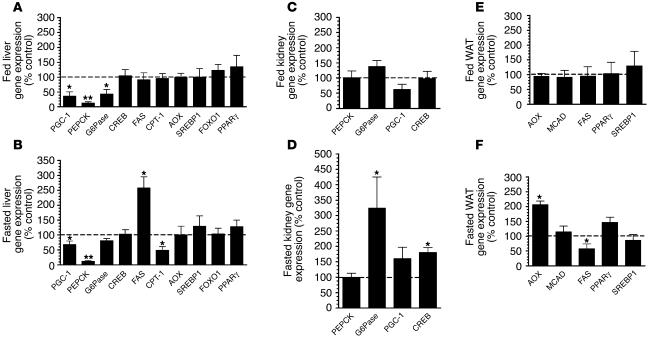
The expression of genes for various transcription factors and enzymes involved in metabolic regulation were measured by real-time quantitative RT-PCR. The Gsα/cAMP pathway, which mediates the actions of glucagon, leads to CREB phosphorylation and activation, which stimulates the expression of the PPARγ coactivator–1 (PGC-1) gene (19, 20). PGC-1, in concert with transcriptional cofactors, stimulates gluconeogenesis and fatty acid oxidation and inhibits fatty acid synthesis through regulation of genes encoding metabolic enzymes (19–24). Isoproterenol-stimulated CREB phosphorylation in liver was reduced in LGsKO mice (Figure 1D). Consistent with this, hepatic expression of PGC-1 and phosphoenolpyruvate carboxykinase (PEPCK), the rate-limiting enzyme for gluconeogenesis, were both markedly reduced in both fed and fasted LGsKO mice (Figure 7, A and B). Expression of glucose-6-phosphatase (G6Pase), which catalyzes the final step of glucose production, was also significantly reduced in the fed state and somewhat reduced in the fasted state (Figure 7, A and B). Hepatic CREB expression was normal in LGsKO mice.
Figure 7.
Gene expression studies. Gene expression determined by real-time quantitative PCR and normalized to β-actin expression is shown for each gene as percent of expression in LGsKO mice relative to paired control littermates. (A and B) Liver gene expression. (C and D) Kidney gene expression. (E and F) WAT gene expression. A, C, and E show results in randomly fed mice; B, D, and F show results after 24 hours of fasting. MCAD, medium-chain fatty acid dehydrogenase. n = 5–8 per group. *P < 0.05 or **P < 0.01 versus control.
After prolonged fasting, low levels of insulin and high levels of counterregulatory hormones normally lead to increased fatty acid oxidation and reduced fatty acid synthesis through PGC-1 and other pathways (23, 25, 26). Expression of fatty acid synthase (FAS), the rate-limiting enzyme for fatty acid synthesis, and carnitine palmitoyltransferase 1 (CPT-1), the rate-limiting enzyme for fatty acid oxidation, in liver were unaffected in fed LGsKO mice (Figure 7A). However, FAS expression was elevated, while CPT-1 expression was reduced in fasted LGsKO mice relative to controls, suggesting that in LGsKO mice the liver is resistant to the effects of fasting on lipid metabolism. This is consistent with the fact that LGsKO mice have increased triglyceride secretion rates and that serum triglyceride levels remain high in LGsKO mice after prolonged fast (Figure 5). Expression of acyl-coA oxidase (AOX), another enzyme required for fatty acid oxidation, was unaffected in LGsKO mice (Figure 7, A and B). Gene expression differences in fasted LGsKO mice are not likely to be due to differences in insulin action, as fasted LGsKO mice have normal serum insulin levels, and expression of the insulin-regulated gene encoding SREBP1 was unaffected (Figure 7, A and B). There were also no differences in expression of PPARγ or the forkhead transcription factor FOXO1.
Recent evidence indicates that gluconeogenesis in renal proximal tubules may also be an important source of glucose in the fasted state (27). As LGsKO mice have high glucagon levels (see below) and intact Gsα signaling in extrahepatic tissues (Figure 1), we examined whether gluconeogenic enzymes are overexpressed in the kidney of these mice (Figure 7, C and D). Renal expression of PGC-1, PEPCK, G6Pase, or CREB in LGsKO mice was normal in the fed state. After prolonged fasting, PGC-1 was somewhat overexpressed in LGsKO mice relative to controls, although this did not reach statistical significance. Most notably, renal G6Pase was overexpressed by 3-fold in fasted LGsKO mice relative to controls. Both transgenic mouse and cell culture studies have shown that G6Pase overexpression in liver is sufficient in itself to result in increased glucose release (28, 29). CREB was also overexpressed in kidneys of fasted LGsKO mice relative to controls. Expression of enzymes involved in fatty acid metabolism was unaffected in WAT of fed LGsKO mice (Figure 7E). After a 24-hour fast, AOX was overexpressed and FAS was underexpressed in WAT of LGsKO mice relative to controls, suggesting that fasted LGsKO mice have increased lipid oxidation and reduced lipogenesis in WAT relative to controls (Figure 7F).
LGsKO mice have elevated serum glucagon and GLP-1 levels and pancreatic islet hyperplasia.
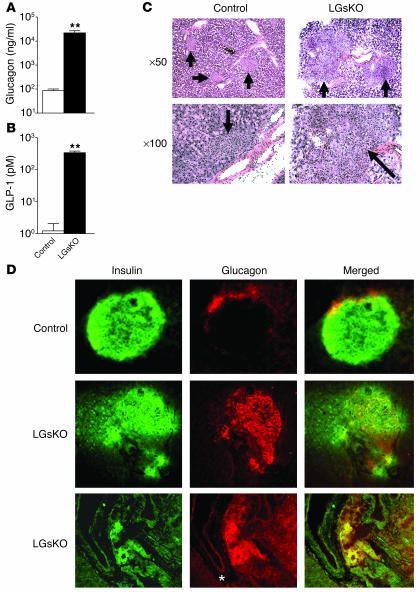
Glucagon is secreted from pancreatic α cells and stimulates hepatic glucose production primarily via the Gsα/cAMP pathway. LGsKO mice had more than 100-fold higher serum glucagon levels than controls (Figure 8A), suggesting a state of glucagon resistance. LGsKO mice also had more than 100-fold higher serum GLP-1 levels (Figure 8B). GLP-1, a peptide produced by alternative processing of proglucagon, is an incretin hormone normally produced in the intestine whose main function is to stimulate postprandial insulin release from pancreatic β cells (30). Results from models similar to the LGsKO model demonstrate that elevated GLP-1 levels are produced in pancreatic α cells as a result of alternative processing of proglucagon, which is expressed at much higher levels than normal (5, 6). Increased GLP-1 levels in LGsKO mice likely explain why these mice have increased glucose-stimulated insulin secretion (see above).
Figure 8.
Serum glucagon and GLP-1 levels and pancreatic islet histology. Serum glucagon (A) and GLP-1 (B) levels (in log scale) in fed LGsKO and control mice (n = 4–5 per group; **P < 0.01). (C) H&E-stained sections of pancreatic islets (arrows) from LGsKO mice (right) and controls (left) at ×50 and ×100 original magnification. For LGsKO at ×100, most of the field consists of a single islet. (D) Immunohistochemistry of pancreatic sections from control (top row) and LGsKO mice (bottom 2 rows) with insulin Ab (green, left column), glucagon Ab (red, middle column), and merged images (right column). A positively staining pancreatic duct is indicated with an asterisk.
LGsKO mice had increased pancreas weights (Figure 2C) and enlarged pancreatic islets with less uniform cellular size and appearance (Figure 8C). Immunohistochemistry of islets using insulin- and glucagon-specific primary antibodies showed the typical distribution pattern of cells within the islet in controls, with the majority of cells being insulin-secreting β cells and a small number of cells on the periphery being glucagon-secreting α cells (Figure 8D). In contrast, islets from LGsKO mice had many more glucagon-staining cells, with most located within the central portion of the islet. Merged images suggest that many of the islet cells may be coproducing both insulin and glucagon. There also appear to be glucagon-producing cells within the nearby exocrine ductal structures that were not present in controls (Figure 8D).
Discussion
Previous mouse models with germline Gnas mutations (11–14, 16) have limitations in trying to decipher the role of Gsα pathways in specific tissues, as only heterozygotes could be analyzed, and it is impossible to separate out the multiple effects resulting from partial Gsα deficiency in many metabolically active tissues. We therefore generated floxed Gsα mice, which allow us examine the effects of complete Gsα deficiency in specific tissues. Because the loxP sites were placed around Gsα exon 1, which is specific for Gsα, we are able to examine the effects of Gsα deficiency without affecting other Gnas gene products. Because liver is a critical organ for glucose and lipid metabolism and diabetes is associated with dysregulation of hepatic glucose and lipid metabolism, we have now generated mice with hepatic Gsα deficiency. Our results show that hepatic Gsα deficiency had no significant effect on survival, growth, liver function, or liver histology over the first 5 months of life.
During the fed state, insulin secretion is high, while counterregulatory hormone secretion is suppressed, which promotes glycolysis, glycogen synthesis, and lipogenesis and inhibits gluconeogenesis and lipid oxidation. During fasting the liver plays a major role in maintenance of serum glucose levels, initially through breakdown of stored glycogen and upon prolonged fasting primarily by gluconeogenesis. These responses are mediated by counterregulatory hormones such as glucagon, epinephrine, and corticosteroids. Glucagon and epinephrine mediate their actions primarily via the Gsα/cAMP pathway, which leads to phosphorylation of CREB by cAMP-dependent protein kinase (31). Phospho-CREB is an activated transcription factor that stimulates expression of PGC-1 (20, 32), which in concert with various other nuclear factors, such as hepatic nuclear factor 4α (HNF4α), glucocorticoid receptor, and FOXO1, stimulates the expression of the gluconeogenic enzymes PEPCK and G6Pase (21, 22, 32, 33).
In the fed state, LGsKO mice were hypoglycemic and hypoinsulinemic. As insulin action is normally dominant during the fed state, this suggests that LGsKO mice have increased insulin sensitivity, which was confirmed by insulin tolerance test and euglycemic-hyperinsulinemic clamp studies. Glucose tolerance was also markedly increased, as a result of both increased insulin sensitivity and increased glucose-stimulated insulin secretion. Hepatic PGC-1, PEPCK, and G6Pase gene expression levels were very low in LGsKO mice, presumably due to loss of Gsα/cAMP signaling. Hepatic PGC-1 deficiency improves insulin action in liver by lowering the expression of TRB3, an inhibitor of Akt kinase that mediates insulin actions on glucose metabolism (24). Studies from other transgenic mouse models in which liver PEPCK or G6Pase are either up- or downregulated suggest that changes in hepatic gluconeogenic enzymes can affect insulin sensitivity in liver as well as other tissues (28, 29, 34–36), and is consistent with the fact that LGsKO mice have altered insulin sensitivity in multiple tissues (liver, muscle, and probably WAT). Increased insulin sensitivity can lead to further reduction in gluconeogenic enzyme expression through increased Akt-mediated phosphorylation of FOXO1, which prevents this cofactor from interacting with PGC-1 to promote gluconeogenesis (22, 37). Although SREBP1, an insulin-inducible transcription factor, can also inhibit the expression of gluconeogenic enzymes by binding to HNF4α (38), SREBP1 mRNA levels were not altered in LGsKO mice. LGsKO mice have increased liver glycogen content in the fed state, a feature also found in glucagon receptor–knockout mice (5), which results from increased insulin-stimulated glycogen synthesis, as was confirmed during the clamp study.
Normal fasting glucose levels are maintained primarily by increased hepatic glucose production, which is stimulated by glucagon and other counterregulatory hormones. Despite disruption of the Gsα/cAMP pathway in liver, fasted LGsKO mice were able to maintain normal glucose and insulin levels. Mice with acute loss of hepatic CREB or PGC-1 expression have fasting hypoglycemia (20, 24), indicating that fasting glucose levels are sensitive to acute changes in hepatic glucose production. Some hepatic gluconeogenesis is probably maintained in fasted LGsKO mice, as hepatic PGC-1 and G6Pase mRNA levels were only somewhat reduced, and PEPCK was still expressed, although at lower levels. One possibility is that CREB is phosphorylated and activated by alternative Gsα-independent pathways. More importantly, LGsKO mice generate greater stores of liver glycogen during feeding, which are able to supply a source for hepatic glucose production via glycogenolysis over a more extended period of fasting (24 hours) than in control mice (<16 hours). The ability of LGsKO mice to normally mobilize glycogen suggests that in the absence of Gsα, counterregulatory hormones are still capable of stimulating glycogenolysis in vivo through alternative signaling pathways such as Gqα/phospholipase C/Ca2+ pathways, although we cannot rule out the possibility that a small residual amount of Gsα expression contributes to the stimulation of glycogenolysis. LGsKO mice also had increased insulin-stimulated glycogen synthesis in muscle, and therefore muscle most likely has a greater intrinsic glucose source during prolonged fast as well. Fasting serum corticosterone and urine catecholamine levels were unaltered in LGsKO mice, making it unlikely that maintenance of normal fasting glucose in these mice is due to increased levels of these counterregulatory hormones or sympathetic nervous system activity.
Fasting glucose levels in LGsKO mice may also be maintained by extrahepatic mechanisms, as liver-specific PEPCK–knockout mice can also maintain normal fasting glucose levels by reduced glucose utilization and increased extrahepatic glucose production (36). In contrast, glucagon receptor–knockout mice had fasting hypoglycemia, presumably due to failure of glucagon to stimulate glucose production in liver and extrahepatic tissues (4, 5). Renal gluconeogenesis, which occurs in proximal tubules, may significantly contribute to whole-body glucose production during fasting and under other conditions (27, 39). In LGsKO mice, glucagon action is only disrupted in liver, and therefore increased glucagon levels are fully capable of stimulating CREB phosphorylation and gluconeogenic enzyme expression in kidneys. While we were unable to directly measure renal glucose production, we showed that LGsKO mice had a 3-fold increase in renal G6Pase expression. This suggests that renal glucose production is likely to be increased in LGsKO mice, as hepatic G6Pase overexpression by itself leads to increased hepatic glucose production and diabetes (28, 29). If in fact extrahepatic gluconeogenesis is greater in LGsKO mice, this would be a chronic compensatory mechanism, as mice with acute disruption of hepatic CREB or PGC-1 expression are not protected from fasting hypoglycemia (20, 24).
LGsKO mice had elevated FFA levels in both the fed and fasted state, suggesting that these mice have increased rates of lipolysis and FFA release from adipose tissue. Both hypoinsulinemia in the fed state and high levels of glucagon, which may stimulate lipolysis in adipose tissue via Gsα/cAMP pathways, most likely contribute to enhanced FFA release. In contrast to LGsKO mice, glucagon receptor–knockout mice have normal FFA levels, perhaps due to lack of glucagon action on adipose tissue in these mice (5). LGsKO mice may also have reduced clearance of FFAs, as expression of CPT-1, the rate limiting enzyme for fatty acid oxidation, is reduced in the liver, and glucose appears to be a more preferential fuel source as compared with FFAs in LGsKO mice relative to controls. FAS expression is reduced and AOX expression is increased in adipose tissue of fasted LGsKO mice, which probably reflects the response of adipose tissue to very high glucagon levels and low levels of insulin. Whether this contributes to the reduced adiposity observed in LGsKO mice is unclear, although glucagon receptor–knockout mice, in which glucagon action is presumably lost in adipose tissue, also have reduced adiposity (5). While LGsKO mice have increased metabolic rate in the absence of adaptive thermogenesis, we were unable to distinguish a difference in either food intake or metabolic rate at ambient temperature. While it is possible that the conditions during the metabolic studies do not precisely mimic those in the facility where the mice are housed in terms of environmental temperature, our results do not clearly identify the mechanism leading to reduced adiposity in LGsKO mice or in glucagon receptor–knockout mice.
In the fed state, insulin stimulates SREBP1, which induces expression of lipogenic enzymes (25, 26). We found no differences in hepatic expression of SREBP1, FAS, or CPT-1, nor differences in serum or liver triglyceride levels, in fed LGsKO mice. This suggests that while hepatic Gsα deficiency improves insulin sensitivity with respect to glucose metabolism, it appears to have little effect with respect to lipid metabolism. In the fasted state, the actions of counterregulatory hormones to suppress lipogenic enzymes and induce lipid oxidation enzymes through the action of PGC-1 are dominant (23, 40, 41). In LGsKO mice these changes in response to fasting fail to occur, leading to relative overexpression of FAS and relative underexpression of CPT-1 in livers of fasted LGsKO mice. Consistent with this, LGsKO mice had higher triglyceride secretion rates and serum triglyceride levels failed to decrease in LGsKO mice after fasting. These differences cannot be accounted for by differences in insulin action, as both serum insulin levels and liver SREBP1 expression were unchanged in fasted LGsKO mice. In contrast to LGsKO mice, triglyceride levels tended to be low in glucagon receptor–knockout mice (5) or mice treated with glucagon receptor antisense oligonucleotide (3, 6). The reason for this difference is unclear, although it may be explained by the fact that the Gsα deficiency can also block the action of counterregulatory hormones other than glucagon.
LGsKO mice had remarkably high serum glucagon and GLP-1 levels and islet cell hyperplasia. Similar changes were also observed in glucagon receptor–knockout mice (4, 5) and mice treated with glucagon receptor antisense oligonucleotides (3, 6). Mice deficient in prohormone convertase 2 (PC2), an enzyme required for proglucagon processing, have low glucagon levels and α cell hyperplasia which were reversed with glucagon administration (42). While loss of direct glucagon feedback on islets is a potential explanation for α cell hyperplasia in the PC2 and glucagon receptor–deficient models, this is unlikely, as LGsKO mice, which have both high glucagon levels and intact glucagon receptors in islets, also develop α cell hyperplasia. More likely, α cell hyperplasia in these mouse models results from loss of glucagon action in the liver and that the feedback mechanism is either a response to hypoglycemia or an unknown factor secreted from the liver. Although the presence of cells that coexpress insulin and glucagon could be due to persistence of immature coexpressing cells that are normally present only during gestation, this is unlikely, as pancreatic morphology was normal at birth in glucagon receptor–knockout mice (5). Alternatively, the coexpressing cells could result from neogenesis, as we noted an increased number of glucagon-secreting cells budding from pancreatic ducts. Based upon findings in 2 glucagon receptor–deficient mouse models (5, 6), increased GLP-1 in LGsKO mice likely results from alternative processing of proglucagon in pancreatic α cells. In LGsKO mice, increased glucose-stimulated insulin secretion is probably secondary to high GLP-1 levels, as GLP-1 is known to promote insulin secretory responses and β cell survival (18). However, the role of GLP-1 in α cell biology is less clear.
Recently impairment of glucagon action by glucagon receptor antisense oligonucleotide was shown to reverse diabetes without leading to hypoglycemia (6). Our results show that manipulations that inhibit counterregulatory hormone actions in liver produce similar favorable effects on glucose metabolism without leading to fasting hypoglycemia. Further studies of this genetic knockout in diabetic mouse models will provide evidence as to whether similar manipulations will prove to be a possible therapeutic target for diabetes.
Methods
Generation of LGsKO mice.
Mice with a floxed neomycin resistance (Neo) cassette upstream and a loxP site downstream of Gsα exon 1 (E1neo-fl allele; Figure 1A) were generated as previously described (16). These mice were bred with EIIa-cre–transgenic mice (43) and offspring with deletion of Neo were selected, resulting in mice with loxP sites surrounding Gsα exon 1 (E1fl allele; Figure 1A). E1fl/+ and E1fl/fl mice were repeatedly mated with Alb-cre mice (17) to generate LGsKO mice (genotype Alb-cre+E1fl/fl). The E1fl allele had no effect on Gsα expression or phenotype (Figure 1C), and therefore all Alb-cre– or E1+/+ littermates were used as controls. Gsα genotyping to distinguish wild-type (E1+) and E1fl alleles was performed by PCR using primers surrounding the downstream loxP site (forward 5′-TTCGGTCTCGTCCCCTTAGTTG-3′, reverse 5′-AACAAATCGCACACCCCAGTGAGG-3′). Presence or absence of the Alb-cre transgene was determined by duplex PCR using cre-specific primers (forward 5′-CCTGTTTTGCACGTTCACCG-3′, reverse 5′-CCTGTTTTGCACGTTCACCG-3′) and α-tubulin as internal control for amplification (forward 5′-GTGGGTTCCAGGTCTACGAA-3′, reverse 5′-AGACCATTGGGGGAGGAGAT-3′). Animals were maintained on a 12-hour light/12-hour dark cycle (6 am/6 pm) and standard pellet diet (NIH-07, 5% fat by weight). All experiments were performed on male mice age 12–14 weeks unless otherwise indicated. Animal experiments were approved by the NIDDK Animal Care and Use Committee.
Glucose and insulin tolerance tests and glucagon stimulation test.
For glucose and insulin tolerance tests, overnight-fasted mice were given i.p. glucose (2 mg/g body weight) or insulin (Humulin, 0.75 mIU/g), respectively, and tail blood was collected before (time 0) and at indicated times after injection for measurement of glucose (Glucometer Elite; Bayer) and insulin (RIA; Linco Research Inc.). To examine glucose-stimulated insulin secretion, glucose (3 mg/g) was administered, and glucose and insulin were measured at indicated time points. For the glucagon stimulation test, mice received 16 μg/kg human glucagon i.p. (Sigma-Aldrich), and blood glucose was measured at the indicated times.
Hyperinsulinemic-euglycemic clamp studies.
Hyperinsulinemic-euglycemic clamp studies and in vivo glucose flux analysis were performed as previously described (14), except that no initial insulin bolus was administered and the insulin infusion rate was adjusted (with controls receiving half the infusion rate as LGsKO mice) to achieve similar serum insulin levels in LGsKO mice and controls.
Biochemical assays.
Plasma insulin and serum glucagon were measured by RIA, and serum GLP-1 was measured by ELISA (Linco Research Inc.). Serum corticosterone was measured by RIA (ICN Biomedicals Inc.). Serum FFAs were measured using a kit (Roche Diagnostics Corp.). Serum chemistries and liver enzymes were measured by an autoanalyzer (NIH Clinical Chemistry Department). Liver triglyceride and glycogen content were measured by solvent extractions followed by radiometric assays as previously described (14). Urine was collected by bladder puncture in overnight-fasted mice, and catecholamines were measured by HPLC (44) and corrected by creatinine concentration (measured by Ani Lytics Inc.).
Body composition, food intake, metabolic rate, and activity measurements.
Body composition was measured using the NMR analyzer Bruker Minispec mq10 (Bruker Optics Inc.). Food intake was measured over 14 days in individually caged mice. O2 consumption, CO2 release rates, and activity levels were determined as previously described (13).
In vivo triglyceride secretion.
Triglyceride secretion was measured as the increase in circulating triglyceride levels after inhibiting triglyceride clearance with WR1339 (Sigma-Aldrich) as previously described (45).
RNA analysis.
Total RNA was isolated with TRIzol (Invitrogen Corp.) and DNAse I–treated (Invitrogen Corp.) at room temperature for 15 minutes. Reverse transcription was performed using MultiScribe RT (Applied Biosystems). Gene expression levels were measured by real-time quantitative RT-PCR (MxP3000; Stratagene). PCR reactions (20 μl total volume) included cDNA (20–40 ng of initial RNA sample), 50–100 nM primers, and 10 μl of 2× SYBR Green Master Mix (Roche Diagnostics Corp.). Standard curves were simultaneously generated with serial dilutions of cDNA ranging from 1 ng to 100 ng, and results were normalized to β-actin mRNA levels in each sample, which were determined simultaneously by the same method. Specificity of each RT-PCR product was checked by its dissociation curve and the presence of a single band of expected size on acrylamide gel electrophoresis. Primer sequences are provided in Supplemental Table 1 (available online with this article; doi:10.1172/JCI24196DS1).
Immunohistochemistry.
Dissected mouse pancreata were rapidly frozen on dry ice. Cryosections (12 mm thick) were prepared with a Leica cryostat set at –20°C, mounted on silanated glass slides (KD Medical Inc.), and air dried. Sections were fixed for 10 minutes at room temperature with 4% formaldehyde in PBS, pH 7.4, followed by 3 washes with PBS. Sections were permeabilized in a solution containing 0.05% Triton X-100 and 10% normal horse serum in PBS for 10 minutes at room temperature and washed with PBS. Sections were then subjected to double immunostaining by simultaneous incubation with guinea pig anti-insulin and rabbit anti-glucagon antibodies (DakoCytomation) at 4°C overnight. Sections were washed and then incubated for 1 hour at room temperature with a fluorescein-conjugated anti-guinea pig IgG and Texas red anti-rabbit IgG (Jackson ImmunoResearch Laboratories Inc.). After 3 washes with PBS, sections were sealed with VECTASHIELD containing DAPI (Vector Laboratories), and immunohistochemical signals were acquired with a Nikon fluorescence microscope. Independent sections were also stained with H&E.
Immunoblot analysis.
To examine Akt phosphorylation, tissues were removed from overnight-fasted mice at 2.5 minutes after insulin administration into the portal vein (100 μl of 15 μg/ml; Sigma-Aldrich), and tissue homogenates were analyzed for Akt1 phosphorylation and protein levels as previously described (14). Gsα protein expression was measured in tissue protein extracts using a carboxyterminal Gsα-specific antibody. To examine CREB phosphorylation, mice were anesthetized with avertin, and isopreterenol (0.5 μg/g in 10 mM ascorbic acid; Sigma-Aldrich) was injected into the vena cava. Tissues were collected at 5 minutes after injection, and protein extracts were prepared using nuclear and cytoplasmic extraction reagents (NE-PER; Pierce Biotechnology Inc.). Extracts were separated on 10% Tris-glycine gels, which were sequentially probed with CREB and phospho-CREB (Ser133) antibodies (Cell Signaling Technology).
Statistics.
Data are expressed as the mean ± SEM. Statistical significance between groups was determined using 2-tailed Student’s t test or multifactor ANOVA, with differences considered significant at P < 0.05.
Supplementary Material
Acknowledgments
We thank R. Vinitsky for technical support, D. LeRoith and S. Yakar for providing Alb-cre mice, and E. Lai, G. Eisenhofer, and K. Pacak for assistance in measurements of urine catecholamines. This work was supported by the Intramural Research Program, NIDDK, NIH, US Department of Health and Human Services.
Footnotes
Wei-Qin Zhao’s present address is: Northwestern University, Evanston, Illinois, USA.
Javier Lorenzo’s present is address is: Stanford University School of Medicine, Palo Alto, California, USA.
Laura Shen’s present address is: Princeton University, Princeton, New Jersey, USA.
Nonstandard abbreviations used: AOX, acyl-CoA oxidase; BAT, brown adipose tissue; CPT-1, carnitine palmitoyltransferase 1; CREB, cAMP response element–binding protein; G6Pase, glucose-6-phosphatase; Gsα, stimulatory G protein α subunit; FAS, fatty acid synthase; GLP-1, glucagon-like peptide–1; LGsKO mouse, liver-specific Gsα–knockout mouse; PEPCK, phosphoenolpyruvate carboxykinase; PGC-1, PPARγ coactivator–1; RER, respiratory exchange ratio; WAT, white adipose tissue.
Conflict of interest: The authors have declared that no conflict of interest exists.
References
- 1.DeFronzo RA. Pathogenesis of type 2 diabetes: metabolic and molecular implications for identifying diabetes genes. Diabetes Rev. 1997;5:177–269. [Google Scholar]
- 2.Reaven GM, Chen YD, Golay A, Swislocki AL, Jaspan JB. Documentation of hyperglucagonemia throughout the day in nonobese and obese patients with noninsulin-dependent diabetes mellitus. J. Clin. Endocrinol. Metab. 1987;64:106–110. doi: 10.1210/jcem-64-1-106. [DOI] [PubMed] [Google Scholar]
- 3.Liang Y, et al. Reduction in glucagon receptor expression by an antisense oligonucleotide ameliorates diabetic syndrome in db/db mice. Diabetes. 2004;53:410–417. doi: 10.2337/diabetes.53.2.410. [DOI] [PubMed] [Google Scholar]
- 4.Parker JC, Andrews KM, Allen MR, Stock JL, McNeish JD. Glycemic control in mice with targeted disruption of the glucagon receptor gene. Biochem. Biophys. Res. Comm. 2002;290:839–843. doi: 10.1006/bbrc.2001.6265. [DOI] [PubMed] [Google Scholar]
- 5.Gelling RW, et al. Lower blood glucose, hyperglucagonemia, and pancreatic alpha cell hyperplasia in glucagon receptor knockout mice. Proc. Natl. Acad. Sci. U. S. A. 2003;100:1438–1443. doi: 10.1073/pnas.0237106100. [DOI] [PMC free article] [PubMed] [Google Scholar]
- 6.Sloop KW, et al. Hepatic and glucagon-like peptide-1-mediated reversal of diabetes by glucagon receptor antisense oligonucleotide inhibitors. J. Clin. Invest. 2004;113:1571–1581. doi:10.1172/JCI200420911. doi: 10.1172/JCI20911. [DOI] [PMC free article] [PubMed] [Google Scholar]
- 7.Jelinek LJ, et al. Expression cloning and signaling properties of the rat glucagon receptor. Science. 1993;259:1614–1616. doi: 10.1126/science.8384375. [DOI] [PubMed] [Google Scholar]
- 8.Weinstein LS, Yu S, Warner DR, Liu J. Endocrine manifestations of stimulatory G protein α-subunit mutations and the role of genomic imprinting. Endocr. Rev. 2001;22:675–705. doi: 10.1210/edrv.22.5.0439. [DOI] [PubMed] [Google Scholar]
- 9.Montminy M. Transcriptional regulation by cyclic AMP. Annu. Rev. Biochem. 1997;66:807–822. doi: 10.1146/annurev.biochem.66.1.807. [DOI] [PubMed] [Google Scholar]
- 10.Wakelam MJO, Murphy GJ, Hruby VJ, Houslay MD. Activation of two signal transduction systems in hepatocytes by glucagon. Nature. 1986;328:68–71. doi: 10.1038/323068a0. [DOI] [PubMed] [Google Scholar]
- 11.Yu S, et al. Variable and tissue-specific hormone resistance in heterotrimeric Gs protein α-subunit (Gsα) knockout mice is due to tissue-specific imprinting of the Gsα gene. Proc. Natl. Acad. Sci. U. S. A. 1998;95:8715–8720. doi: 10.1073/pnas.95.15.8715. [DOI] [PMC free article] [PubMed] [Google Scholar]
- 12.Yu S, et al. Increased insulin sensitivity in Gsα knockout mice. J. Biol. Chem. 2001;276:19994–19998. doi: 10.1074/jbc.M010313200. [DOI] [PubMed] [Google Scholar]
- 13.Yu S, et al. Paternal versus maternal transmission of a stimulatory G protein α subunit knockout produces opposite effects on energy metabolism. J. Clin. Invest. 2000;105:615–623. doi: 10.1172/JCI8437. [DOI] [PMC free article] [PubMed] [Google Scholar]
- 14.Chen M, et al. Increased insulin sensitivity in paternal Gnas knockout mice is associated with increased lipid clearance. Endocrinology. 2004;145:4094–4102. doi: 10.1210/en.2004-0038. [DOI] [PubMed] [Google Scholar]
- 15.Weinstein LS, Liu J, Sakamoto A, Xie T, Chen M. Minireview: GNAS: normal and abnormal functions. Endocrinology. 2004;145:5459–5464. doi: 10.1210/en.2004-0865. [DOI] [PubMed] [Google Scholar]
- 16.Chen M, et al. Alternative Gnas gene products have opposite effects on glucose and lipid metabolism. Proc. Natl. Acad. Sci. U. S. A. 2005;102:7386–7391. doi: 10.1073/pnas.0408268102. [DOI] [PMC free article] [PubMed] [Google Scholar]
- 17.Yakar S, et al. Normal growth and development in the absence of hepatic insulin-like growth factor I. Proc. Natl. Acad. Sci. U. S. A. 1999;96:7324–7329. doi: 10.1073/pnas.96.13.7324. [DOI] [PMC free article] [PubMed] [Google Scholar]
- 18.Jhala US, et al. cAMP promotes pancreatic β-cell survival via CREB-mediated induction of IRS2. Genes Dev. 2003;17:1575–1580. doi: 10.1101/gad.1097103. [DOI] [PMC free article] [PubMed] [Google Scholar]
- 19.Puigserver P, Spiegelman BM. Peroxisome proliferator-activated receptor-γ coactivator 1α (PGC-1α): transcriptional coactivator and metabolic regulator. Endocr. Rev. 2003;24:78–90. doi: 10.1210/er.2002-0012. [DOI] [PubMed] [Google Scholar]
- 20.Herzig S, et al. CREB regulates hepatic gluconeogenesis through the coactivator PGC-1. Nature. 2001;413:179–183. doi: 10.1038/35093131. [DOI] [PubMed] [Google Scholar]
- 21.Rhee J, et al. Regulation of hepatic fasting response by PPARγ coactivator-1α (PGC-1): requirement for hepatocyte nuclear factor 4α in gluconeogenesis. Proc. Natl. Acad. Sci. U. S. A. 2003;100:4012–4017. doi: 10.1073/pnas.0730870100. [DOI] [PMC free article] [PubMed] [Google Scholar]
- 22.Puigserver P, et al. Insulin-regulated hepatic gluconeogenesis through FOXO1-PGC-1α interaction. Nature. 2003;423:550–555. doi: 10.1038/nature01667. [DOI] [PubMed] [Google Scholar]
- 23.Herzig S, et al. CREB controls hepatic lipid metabolism through nuclear hormone receptor PPAR-γ. Nature. 2003;426:190–193. doi: 10.1038/nature02110. [DOI] [PubMed] [Google Scholar]
- 24.Koo SH, et al. PGC-1 promotes insulin resistance in liver through PPAR-α-dependent induction of TRB-3. Nat. Med. 2004;10:530–534. doi: 10.1038/nm1044. [DOI] [PubMed] [Google Scholar]
- 25.Foretz M, Guichard C, Ferre P, Foufelle F. Sterol regulatory element binding protein-1c is a major mediator of insulin action on the hepatic expression of glucokinase and lipogenesis-related genes. Proc. Natl. Acad. Sci. U. S. A. 1999;96:12737–12742. doi: 10.1073/pnas.96.22.12737. [DOI] [PMC free article] [PubMed] [Google Scholar]
- 26.Kim JB, et al. Nutritional and insulin regulation of fatty acid synthetase and leptin gene expression through ADD1/SREBP1. J. Clin. Invest. 1998;101:1–9. doi: 10.1172/JCI1411. [DOI] [PMC free article] [PubMed] [Google Scholar]
- 27.Gerich JE, Meyer C, Woerle HJ, Stumvoll M. Renal gluconeogenesis: its importance in human glucose homeostasis. Diabetes Care. 2001;24:382–391. doi: 10.2337/diacare.24.2.382. [DOI] [PubMed] [Google Scholar]
- 28.Seoane J, et al. Metabolic impact of adenovirus-mediated overexpression of the glucose-6-phosphatase catalytic subunit in hepatocytes. J. Biol. Chem. 1997;272:26972–26977. doi: 10.1074/jbc.272.43.26972. [DOI] [PubMed] [Google Scholar]
- 29.Trinh KY, O’Doherty RM, Anderson P, Lange AJ, Newgard CB. Perturbation of fuel homeostasis caused by overexpression of the glucose-6-phosphatase catalytic subunit in liver of normal rats. J. Biol. Chem. 1998;273:1615–1620. doi: 10.1074/jbc.273.47.31615. [DOI] [PubMed] [Google Scholar]
- 30.Preitner F, et al. Gluco-incretins control insulin secretion at multiple levels as revealed in mice lacking GLP-1 and GIP receptors. J. Clin. Invest. 2004;113:635–645. doi:10.1172/JCI200420518. doi: 10.1172/JCI20518. [DOI] [PMC free article] [PubMed] [Google Scholar]
- 31.Gonzalez GA, Montminy MR. Cyclic AMP stimulates somatostatin gene transcription by phosphorylation of CREB at serine 133. Cell. 1989;59:675–680. doi: 10.1016/0092-8674(89)90013-5. [DOI] [PubMed] [Google Scholar]
- 32.Yoon JC, et al. Control of hepatic gluconeogenesis through the transcriptional coactivator PGC-1. Nature. 2001;413:131–138. doi: 10.1038/35093050. [DOI] [PubMed] [Google Scholar]
- 33.Nakae J, et al. Regulation of insulin action and pancreatic β-cell function by mutated alleles of the gene encoding forkhead transcription factor Foxo1. Nat. Genet. 2002;32:245–253. doi: 10.1038/ng890. [DOI] [PubMed] [Google Scholar]
- 34.Sun Y, et al. Phosphoenolpyruvate carboxykinase overexpression selectively attenuates insulin signaling and hepatic insulin sensitivity in transgenic mice. J. Biol. Chem. 2002;277:23301–23307. doi: 10.1074/jbc.M200964200. [DOI] [PubMed] [Google Scholar]
- 35.Valera A, Pujol A, Pelegrin M, Bosch F. Transgenic mice overexpressing phosphoenolpyruvate carboxykinase develop non-insulin-dependent diabetes mellitus. Proc. Natl. Acad. Sci. U. S. A. 1994;91:9151–9154. doi: 10.1073/pnas.91.19.9151. [DOI] [PMC free article] [PubMed] [Google Scholar]
- 36.She P, et al. Mechanisms by which liver-specific PEPCK knockout mice preserve euglycemia during starvation. Diabetes. 2003;52:1649–1654. doi: 10.2337/diabetes.52.7.1649. [DOI] [PubMed] [Google Scholar]
- 37.Brunet A, et al. Akt promotes cell survival by phosphorylating and inhibiting a Forkhead transcription factor. Cell. 1999;96:857–868. doi: 10.1016/s0092-8674(00)80595-4. [DOI] [PubMed] [Google Scholar]
- 38.Yamamoto T, et al. SREBP-1 interacts with hepatic nuclear factor-4α and interferes with PGC-1 recruitment to suppress hepatic gluconeogenic genes. J. Biol. Chem. 2004;279:12027–12035. doi: 10.1074/jbc.M310333200. [DOI] [PubMed] [Google Scholar]
- 39.Stumvoll M, et al. Human kidney and liver gluconeogenesis: evidence for organ substrate selectivity. Am. J. Physiol. 1998;274:E817–E826. doi: 10.1152/ajpendo.1998.274.5.E817. [DOI] [PubMed] [Google Scholar]
- 40.Louet JF, Hayhurst G, Gonzalez FJ, Girard J, Decaux JF. The coactivator PGC-1 is involved in the regulation of the liver carnitine palmitoyltransferase I gene expression by cAMP in combination with HNF4α and cAMP-response element-binding protein (CREB) J. Biol. Chem. 2002;277:37991–38000. doi: 10.1074/jbc.M205087200. [DOI] [PubMed] [Google Scholar]
- 41.Sul HS, Wang D. Nutritional and hormonal regulation of enzymes in fat synthesis: studies of fatty acid synthase and mitochondrial glycerol-3-phosphate acyltransferase gene transcription. Annu. Rev. Nutr. 1998;18:331–351. doi: 10.1146/annurev.nutr.18.1.331. [DOI] [PubMed] [Google Scholar]
- 42.Webb GC, Akbar MS, Zhao C, Swift HH, Steiner DF. Glucagon replacement via micro-osmotic pump corrects hypoglycemia and α-cell hyperplasia in prohormone convertase 2 knockout mice. Diabetes. 2002;51:398–405. doi: 10.2337/diabetes.51.2.398. [DOI] [PubMed] [Google Scholar]
- 43.Xu X, et al. Direct removal in the mouse of a floxed neo gene from a three-lox P conditional knockout allele by two novel approaches. Genesis. 2001;30:1–6. doi: 10.1002/gene.1025. [DOI] [PubMed] [Google Scholar]
- 44.Eisenhofer G, et al. Simultaneous liquid-chromatographic determination of 3,4-dihydroxyphenylglycol, catecholamines, and 3,4-dihydroxyphenylalanine in plasma, and their responses to inhibition of monoamine oxidase. Clin. Chem. 1986;32:2030–2033. [PubMed] [Google Scholar]
- 45.Gavrilova O, et al. Liver peroxisome proliferator-activated receptor γ contributes to hepatic steatosis, triglyceride clearance, and regulation of body fat mass. J. Biol. Chem. 2003;278:34268–34276. doi: 10.1074/jbc.M300043200. [DOI] [PubMed] [Google Scholar]
Associated Data
This section collects any data citations, data availability statements, or supplementary materials included in this article.


