Abstract
We use time-resolved coherent Raman spectroscopy to obtain molecule-specific signals from dipicolinic acid (DPA), which is a marker molecule for bacterial spores. We use femtosecond laser pulses in both visible and UV spectral regions and compare experimental results with theoretical predictions. By exciting vibrational coherence on more than one mode simultaneously, we observe a quantum beat signal that can be used to extract the parameters of molecular motion in DPA. The signal is enhanced when an UV probe pulse is used, because its frequency is near-resonant to the first excited electronic state of the molecule. The capability for unambiguous identification of DPA molecules will lead to a technique for real-time detection of spores.
Keywords: molecular spectroscopy, coherent anti-Stokes Raman scattering, bacterial spores, molecular coherence, nonlinear optics
The historical use of bacterial spores for biological warfare and the recent terrorism attacks are a concern for national security, pointing to the need for rapid analysis and detection of unknown chemical and biological agents. A major component of bacterial spores is dipicolinic acid (DPA) and its various salts such as calcium dipicolinate (CaDPA), which can contribute up to 17% of the dry weight of the spores. This fact motivates our study of DPA because it is a ready-made marker for endospores (1).
Although many laser spectroscopic techniques have been successfully applied in chemistry and biology, not all of them are practical for detection purposes. Methods based on fluorescence spectroscopy are not effective because the fluorescence signal does not usually offer adequate selectivity. Although a spontaneous Raman signal can be very selective, and has been successfully used for detection of DPA, it is often very weak and requires long acquisition times.
Methods that use coherent Raman spectroscopy are more efficient because quantum coherence can dramatically increase the nonlinear response of the media (2–6). Applications of quantum coherence now constitute a broad range of research such as quantum computing and quantum-state storage (7–9), manipulation of single quanta (10–12), efficient frequency conversion (13, 14), and subfemtosecond pulse generation (15, 16).
Recently, it was suggested that femtosecond coherent anti-Stokes Raman scattering (CARS) can be used for the detection of biomolecules in real time (1) and can improve LIDAR (light detection and ranging) efficiency by several orders of magnitude (17). In the femtosecond adaptive spectroscopic technique for CARS (FAST CARS), the quantum coherence between the vibrational states is maximized before probing the molecules. Several relevant experimental demonstrations have justified this technique (18–23).
In this work, we present the experimentally observed coherent Raman signal from DPA in sodium-hydroxide-buffered water solution (H2O/NaOH) in the visible and UV spectral regions. We also study how the signal depends on concentration of NaDPA (sodium DPA). We demonstrate that the sensitivity is enhanced in our UV probe experiment. Additionally, we develop a theoretical model that supports our findings and allows us to predict optimal experimental parameters.
Experimental Setup
In our experiments, we use two separate spectral regions and configurations. The first is optimized for nonresonant CARS in the visible region, whereas the other utilizes a near-resonant UV probe pulse.
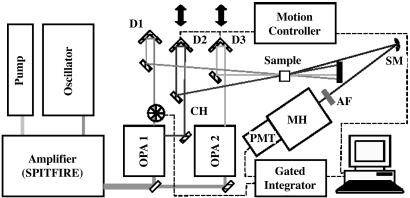
The schematic for our UV investigation is shown in Fig. 1. This setup is similar to the one we used recently to study vibrational dynamics in methanol–water solutions (26). The laser amplifier (Spectra-Physics SPITFIRE) produces a sequence of linearly polarized 50-fs pulses with a 1-kHz repetition rate and an average power of 0.8 W (0.8 mJ per pulse) at the central wavelength of 800 nm. The beam is split into two equal parts that feed optical parametric amplifiers (OPAs) (Spectra-Physics OPA-800C; see OPA 1 and OPA 2 in Fig. 1). The OPAs produce linearly polarized pulses with central wavelengths of 640 (red) and 585 (yellow) nm and average powers of 20 and 5 mW, respectively. The actual power reaching the sample is measured to be 4.78 mW (red) and 1.24 mW (yellow). The first OPA also utilizes a part of the red beam for frequency-doubling and generation of UV pulses (at 320 nm).
Fig. 1.
Schematic of the experimental setup. The amplifier outputs 50-fs pulses at 800 nm with a 1-kHz repetition rate and an average power of 0.8 W. OPA 1 generates 640- and 320-nm pulses with average powers of 20 and 1 mW, respectively. OPA 2 generates 585-nm pulses with an average power of 5 mW. Other components include a chopper (CH), delay stages (D1, D2, and D3), a spherical mirror (SM), a set of attenuation filters (AF), a monochromator (MH), and a PMT.
The OPAs are followed by delay lines for each of the beams. Two of the delay stages are motorized and operated with 1-μm precision through a motion controller (Newport, Irvine, CA) connected to a PC. After the delay lines, the pulses are focused into a 0.1-mm spot size on the sample. In this experiment, we use quartz cuvettes with 10- or 2-mm path length (and 1-mm-thick walls) filled with a DPA solution in H2O/NaOH. We first prepare a concentrated solution of NaOH (pH 13) and then saturate the solution with DPA. We estimate the DPA concentration to be 50 mM and the solution to have a pH of 7.
We use the folded BoxCARS geometry (see e.g., ref. 24) with properly chosen angles between the beams defined by the four-wave-mixing (FWM) phase-matching condition. In this experiment, the yellow and red pulses are the pump and Stokes fields, respectively. They efficiently excite the Raman coherence at the transition frequencies near 1,400 cm–1 in NaDPA. This coherence is subsequently probed by the UV pulse. We observe both CARS signal (near 306 nm) and coherent Stokes Raman scattering (CSRS) signal (near 336 nm).
The CARS/CSRS signal is spatially filtered, attenuated, and focused on the entrance slit of a diffraction monochromator (MicroHR, Jobin Yvon, Longjumeau, France) with a thermoelectrically cooled photomultiplier tube (PMT) attached to the exit slit. The PMT output signal is integrated by a boxcar averager (Stanford Research, Sunnyvale, CA). We implement active baseline subtraction by chopping the red beam at half the repetition rate and inverting the sign of every other integrated pulse before averaging. This method helps to eliminate unwanted background from the UV beam and improves the signal-to-noise ratio by at least an order of magnitude. The integrated signal is digitized and recorded by the PC. A large dynamic range, which is required in our measurement, is achieved by variable attenuation of the signal beam. As we vary the probe pulse delay, we adjust the signal attenuation to avoid PMT saturation. The time-dependent CARS signal, spanning 7 orders of magnitude, allows the extraction of characteristic parameters of molecular motion in NaDPA.
The second setup, used for the nonresonant all-visible experiments, is similar to the first one described above. The essential difference is that the pulses produced by the OPAs are somewhat longer (85 instead of 50 fs). The wavelength for the pump beam is set to 547 nm, and the Stokes beam wavelength is 596 nm. The repetition rate is the same as in the previous experiment. The pump, Stokes, and probe beams each have an average power of 0.25 mW. In this experiment, we use a degenerate scheme where the probe pulse has the same wavelength as the pump (547 nm). The CARS signal is spatially separated from the other beams by using the folded BoxCARS geometry. The spatially filtered CARS signal then is focused onto the entrance slit of an imaging spectrometer equipped with a cooled charge-coupled device (CCD) camera that has six decades of dynamic range. The CCD camera images the whole spectral region of interest. In these all-visible experiments, we use a more concentrated DPA solution in H2O/NaOH (250 mM, pH 12).
Results and Discussion
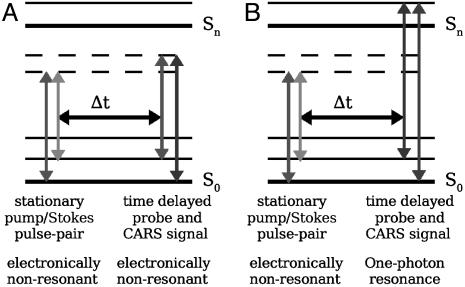
Two strategies of fs-CARS have been pursued to obtain the Raman signature of DPA. In the first color scheme (Fig. 2A), we use a pump/Stokes pulse-pair to excite molecular coherence in the electronic ground state and then probe with a nonresonant pulse at the same wavelength as the pump. In the second color scheme (Fig. 2B), we use an UV probe that is close to resonance to the first excited electronic state (λ ≈ 267 nm). The probe wavelength, 320 nm, was chosen because it allowed us to obtain near-resonance signal enhancement without excessive absorption.
Fig. 2.
Configurations of molecular levels and laser fields. (A) Color scheme for a time-resolved CARS process using a nonresonant probe. (B) Color scheme for a time-resolved CARS process with a one-photon, electronic resonance in the UV. In both cases the Raman resonance is driven by a two-photon process.
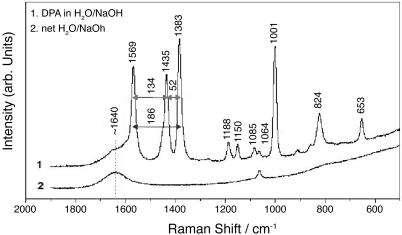
The Raman spectra of DPA in aqueous solution (H2O/NaOH) and the net solvent are shown in Fig. 3 as curves 1 and 2, respectively. These spectra were acquired with a backscattering geometry by using the 514.5-nm line of an Ar+ laser with 40 mW on the sample. One can see three strong Raman lines near 1,383, 1,435, and 1,569 cm–1 with frequency differences of 52, 134, and 186 cm–1. All three modes can be excited at the same time because the spectral width of a 50-fs pulse is at least 300 cm–1.
Fig. 3.
Raman spectrum of 250 mM DPA in H2O/NaOH at pH 12 (curve 1) and the net solvent, H2O/NaOH at pH 2 (curve 2). The energy spacing between the Raman bands at 1,569, 1,435, and 1,383 cm–1 is marked and will be referred to in the time-resolved CARS measurements.
Detection of DPA Through fs-CARS in the Visible. To verify the detection of DPA in aqueous solution, the coherent Raman modes are monitored by recording the CARS signal intensity as a function of the time delay (Δt) between the pump/Stokes pulse-pair, that interact simultaneously with the sample, and the time-delayed probe pulse (see Fig. 2). Specifically, the technique of quantum beating is used (25). Quantum beating refers to the interference in the nonlinear polarization of different Raman modes. This technique also is known as polarization beating. When the probe pulse is scattered off the vibrating molecule, the beat frequency is transferred to the scattered light. The technique of quantum beating is used because the Raman resonant signal from NaDPA is expected to be weak relative to the FWM peak observed at zero delay (Δt = 0). This poor ratio between the Raman-resonant and the FWM signals due to instantaneous electronic response makes it difficult to differentiate between the dephasing of a single Raman mode and the trailing end of the FWM peak. The observation of interfering coherent Raman modes offers the unambiguous identification of a molecular species detected. The frequency of the beating pattern corresponds to the energy difference between two or more of the Raman bands characteristic of the system.
To verify the detection of NaDPA with the polarization beating of the coherent Raman modes at 1,569, 1,435, and 1,383 cm–1 in the transient signal of an electronically nonresonant CARS process, the pump laser is set at a central wavelength of λpump = 547 nm, and the Stokes laser is tuned to a central wavelength of 596 nm. Both the pump and Stokes pulses possess a full width at half maximum (FWHM) bandwidth of ≈5.0 nm (170 cm–1), assuming transform-limited pulses with a FWHM duration of ≈85 fs. The frequency difference between the pump and Stokes pulses, which corresponds to 1,500 cm–1 and has a convoluted bandwidth of ≈240 cm–1, allows coherent excitation of the modes at 1,569, 1,435, and 1,383 cm–1.
The high Raman cross-section of the bands at 1,435 and 1,383 cm–1 should provide a large amplitude and contrast of the polarization beating in the transient CARS signal. The spacing between them is easily covered by the bandwidth of the femtosecond laser pulses. As a consequence, both vibrational modes are driven with a high pulse area leading to a high CARS signal intensity.
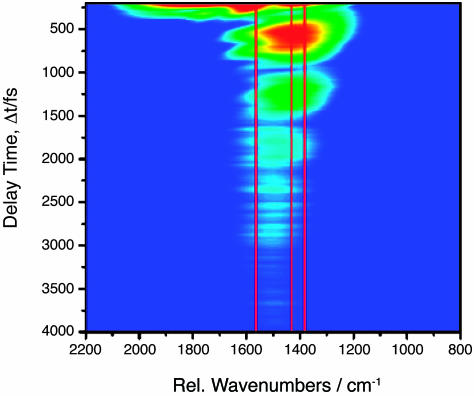
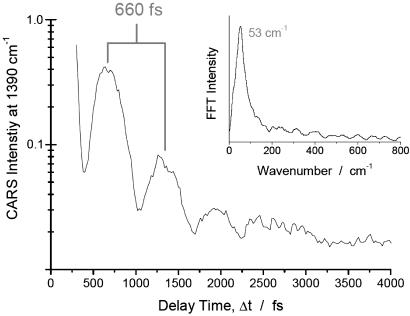
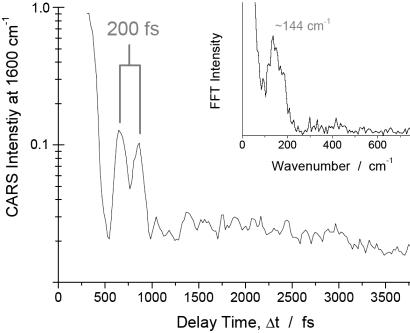
Fig. 4 shows a logarithmic contour plot of the CARS signal intensity as a function of the delay of the probe laser pulse and the Raman shift. The positions of the Raman bands of NaDPA at 1,569, 1,435, and 1,383 cm–1, which are coherently driven by the pump/Stokes pulse pair, are marked with red lines in the transient CARS spectrum (for comparison see the Raman spectrum in Fig. 3). The interference between the coherent signals of the 1,435 and 1,383 cm–1 bands can clearly be seen as a modulation of the CARS signal in the spectral region of these two modes with a period of ≈660 fs. The interference between the signals from these two Raman resonances is further illustrated with a cut along the time axis in the spectral region between these two bands at 1,390 cm–1. A modulation period of 660 fs is evident, and the fast Fourier transform (FFT) of the transient signal, displayed in Fig. 5 Inset, shows a band at 53 cm–1, which corresponds to the difference in the Raman shift of the 1,435 and 1,383 cm–1 resonances (see stationary Raman spectrum of NaDPA in Fig. 3). This result allows for a clear assignment of the beating signature to NaDPA. In Fig. 4, an additional interference pattern in the transient CARS signal in the spectral region around 1,600 cm–1 can be noticed. It manifests itself in the contour plot of Fig. 4 as fringes of the 660-fs modulation with a shorter period. In the cut along the time axis at 1,600 cm–1 shown in Fig. 6, two clear peaks spaced by ≈200 fs can be identified, which are followed by a complex pattern at further delay times. The interpretation of the transient signal is complex because beating between the signal of the 1,569 cm–1 band and the bands at 1,435 as well as 1,383 cm–1 is possible. Furthermore, the broad solvent band centered around 1,640 cm–1 (see Raman spectrum in Fig. 3) also will contribute to the interference, primarily leading to a very fast dephasing. However, the quality of the FFT spectrum from the transient signal is surprisingly good (see Fig. 6 Inset). The broad band around 144 cm–1 in the FFT encompasses 134 and 186 cm–1 in its width, corresponding to the difference in Raman shift of the 1,569 and the 1,435 as well as the 1,383 cm–1 band, respectively (see Fig. 3). The beating pattern in the CARS signal recorded at this spectral position can be interpreted to be primarily the result of the interference between the band at 1,569 cm–1 and the bands at 1,435 and 1,383 cm–1.
Fig. 4.
Logarithmic contour plot of the CARS signal intensity as a function of probe pulse delay Δt and as a function of the spectral shift of the CARS signal relative to the maximum in the spectrum of the probe laser pulse, obtained from a sample with 250 mM DPA in H2O/NaOH at pH 12. The positions of the Raman bands of NaDPA at 1,569, 1,435, and 1,383 cm–1 are marked with red lines in the transient spectrum.
Fig. 5.
Logarithmic CARS signal intensity at an anti-Stokes shift of 1,390 cm–1 as a function of probe pulse delay Δt, obtained from a sample with 250 mM DPA in H2O/NaOH at pH 12. Inset shows the FFT spectrum after subtraction of the averaged exponential decay curve from the signal.
Fig. 6.
Logarithmic CARS signal intensity at an anti-Stokes shift of 1,600 cm–1 as a function of the probe pulse delay Δt, obtained from a 250 mM sample of DPA in H2O/NaOH at pH 12. Inset shows the FFT spectrum of the transient signal.
The estimated energy of the CARS signal generated at the first peak of the ringing tale (see Fig. 5) is 85 fJ per pulse for a 250-nJ probe pulse. In these measurements, the energies of the pump and Stokes pulses are also 250 nJ. Thus, the photon number conversion rate, or efficiency of the nonresonant CARS on the 250 mM DPA solution, is ≈3 × 10⁻⁷.
Detection of DPA Through fs-CARS in the UV. Now, we move on to our experiment with a near-resonant UV probe pulse. Here, the pump and Stokes pulses are applied coincidentally (as described in Detection of DPA Through fs-CARS in the Visible) and the delay of the UV probe pulse is scanned.
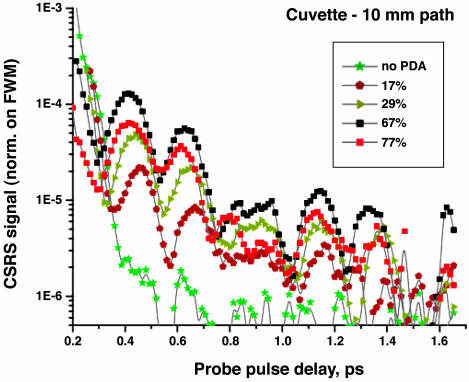
Fig. 7 shows the dependence of the CSRS signal as a function of the probe delay for different values of DPA concentration in H2O/NaOH solution. The CSRS signal is normalized with respect to the FWM maximum. We observe two superimposed oscillations with frequencies of 150 46 cm–1 (corresponding to a period of 0.22 and 0.73 ps, respectively), which agree with the expected values of 134 and 52 cm–1 to within the experimental margin of error. The FFT of the signal, after subtraction of the major exponential decay component, gives 136 ± 7 and 51 ± 7 cm–1. The ratio of the amplitude of the first oscillation to the amplitude of the zero-delay FWM signal is of the order of 10–4 to 10–5 depending on the concentration of NaDPA.
Fig. 7.
Logarithmic CSRS signal intensity at 336 nm, normalized on FWM maximum, as a function of the probe pulse delay for different concentrations of DPA in H2O/NaOH (as a percentage of the saturated solution). A cuvette with 10-mm path is used. The maximum response is observed for a DPA concentration of 33 mM (≈67% of the saturated DPA solution).
The measurements are done with the 10-mm-path cuvette. It is observed that for such a sample there is an optimal concentration of DPA (67 ± 5% of the saturated solution value) that gives the maximal CSRS response. Further increasing the DPA concentration leads to appreciable absorption of the probe pulse and reduction in the CSRS signal. The wavelength setting of the monochromator is chosen to be 336 nm, which is the expected wavelength of the FWM signal. The voltage on the PMT and attenuation of the signal before entering the spectrometer are fixed.
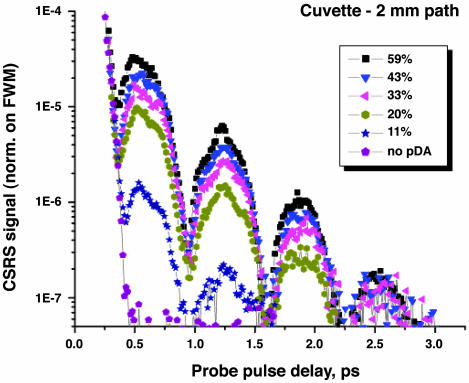
Fig. 8 shows the dependence of time-resolved CARS signal at 306 nm on the delay of the probe pulse for different values of DPA concentration in H2O/NaOH solution. The wavelengths of the pump, Stokes, and probe laser pulses are carefully chosen to agree with the molecular vibration and near-resonant excitation of DPA. To reduce absorption of the signal, the thin, 2-mm-path cuvette is used in the measurements.
Fig. 8.
Logarithmic CARS signal intensity at 306 nm, normalized on FWM maximum, as a function of the probe pulse delay for different concentrations of DPA in H2O/NaOH (in % from saturation). A cuvette with 2-mm path is used.
Comparison of time-resolved CARS signal for samples with DPA and for those with only the buffer solution clearly indicates the presence of the NaDPA CARS signal. As one can see, we also observed a clear picture of polarization beats. For this particular Raman shift, beating between only two modes, 1,435 and 1,383 cm–1, is present. For a higher shift, we see the evidence of the third mode in the quantum beat signal as well. The ratio of the amplitude of the first oscillation to the amplitude of zero-delay four-wave mixing signal is on the order of 10–5.
A Fourier transform analysis of the beating curve obtained with the 59% DPA solution shows a well resolved peak in the spectrum of the beats corresponding to a frequency of ≈49 ± 5cm–1, which is close to the difference frequency between the 1,383- and 1,435-cm–1 vibrational modes of NaDPA.
An estimate for the photon number conversion rate for near-resonant CARS comes from the already known ratio between the amplitudes of the first oscillation and the FWM signal and the observation that the generated FWM signal at zero delay is ≈300 times weaker than the probe pulse. These considerations give an efficiency of 10–7 for a DPA concentration of 30 mM. This concentration is nearly eight times lower than that used in the visible CARS study. Assuming that the effective volumes of the solutions used in the two experiments are about the same, one gets a 20-fold higher conversion rate (per particle) in comparison with the estimate for the nonresonant Raman measurements.
Although near-resonant Raman scattering should in principle be superior to nonresonant CARS, it should be recalled that the energies of the pump and Stokes pulses in the two experiments are also different in magnitude. That might be a dominant factor in the observed enhancement. Indeed, the product of the pump and Stokes pulse average powers in the second experiment (4.78 × 0.75 mW) are ≈30 times higher than in the first one (0.25 × 0.25 mW).
Efficiency of Coherent Raman Scattering
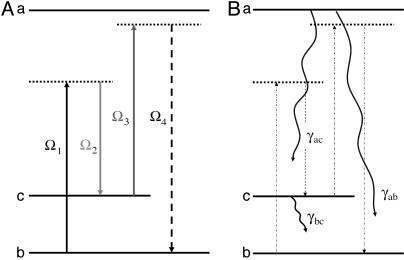
The signal vs. probe intensity ratio also can be calculated theoretically. To obtain this ratio, we model our molecule as a three-level medium interacting with the three input pulses to generate the signal pulse (see Fig. 9).
Fig. 9.
Model structure. (A) Energy levels and fields. (B) Decay and dephasing rates. The electronic dephasing times were taken to be  and the vibrational decoherence time
The probe pulse is time delayed with respect to the pump and Stokes pulses to separate the signal from the nonresonance background of FWM, which is predominant at zero delay. One can measure the intensity ratio of the FWM with respect to the signal and with respect to the probe and then estimate the photon number conversion rate, since
 |
[1] |
where td is the delay and γvib is the vibrational coherence dephasing time, while the intensity I can be expressed as
 |
[2] |
where n is the number of photons, ω and λ are the frequency and the wavelength of the field, τ is the pulse duration, and A is the beam cross-sectional area. That is, n4/n3 = (I4λ4)/(I3λ3). This ratio of the number of photons in the signal n4 over the number of photons in the probe beam n3 is also calculated theoretically, as shown in Appendix, to
 |
[3] |
where Δ = ωab – ν4 is the detuning from the excited electronic level and ρbc the vibrational coherence. For our experimental parameters: λab = 270 nm, the wavelength corresponding to the excited electronic level of DPA, λ3 = 320 nm and λ4 = 306 nm the wavelengths of the probe and anti-Stokes fields correspondingly,  , (γrad)–1 = 30 ns, particle density N = 1.8 × 1019 cm–3, interaction length z = 0.1 × 10⁻³ m and a vibrational coherence of |ρbc| = 2.7 × 10⁻³ as calculated in the Appendix, we obtain
 |
[4] |
This estimation gives us the ratio of n4/n3 of the same order of magnitude as the one observed in the experiment.
Conclusion
In this work, we have presented two different approaches to detect the molecular signature of DPA by using fs-CARS. In the first approach, we used an all-visible scheme that only required molecular coherence by means of a two-photon resonance. We subsequently probed the system with an electronically nonresonant pulse. The polarization beats between different molecular vibrations are evident in our time-delayed data, and the beat frequencies were extracted with a FFT. The overall efficiency of conversion of probe-beam photons to CARS signal photons in this experiment was estimated to be 3 × 10⁻⁷.
In the second color scheme, we used a visible two-photon resonance for the creation of molecular coherence but then applied an electronically near-resonant UV pulse. The molecular signature was clearly evident in the time series of the probe delay. Theoretical modeling suggests that using a near-resonant pulse increases the intensity of the CARS signal. The efficiency of the near-resonant CARS experiment was estimated to be 10–7. Although the overall efficiency of the two schemes is about the same, the efficiency per particle is 20-fold higher in the near-resonant case with the assumption of equal effective volumes.
It is important to stress the differences in the two experiments. The all-visible study was optimized for high concentrations (250 mM DPA dissolved in solution) at low optical power (0.25 mW). The second study was designed for low concentration (<50 mM DPA) at higher optical powers (≈3 mW). Either way, the results are encouraging. Our work provides an answer to an important question, whether a significant quantum coherence can be established and maintained in a DPA molecule. From the comparison of the experiment and the theory, we conclude that the magnitude of the prepared coherence can be as large as 10–3 (maximum coherence is one half) and can survive for several picoseconds. Our results provide strong evidence that a biomolecular detector based on resonant CARS is a viable alternative to fluorescence detectors. In the future, adaptive pulse shaping of the pump and Stokes fields could be added to the current setup, which could further improve our findings.
Acknowledgments
We thank Guy Beadie, Arthur Dogariu, Joseph Giordmaine, Phill Hemmer, Jaan Laane, Kevin Lehmann, Manjusha Mehendale, Richard Miles, John F. Reintjes, Warren S. Warren, and Suhail M. Zubairy. We also thank Sergey Zherebtsov and Xudong Xu for their assistance with the experiment. This work was supported by the Office of Naval Research; U.S. Army Edgewood Research, Development, and Engineering Center Contact W971SR-04-P-0092; the Defense Advanced Research Projects; Robert A. Welch Foundation Grants A1261, A1547, and A1546; National Science Foundation Grant 0218595 and PHY-0354897, and an award from Research Corporation.
Appendix
In a time-delayed CARS scheme, the pump and Stokes pulses are applied first and result in a coherent vibrational motion of the medium described by the ρbc density matrix element. A probe pulse, applied after some time delay, scatters off that coherence to generate the signal anti-Stokes pulse. The equations of motion that describe the preparation of the |ρbc| coherence by the first two pulses are
 |
[5] |
where nab = ρaa – ρbb, nac = ρaa – ρcc are the population inversions and
 |
[6] |
j = 1, 2, 3, 4, the Rabi frequencies of the pump, Stokes, probe, and anti-Stokes fields, respectively. By setting  ,
,  and
and  the equations of motion become
 |
[7] |
where Γab = i(ωab – ν1) + γab, Γac = i(ωac – ν2) + γac and Γbc = γbc.
From the equations above, we obtain in steady-state regime
 |
[8] |
and for optical pulses strongly detuned from the electronic transition and shorter than the vibrational relaxation rate
 |
where τ is the duration of pump and Stokes pulses and Δ is the detuning. For parameters of the experiments, we have |ρbc| = 2.7 × 10⁻³.
When the probe pulse is applied, after some time delay, it drives that coherence to generate polarization 𝒫 in the lasing transition |a〉 ↔ |b〉 corresponding to the density matrix element ρab. Specifically, the polarization is  where
where  is the dipole moment of the lasing transition and N is the particle density. The polarization generates the signal pulse as described by Maxwell's equation
 |
[9] |
assuming phase matching, the amplification is governed by
 |
[10] |
where ρ  is the slowly varying amplitude of ρab. The equations of motion are
 |
[11] |
where Ω3 and Ω4 are the Rabi frequencies of the probe and signal fields, Γab = i(ωab – ν4) + γab, Γac = i(ωac – ν3) + γac and Γbc = γbc.
From the equation for  in the steady state and for
  we get
 |
[12] |
Hence, Eq. 12 becomes
 |
[13] |
For simplicity let us write c/ν4 = λ4/2π, ωab – ν4 = Δ the detuning from the lasing transition and integrate the above to get
 |
[14] |
thus
 |
[15] |
 , where λab is the wavelength that corresponds to electronic resonance to the lasing transition |a〉 ↔ |b〉 and γrad is the radiative decay rate of that transition; similarly we express
  and by using I = 2πħcn/(τAλ) we have
 |
[16] |
Author contributions: Z.-E.S., N.G.K., G.G.P., V.A.S., A.V.S., G.R.W., Y.V.R., T.S., W.K., and M.O.S. designed research; D.P., M.Z., Z.-E.S., N.G.K., A.A.K., R.M., V.A.S., A.V.S., G.R.W., Y.V.R., T.S., D.A.A., S.G., and M.O.S. performed research; Z.-E.S., A.A.K., G.G.P., V.A.S., H.S., A.V.S., G.R.W., Y.V.R., T.S., S.G., W.K., and M.O.S. contributed new reagents/analytic tools; D.P., M.Z., Z.-E.S., N.G.K., A.A.K., R.M., G.G.P., V.A.S., A.V.S., G.R.W., Y.V.R., T.S., D.A.A., S.G., W.K., and M.O.S. analyzed data; and D.P., Z.-E.S., N.G.K., R.M., G.G.P., V.A.S., A.V.S., G.R.W., Y.V.R., T.S., S.G., W.K., and M.O.S. wrote the paper.
Abbreviations: CARS, coherent anti-Stokes Raman scattering; CSRS, coherent Stokes Raman scattering; DPA, dipicolinic acid; FFT, fast Fourier transform; FWM, four-wave-mixing; OPA, optical parametric amplifier; PMT, photomultiplier tube.
References
- 1.Scully, M. O., Kattawar, G. W., Lucht, P. R., Opatrny, T., Pilloff, H., Rebane, A., Sokolov, A. V. & Zubairy, M. S. (2002) Proc. Natl. Acad. Sci. USA 99, 10994–11001. [DOI] [PMC free article] [PubMed] [Google Scholar]
- 2.Harris, S. E., Yin, G. Y., Jain, M. & Merriam, A. J. (1997) Philos. Trans. R. Soc. London Ser. A 355, 2291–2304. [Google Scholar]
- 3.Merriam, A. J., Sharpe, S. J., Shverdin, M., Manuszak, D., Yin, G. Y. & Harris, S. E. (2000) Phys. Rev. Lett. 84, 5308–5311. [DOI] [PubMed] [Google Scholar]
- 4.Wang, H., Goorskey, D. & Xiao, M. (2001) Phys. Rev. Lett. 87, 073601. [DOI] [PubMed] [Google Scholar]
- 5.Turukhin, A. V., Sudarshanam, V. S., Shahriar, M. S., Musser, J. A., Ham, B. S. & Hemmer, P. R. (2002) Phys. Rev. Lett. 88, 023602. [DOI] [PubMed] [Google Scholar]
- 6.Matsko, A. B., Kocharovskaya, O., Rostovtsev, Y., Welch, G. R., Zibrov, A. S. & Scully, M. O. (2001) in The Advances in Atomic, Molecular, and Optical Physics, eds. Bederson, B. & Walther, H. (Academic, Boston), Vol. 46, p. 191–242. [Google Scholar]
- 7.Liu, C., Dutton, Z., Behroozi, C. H. & Hau, L. V. (2001) Nature 409, 490–493. [DOI] [PubMed] [Google Scholar]
- 8.Phillips, D. F., Fleischhauer, A., Mair, A., Walsworth, R. L. & Lukin, M. D. (2001) Phys. Rev. Lett. 86, 783–786. [DOI] [PubMed] [Google Scholar]
- 9.Zibrov, A. S., Matsko, A. B., Kocharovskaya, O., Rostovtsev, Y. V., Welch, G. R. & Scully, M. O. (2002) Phys. Rev. Lett. 88, 103601. [DOI] [PubMed] [Google Scholar]
- 10.Harris, S. E. & Yamamoto, Y. (1998) Phys. Rev. Lett. 81, 3611–3614. [Google Scholar]
- 11.Harris, S. E. & Hau, L. V. (1999) Phys. Rev. Lett. 82, 4611–4614. [Google Scholar]
- 12.Lukin, M. D. & Imamoglu, A. (2000) Phys. Rev. Lett. 84, 1419–1422. [DOI] [PubMed] [Google Scholar]
- 13.Jain, M., Xia, H., Yin, G. Y., Merriam, A. J. & Harris, S. E. (1996) Phys. Rev. Lett. 77, 4326–4329. [DOI] [PubMed] [Google Scholar]
- 14.Hakuta, K., Marmet, L. & Stoicheff, B. P. (1992) Phys. Rev. A At. Mol. Opt. Phys. 45, 5152–5159. [DOI] [PubMed] [Google Scholar]
- 15.Harris, S. E. & Sokolov, A. V. (1998) Phys. Rev. Lett. 81, 2894–2897. [Google Scholar]
- 16.Sokolov, A. V. & Harris, S. E. (2003) J. Opt. B Quant. Semiclass. Opt. 5, R1–R26. [Google Scholar]
- 17.Kocharovsky, V., Cameron, S., Lehmann, K., Lucht, R., Miles, R., Rostovtsev, Y., Warren, W., Welch, G. R. & Scully, M. O. (2005) Proc. Natl. Acad. Sci. USA 102, 7806–7811. [DOI] [PMC free article] [PubMed] [Google Scholar]
- 18.Beadie, G., Reintjes, J., Bashkansky, M., Opatrny, T. & Scully, M. O. (2003) J. Mod. Opt. 50, 2361–2368. [Google Scholar]
- 19.Beadie, G., Bashkansky, M., Reintjes, J. & Scully, M. O. (2004) J. Mod. Opt. 51, 2627–2635. [Google Scholar]
- 20.Sariyanni, Z. E. & Rostovtsev, Y. (2004) J. Mod. Opt. 51, 2637–2644. [Google Scholar]
- 21.Mehendale, M., Bosacchi, B., Gatzogiannis, E., Dogariu, A., Warren, W. S. & Scully, M. O. (2004) J. Mod. Opt. 51, 2645–2653. [Google Scholar]
- 22.Beadie, G., Sariyanni, Z. E., Rostovtsev, Y., Opartny, T., Reintjes, J. & Scully, M. O. (2005) Opt. Commun. 244, 423–430. [Google Scholar]
- 23.Das, K. K., Rostovtsev, Y. & Scully, M. O. (2005) Opt. Commun. 246, 551–559. [Google Scholar]
- 24.Demtröder, W. (1996) Laser Spectroscopy: Basic Concepts and Instrumentation (Springer, Berlin), 2nd Ed.
- 25.Leonhardt, R., Holzapfel, W., Zinth, W. & Kaiser, W. (1987) Chem. Phys. Lett. 133, 373–377. [Google Scholar]
- 26.Pestov, D., Zhi, M., Sariyanni, Z.-E., Kalugin, N. G., Murawski, R., Rostovtsev, Y. V., Sautenkov, V. A., Sokolov, A. V. & Scully, M. O. (2006) J. Raman Spectrosc., in press.


