

Abstract
System logs are run-time significant events of computer systems recorded by software. By analyzing the system logs, a lot of important information and issues can be detected promptly. Log anomaly detection is a popular research topic in recent years. However, log anomaly detection faces lots of challenges such as the variability of logs, imbalance of normal and abnormal records in log, the continuous emergence of new log formats. To address these challenges, we propose a log anomaly detection framework named LogSentry based on contrastive learning and retrieval-augmented. Our framework consists of a training phase and an inference phase. In the training phase, a BERT based log anomaly detection model using contrastive learning is pre-trained and fine-tuned. In the inference phase, a retrieval-augmented method based on KNN is introduced. During inference, the prediction result of the log anomaly detection model and the average output of the retrieval-augmented method based on KNN will do a weighted summation to obtain the final result, which is whether the log data is abnormal or normal. Our experiments on widely used log datasets indicate the solution proposed in this paper achieves high performance over baseline methods.
Keywords: System Logs, Anomaly Detection, Contrastive Learning, Retrieval-Augmented, BERT, KNN
Subject terms: Mathematics and computing, Computer science
Introduction
Logs are structured or unstructured textual information printed by code during the operation of a computer system, typically consisting of timestamps and textual information. The log records the real-time operation status of the system, including the normal operation status and the status when anomalies occur. By collecting and analyzing logs, anomalies in software systems can be quickly detected and located, and relevant repairs and processing can be carried out. This methodology significantly enhances system reliability and operational efficiency.
In recent years, various methods have been used in the research field of log anomaly detection to effectively detect log anomaly information. Especially with the rapid development of artificial intelligence, many artificial intelligence methods have been applied in this field, including traditional machine learning methods, deep learning methods, etc. For example, traditional machine learning methods including: decision tree1, principal component analysis (PCA)2,3, logistic regression4, vector machine (SVM)5,6 and invariant mining (IM)7 . However, these traditional machine learning based methods can not understand the rich semantic information in log texts, nor can they handle the sequential relationships between log event sequences. With the development of deep learning applications and natural language processing (NLP), many researchers have also attempted to use deep neural network and NLP for log anomaly detection such as LogFormer8, LogRobust9, DeepLog10, LogAnomaly11, and LogBERT12. Generally, the existing deep learning log and NLP anomaly detection methods are superior to traditional machine learning log anomaly detection method. However, there are still several important challenges remain in log anomaly detection. The major challenges can be summarized as follows:
The variability of logs: Computer software and hardware systems are widely used in various industries, and there is no unified log format in the industry. Different manufacturers and software have different logging formats. This brings about the problem of a wide variety of log types and endless formats.
Imbalance of normal and abnormal records in log: Log anomaly detection is essentially a binary task, divided into normal and abnormal categories. Logs have the characteristic of imbalanced distribution, with more normal data and relatively less abnormal data. Therefore, by directly classifying the data, the trained model is easily overwhelmed by normal class data preferences, thereby ignoring abnormal class data.
New log formats emerging: With the continuous development of new computer software and hardware products, new log formats are also emerging. This requires the log anomaly detection model to have openness, which can not only detect anomalies in existing logs, but also perform anomaly detection on newly generated logs.
To address the issues mentioned above, recent years some researchers propose the anomaly detection method based on supervised contrastive learning such as LogContrast13, AugLog14, LogEncoder15, CLDTLog16. By using contrastive learning, feature quality of training data can be enhanced, and better classification can be achieved later. However, the problem of imbalance of normal and abnormal records in log cannot be solved still. To better address the above issues, we propose a solution named LogSentry based on contrastive learning and retrieval-augmented.
The contributions of our framework are summarized as follows:
We propose a BERT based log anomaly detection model aimed to the issue of imbalance of normal and abnormal records in logs. First, pre-train the model based on BERT using contrastive learning, namely similar or dissimilar log key value pairs, so that the model can distinguish the features of abnormal and normal data well. Then fine-tune the pre-training model with supervised data to bring the model closer to the classification task.
We propose a retrieval-augmented method based on KNN to further improve the accuracy of binary classification tasks. Store the pre-trained log feature values of the BERT based model in the training phase into vector form with their corresponding hard labels (0 or 1) to form a knowledge base of log feature values. When a new log key sequence is inputted, its log feature value is extracted and the KNN algorithm is used to retrieve the top K log feature values that are closest to it and their corresponding hard labels (0 or 1) from the log feature value knowledge base. Then we compute the average value of these hard labels as the output. During inference, inspired by the Mixture of Experts17, the results of the log anomaly detection model prediction and the average output of the retrieval-augmented method based on KNN will do a weighted summation to obtain the final result, which is whether the log data is abnormal or normal.
Background
In this section, we introduce some background techniques that are used by LogSentry, including log parsing, contrastive learning and retrieval-augmented
Log parsing via log key sequences
Logs are structured or unstructured data which record run-time significant events of computer systems recorded by software. The construction process of log key sequence is shown in Fig. 1. Log parsing is the process of converting log text into structured log templates. When original log inputted, the unchanged parts from the log are found as templates and the changing parts as variables which can be replaced with placeholders (For example,<*>)18. A log template can be one-hot encoded to a log key with unique number. Then the original log sequence can form a log key sequence based on the log key19. The log key sequences can be presented as LKS = [LK1, LK2, LK3, …]. And label it as normal or abnormal based on the original log sequence content.
Fig. 1.
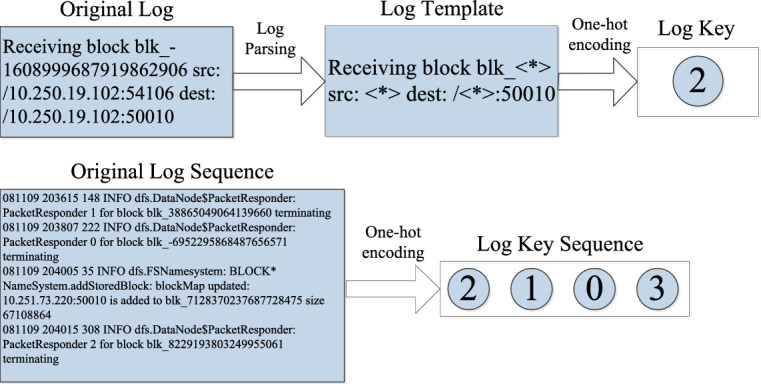
Construction process of log key sequence.
Contrastive learning
Contrastive learning has emerged as a powerful paradigm in machine learning, particularly effective for learning discriminative feature representations by comparing sample relationships20. This approach trains models to maximize similarity between positive pairs (semantically related samples) while minimizing similarity between negative pairs (unrelated samples), leading to more robust and generalizable representations that significantly improve performance on downstream tasks like classification and retrieval21. In our log anomaly detection framework, we generate training pairs as illustrated in Fig. 2:
Fig. 2.
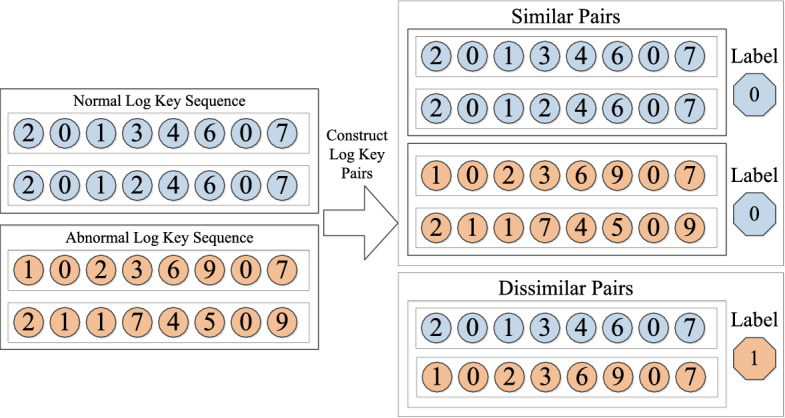
Combination of log key similarity and dissimilarity pairs.
1. Similar Pairs (Positive Samples, Label=0):
Generated by pairing two normal log key sequences (normal-normal)
Or pairing two abnormal log key sequences with similar failure patterns (abnormal-abnormal)
These pairs share underlying semantic or behavioral similarities in system operation
2. Dissimilar Pairs (Negative Samples, Label=1):
Formed by combining one normal log sequence with one abnormal sequence (normal-abnormal)
These pairs represent fundamentally different system states
This pairing strategy creates a structured contrastive learning objective where:
The embedding space pulls similar pairs (label 0) closer together
Pushes dissimilar pairs (label 1) farther apart
The resulting well-separated feature space significantly enhances the discriminative power of subsequent classification tasks
The hard labeling (0/1) provides clear optimization boundaries, while the contrastive objective ensures the model learns essential distinctions between normal and anomalous log patterns, even when dealing with complex, real-world log data variations.
Retrieval-augmented
Retrieval-Augmented is a method of utilizing external knowledge bases, vectorizing and advanced natural language processing techniques to improve the performance of information retrieval systems. It enables the retrieval system to better understand the user’s query intention and improve the accuracy and efficiency of retrieval through a deep understanding and semantic expansion of query statements and document content22,23. The distribution of normal and abnormal log data is imbalanced. In order to improve the final prediction results and alleviate the impact of this imbalance, we introduce retrieval-augmented methods in the solution.
Methodology
Overview
In general, our framework consists of a training phase and an inference phase. In the training phase, our goal is to train a BERT based log anomaly detection model using contrastive learning, which is actually a binary classification problem between normal and abnormal. The system log data has a characteristic that there are many normal class data and very few abnormal class data. Directly classifying the log data can easily be overwhelmed by the preference for normal class data and ignore abnormal class data. The model training is divided into two steps: The first step is to pre-train the BERT based model using contrastive learning, and the second step is to fine-tune the model using supervised data. In the inference phase, a retrieval-augmented method based on KNN is designed. The knowledge base of log feature values is constructed by the pre-trained log feature values and their hard labels generated by the log anomaly detection model in the pre-training phase. By using this method, we can compute the average value of the hard labels which are connected with the top K log feature values closest to the inputted log key sequence. During inference, the prediction result of the log anomaly detection model and the average output of the retrieval-augmented method based on KNN will do a weighted summation to obtain the final result, which is whether the log data is abnormal or normal.The process of the inference phase in our framework is shown as Fig. 3.
Fig. 3.
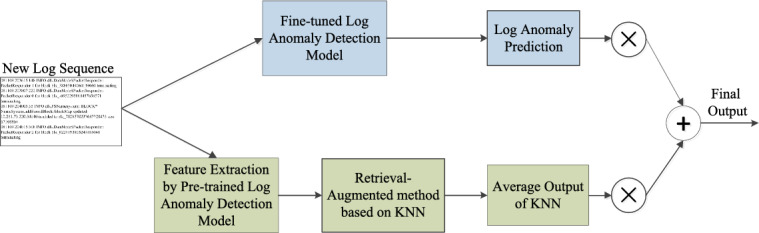
The process of the inference phase in our framework.
The pseudo-code of the training phase is shown in Algorithm 1 as below.
Algorithm 1.

Two-stage training: Pre-training and fine-tuning.
Training phase
Log anomaly detection model pre-training
Our pre-training model architecture is designed based on the BERT network and mainly inspired by BLIP24. During the pre-training stage, we use shared-encoder contrastive architecture based on BERT. And the log key pairs are set as input. The model pre-training architecture is shown in Fig. 4.
Fig. 4.
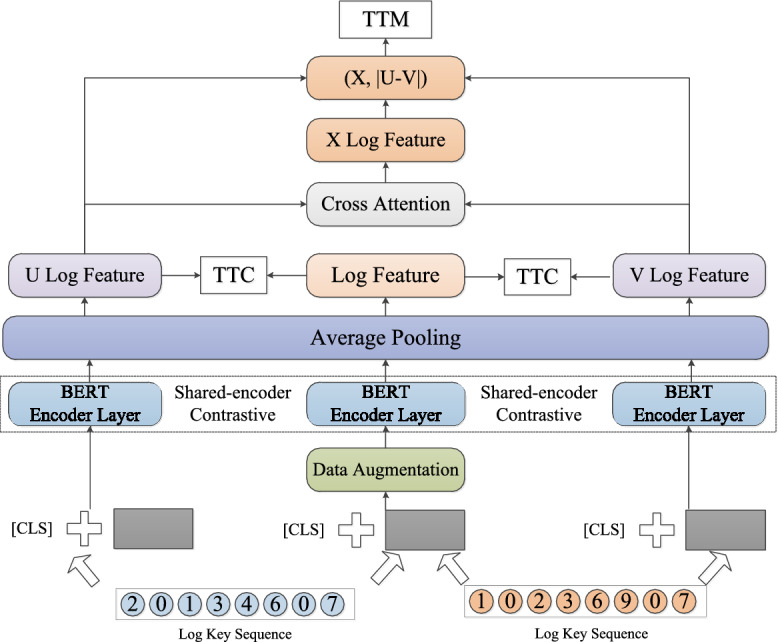
Log anomaly detection model pre-training architecture.
We employ a shared-encoder contrastive architecture based on BERT as text encoder for feature extraction. Especial, the data augmentation methods is used in middle path before BERT model, which refer to Cutoff method from ConSERT25. Cutoff method randomly erases some tokens (for token cutoff), feature dimensions (for feature cutoff), or token spans (for span cutoff) in the feature matrix25. U Log Feature and V Log Feature can be gotten via the shared-encoder contrastive architecture based on BERT.
Then Sentence-BERT26 architecture with classification objective function is used. The cross attention mechanism is a foundational component in many advanced machine learning architectures, particularly in transformer-based models. It enables one sequence of data (the target sequence) to selectively focus on relevant parts of another sequence (the source sequence). By using U Log Feature and V Log Feature, X Log Feature is generated via Cross Attention mechanism. Classification objective function is used for the output. We concatenate X Log Feature with the element-wise difference and multiply it with the trainable weight . The formula can be abbreviated as:
| 1 |
N is the dimension of the log sequence embeddings, set by 768 here. K is the number of labels, set by 2 here26.
During the pre-training process, three important loss functions are used as below:
a) Text-Text Contrastive Loss (TTC)
TTC can enlarge the entire feature space and solve the impact of high-frequency log keys on the quality of log features when BERT obtains log features.
For each input log key sequence, we generate two versions of token embeddings simultaneously: without data augmentation, with cutoff data augmentation, where . L is the length of the log key sequence, and d is the hidden dimension. Afterwards, both and will be encoded by multi-layer transformer blocks in BERT, and log key sequence feature representations and will be generated through average pooling.
When BERT extracts the feature vectors of log sequences, average pooling is used. Due to the influence of high-frequency log keys, the obtained feature vectors are aggregated together. The usage of contrastive learning helps to ensure that the feature representations of log key sequences can be well distinguished in the feature space, enlarging the feature space of log key sequences. Meanwhile, applying InfoNCE loss for comparative learning of a batch of features. The formula for calculating the comparative loss is:
| 2 |
Among them, represents the cosine similarity function, and controls temperature as a hyperparameter. Finally, we averaged the classification losses of all 2N batches to obtain the final comparative loss .
b) Text-Text Matching Loss (TTM)
TTM is essentially a binary classification task that enables the model to bring similar log feature values closer and keep dissimilar log feature values away from each other. TTM adopts a cross entropy loss function, and the loss formula is as follows:
| 3 |
Among them, is the label of the log match in the real distribution and is the probability of the log match in the predicted distribution by the model.
c) Joint Loss
By jointly using loss function and loss function , the joint loss function of the pre-training phase is obtained as follows:
| 4 |
is a hyperparameter used to balance the loss functions and .
Log anomaly detection model fine-tuning
To make the output of the model close to the downstream task, we perform supervised fine-tuning on the pre-trained model27. The data used for fine-tuning is annotated log sequence pairs. In model fine-tuning design, the BERT encoder layer first adds a feed forward layer, and then passes through a classifier. The model fine-tuning architecture is shown in Fig. 5.
Fig. 5.

Log anomaly detection model fine-tuning architecture.
This classifier is implemented by a two layers of feed forward neural network, using the BCE cross entropy loss function as the log sequence anomaly detection. Therefore, the loss function used of fine-tuning phase is as follows:
| 5 |
Among them, represents the label of the sample, with an abnormal sample value of 1 and a normal sample value of 0, and are the input data and labels, respectively. is the parameter of the entire model during the pre-training phase. is the probability predicted by the model.
Inference phase
Retrieval-augmented method based on KNN
The distribution of normal and abnormal log data is uneven. When using data with uneven distribution during pre-training and fine-tuning, the model may overfit normal data. In order to improve the final prediction results and alleviate the impact of this imbalance, a retrieval-augmented method is introduced28. The Retrieval-Augmented method architecture is shown as Fig. 6.
Fig. 6.

Retrieval-augmented method architecture.
In this method, we obtain the log feature value embedding vector from the log anomaly detection model gotten in pre-training phase, which forms a tuple with its annotated hard labels. Multiple tuples construct the log feature value knowledge base (KB)29.
When comparing vector similarity, we use cosine similarity to calculate the similarity between vectors. Similarly, given a input embedding as anchor point, we formulate another probability distribution over each embeddings existing in KB. And the stands for temperature.
| 6 |
At inference time, one log sequence key will be inputted. After passing through the shared-encoder contrastive architecture based on BERT mentioned in log anomaly detection model pre-training phase, its log feature embedding vector will be generated. Hierarchical Navigable Small World (HNSW) algorithm is a state-of-the-art method for approximate nearest neighbor (ANN) search, offering exceptional performance for large-scale, high-dimensional datasets search such as vector retrieval. We used the HNSW algorithm30 to derive the K nearest log’s embeddings and their corresponding labels from the KB. Then we compute the weighted average of these labels based on .
| 7 |
The final average output will be used for the generation of the final prediction result in the next step.
Anomaly detection
The final binary classification prediction result (normal or abnormal) is obtained by weighting the prediction results of the Log Anomaly detection model and the average output of the retrieval-augmented method based on KNN. The calculation formula used is as follows:
| 8 |
is the hyperparameter controlling the trade-off between the two predictions.
Experiments
In this chapter, we compare our method with other representative methods on two different benchmark datasets.
Environment
We implemented this experiment on Ubuntu server (2 NVIDIA GeForce RTX 4090), based on Pytorch and python3.8. During the experiment, the train data accounted for 55% of the total data, the test set accounted for 25%, and the validation set accounted for 20%. During normal system operation, the data collected at that time is considered normal data. When various types of faults are occured, the data collected during that specific time period becomes abnormal data. We set the BGL sliding window size to 2 minute and the step size to 1 minute in order to divide the data. For HDFS, we segment the data based on session windows. The label of the window is determined based on whether an exception occurs within each time window. For LogSentry, we use BERT-BASE in our experiments. We adopt the Adam optimizer and set the learning rate to 5. A linear learning rate warm-up is applied over 10% of the total training steps. During the pretraining phase, the batch size is set to 16 with 10 training epochs, while in the fine-tuning phase, the batch size is set to 64 with 6 training epochs. Regarding the comparison model, we adopted their public implementation, preprocessed the experimental data, set up the model based on the parameters in the original article, and obtained the final experimental results.
Datasets
Loghub31 has open-sourced several real-world log datasets, including distributed system, supercomputer system and operating system log datasets. We conducted experiments to evaluate the effectiveness of LogSentry using two widely used log datasets in Loghub, namely HDFS and BGL.
a) HDFS dataset
It is created by more than 200 Amazon’s EC2 nodes that execute Hadoop-based map-reduce tasks and then labeled by Hadoop domain specialists. This dataset totally contains 11175629 logs grouped by block id. There are 575061 groups consisting of 558223 normal groups and 16838 abnormal groups2.
b) BGL dataset
This dataset is gathered from the IBM Blue Gene/L supercomputer. There are 4747963 logs labeled by domain experts, of which 348460 log entries are from abnormal events. BGL dataset does not contain the identifier for grouping. Thus, we must set a fixed window to group logs into log sequences32.
Metrics
The proposed framework requires empirical validation through experimentation to assess its operational efficacy and quantify performance improvements. This section introduces some evaluation standards used in our experiments. Use the following definitions to evaluate the solution:
True Positive (TP): The amount of log key sequences that are classified correctly into the abnormal classification.
True Negative (TN): The amount of log key sequences that are classified correctly into the normal classification.
False Positive (FP): The amount of log key sequences that are classified incorrectly into the abnormal classification.
False Negative (FN): The amount of log key sequences that are classified incorrectly as normal classification.
Based on the above terminology, consider the following most commonly used evaluation metrics33:
Precision shows the percentage of log sequences that are truly detected as anomalies among all the log sequences detected as anomalies.
| 9 |
Recall shows the percentage of anomaly log sequences that are truly detected among all abnormal log sequences.
| 10 |
F1-Score is the harmonic average of Precision and Recall.
| 11 |
Through these universal metrics, our solution can be compared with other mainstream methods for detecting log anomalies14.
Baseline: In the benchmark comparison, we selected five commonly used log anomaly detection methods using deep neural network and NLP in recent years as the baseline, including: LogRobust9, DeepLog10, LogBERT12, LogFormer8 and PLELog34. We compare the results of LogSentry and these methods, including supervised, semi-supervised and unsupervised.
Performance evaluation
Table 1 and Table 2 shows the results of performance comparison between LogSentry and benchmark methods on two datasets: HDFS and BGL. The metrics which we focus are Precision, Recall and F1-Score. The methods are divided into three categories: Unsupervised, Semi-Supervised and Supervised. Our LogSentry-pre method only with model Pre-training can be regarded as Semi-Supervised method. The LogSentry-full method including model pre-training, fine-tuning and retrieval-augmented can be seen as Supervised training method.
Table 1.
The performance comparison on HDFS dataset.
| Category | Method | Precision | Recall | F1-Score |
|---|---|---|---|---|
| Unsupervised | DeepLog | 95.65 | 25.54 | 40.32 |
| LogBERT | 95.90 | 61.10 | 74.65 | |
| Semi-Supervised | PLELog | 95.46 | 81.84 | 88.13 |
| LogSentry-pre | 97.36 | 95.67 | 96.51 | |
| Supervised | LogRobust | 98.00 | 84.87 | 90.96 |
| LogFormer | 97.54 | 97.26 | 97.40 | |
| LogSentry-full | 97.30 | 98.70 | 98.00 |
Table 2.
The performance comparison on BGL dataset.
| Category | Method | Precision | Recall | F1-Score |
|---|---|---|---|---|
| Unsupervised | DeepLog | 96.00 | 77.60 | 85.82 |
| LogBERT | 83.58 | 97.35 | 89.94 | |
| Semi-Supervised | PLELog | 98.51 | 82.29 | 89.68 |
| LogSentry-pre | 96.94 | 96.50 | 96.72 | |
| Supervised | LogRobust | 98.99 | 88.50 | 93.45 |
| LogFormer | 98.50 | 96.51 | 97.50 | |
| LogSentry-full | 98.08 | 98.30 | 98.20 |
We compare LogSentry with baseline approaches in this section. Table 1 shows the results on the HDFS dataset. On the HDFS dataset, it can be found that LogSentry achieves best F1-Score even comparing to the latest LogFormer method. And LogSentry achieves highest recall that all of the baseline approaches, which indicates LogSentry detects more anomalies than other approaches. Moreover, LogSentry achieves higher precision that other baseline approaches except LogRobust and LogFormer, which means LogSentry produces fewer false alarms. LogRobust has the highest precision equally to LogSentry, but it has a lower recall and F1-Score.
Table 2 shows the results on the BGL dataset. LogSentry achieves the highest F1-Score and recall comparing to all of the baseline approaches. It means LogSentry has better performance and detects more anomalies than other approaches. Also LogSentry achieves higher precision that other baseline approaches except LogRobust and LogFormer which have the lower F1-Score and recall comparing to LogSentry. In addition, whether on the HDFS dataset or BGL dataset, LogSentry-full has significantly improved various indicators compared to LogSentry-pre, reflecting the effectiveness of model fine-tuning and retrieval-augmented in our method.
On the other hand, according to statistics, the HDFS dataset has a total of 47 log keys. The training set uses 42 log keys and the test set has 5 unknown log keys. The BGL dataset has a total of 422 log keys. The training set uses 414 log keys and the test set has 8 unknown log keys. The statistical results indicate that LogSentry has a certain generalization ability to handle unseen log types.
In general, LogSentry has shown better performance in various indicators, which can be attributed to its integration of contrastive learning and retrieval-augmented to solve the problem of imbalanced distribution between normal and abnormal logs. At the same time, the robustness of processing unknown log data has been strengthened.
Parameter analysis
In this subsection, we analyze the impact of some key parameters of LogSentry and draw the feature extraction distribution map of model pre-training and fine-tuning.
a) Impact of each method proposed in our framework
To observe the impact of each method proposed in our framework, we conduct ablation experiments on different methods at different time sliding window lengths on BGL dataset. Time sliding window length is used to control the length of inputted log sequences.“Pre-training only” refers to using only the model pre-training method. “Fine-tune w/o Retrieval” refers to using the model pre-training and fine-tuning method.“Fine-tune with Retrieval” refers to using all methods in this article, including model pre-training, fine-tuning and retrieval augmented.The ablation experiments are carried out and the corresponding ablation results are listed in Table 3. In Table 3, “Pre-training only” method achieved the average Precision, Recall, F1-Score by 95.79%, 92.89%, 94.28%. By introducing fine-tuning method, the average Precision, Recall, F1-Score are improved to 98.22%, 96.19%, 97.19%. Finally, by further incorporating the retrieval augmented method, Precision, Recall, F1-Score can reach 98.32%, 96.88%, 97.59%. From the experimental results, it can be seen that the model pre-training, the model fine-tuning and the retrieval augmented methods proposed in our framework all have significant impact on the Precision, Recall, F1-Score of anomaly detection under different window sizes.
Table 3.
Performance of the three methods proposed in our framework on BGL dataset.
| Window Size | Pre-training only | Fine-tune w/o Retrieval | Fine-tune with Retrieval | ||||||
|---|---|---|---|---|---|---|---|---|---|
| (Minutes) | Precision | Recall | F1-Score | Precision | Recall | F1-Score | Precision | Recall | F1-Score |
| 1 | 94.52 | 84.53 | 89.25 | 97.12 | 95.87 | 96.49 | 97.89 | 95.87 | 96.87 |
| 2 | 95.90 | 93.66 | 94.77 | 98.98 | 97.16 | 98.06 | 98.81 | 97.50 | 98.15 |
| 3 | 95.56 | 94.39 | 94.97 | 97.22 | 95.75 | 96.48 | 97.41 | 97.94 | 97.68 |
| 4 | 96.05 | 95.36 | 95.70 | 99.62 | 94.41 | 96.95 | 99.62 | 94.65 | 97.07 |
| 5 | 96.94 | 96.50 | 96.72 | 98.18 | 97.74 | 97.96 | 97.86 | 98.42 | 98.20 |
| Average | 95.79 | 92.89 | 94.28 | 98.22 | 96.19 | 97.19 | 98.32 | 96.88 | 97.59 |
b) Performance across varying values based on different Top-K values
To better analyze the effect of the weighting factor for combining the outputs of the main model and the retrieval-augmented method, we conduct the experiments on the performance across varying values based on different Top-K values on BGL dataset. In particular, we choose F1-Score as the performance test indicator. In the experiment, 18 values of beta hyper-parameter are selected from the range of [0, 1], including [0, 0.1, 0.18, 0.2, 0.26, 0.34, 0.4, 0.46, 0.5, 0.52, 0.54, 0.56, 0.6, 0.68, 0.7, 0.76, 0.8, 1] , and Top-k selects 4 values including [5, 15, 50, 100]. The experiment result is shown in Fig. 7.
Fig. 7.

Performance across varying values based on different top-K values.
As illustrated in Fig. 7, within the range of 0.5 to 1, the F1-Score consistently reaches its lowest values when is set to 1.0 - which completely disables the retrieval-augmented method - across all Top-K configurations. These results confirm that the KNN-based retrieval-augmented method is indispensable for improving overall performance.
The experimental results demonstrate that the highest F1-Score of 98.20 is achieved when is set to 0.68 and the Top-K value is 100. This optimal value underscores the importance of striking a careful balance between the predictions of the main model and the influence of the retrieval-augmented method.
If is too high, the main model fails to correct its inherent biases using the retrieval-augmented method.
If is too low, retrieval noise (e.g., irrelevant neighbors) may overwhelm the correct predictions.
As further evidenced in Fig. 7, the impact of Top-K values exhibits a non-monotonic pattern. Crucially, higher Top-K values do not invariably enhance performance, since excessively large values introduce substantial noise through the retrieval of irrelevant data, which contaminates the final voting outcomes.
c) Impact of dataset usage ratio in fine-tuning phase
We analyze the effect of Dataset usage ratio in fine-tuning phase, and the results are shown in Fig. 8. Overall, during the fine-tuning process, the higher the dataset usage ratio, the F1-Score, Precision, and Recall perform better. From the experimental results, it can be seen that even during the model fine-tuning stage, the datasets usage ratio is only 1%, while Precision, Recall, and F1-Score still perform well. The experimental results show that our fine-tuning model design has good robustness and can adapt to different injection rates. The dataset usage ratio in fine-tuning phase is set to 100% as the default in our framework.
Fig. 8.

Impact of dataset usage ratio in fine-tuning phase.
d) Impact of the window size while deviding log sequence
We divide the length of log sequences through a time sliding window, with each log sequence length not exceeding 350. And observe the impact of different sliding window sizes on the results. The experiment used 5 different sliding window sizes, and their statistical results are shown in the Table 4.
Table 4.
Sliding window statistical results.
| Window Size | Abnormal | Normal | Average |
|---|---|---|---|
| (Minutes) | Log Sequences | Log Sequences | Sequence Length |
| 1 | 2666 | 35345 | 124 |
| 2 | 4128 | 49093 | 167 |
| 3 | 5152 | 59738 | 191 |
| 4 | 6047 | 68744 | 207 |
| 5 | 6832 | 76811 | 219 |
Then we observed the F1-Score, Precision, and Recall performance of the method under different sliding window sizes on BGL dataset. According to the legend type in Fig. 9, “Pre-training only” refers to using only the model pre-training in this article’s method. “Fine-tune w/o Retrieval” refers to using the model pre-training and fine-tuning in this article’s method. “Fine-tune with Retrieval” refers to using all methods in this article, including model pre-training, fine-tuning and retrieval-augmented. Experimental data shows that our method has good robustness at window sizes of various lengths.
Fig. 9.

Impact of the window size while deviding log sequence.
e) Performance of knowledge base used in retrieval-augmented method under sampled and unsampled data
In order to better discuss the interference caused by the imbalance of the number of normal and abnormal logs, we compare the performance of knowledge base used in retrieval-augmented method under sampled and unsampled data on BGL dataset. In the process of sampling, the training data is sampled with under sampling when the knowledge base is constructed. Under sampling keeps the data volume of normal and abnormal log sequence consistent, and balances the data categories in the knowledge base. The ratio of normal and abnormal samples in experimental datasets is summarized below:
Sampled dataset: 1798 normal vs. 1798 abnormal (ratio 1:1)
Unsampled dataset: 13338 normal vs. 1798 abnormal (ratio 7.4:1)
The performance comparison result can be seen in Table 5.
Table 5.
Performance of knowledge base used in retrieval-augmented method with sampled and unsampled data on BGL dataset.
| Top-K | Method | Sampled | Unsampled | ||||
|---|---|---|---|---|---|---|---|
| Precision | Recall | F1-Score | Precision | Recall | F1-Score | ||
| 5 | Pre-training only | 95.86 | 96.73 | 96.29 | 97.26 | 96.16 | 96.71 |
| Fine-tune with Retrieval | 97.97 | 98.30 | 98.14 | 98.19 | 97.97 | 98.08 | |
| 15 | Pre-training only | 95.97 | 96.73 | 96.35 | 97.16 | 96.50 | 96.83 |
| Fine-tune with Retrieval | 97.97 | 98.30 | 98.14 | 98.08 | 98.19 | 98.14 | |
| 100 | Pre-training only | 95.86 | 96.73 | 96.29 | 96.94 | 96.50 | 96.72 |
| Fine-tune with Retrieval | 97.97 | 98.30 | 98.14 | 97.97 | 98.42 | 98.20 | |
From the experiment, the value of F1-Score is higher with unsampled data on BGL dataset comparing to sampled data in our framework. In general, the Precision with unsampled data will be higher, and the Recall with sampled data will be higher. This is because the sampling method which we use reduces the number of samples of most classes and makes it close to the number of samples of a few classes, but it may lose important information of most classes.
f) Computational efficiency of retrieval-augmented method
To better analyze the trade-off between accuracy and inference speed, we conduct the experiments on computational efficiency. The performance comparison result can be seen in Table 6.
Table 6.
Computational efficiency of Retrieval-augmented method
| Method | BGL | HDFS | ||
|---|---|---|---|---|
| F1-Score | Time | F1-Score | Time | |
| w/o Retrieval | 97.96 | 69.92s | 97.92 | 11.50s |
| Top-K = 5 | 98.08 | +0.39s | 98 | +0.29s |
| Top-K = 50 | 98.19 | +0.71s | 97.92 | +0.37s |
| Top-K = 100 | 98.20 | +1.21s | 97.92 | +0.53s |
On HDFS dataset, when Top-k is set to 5, F1-Score performs best, and the retrieval-augmented method costs 0.29s more. On BGL dataset, when Top-k is set to 100, F1-Score achieves the best performance, and the retrieval-augmented method costs 1.21s more.
g) Feature extraction distribution map
To demonstrate the effectiveness of using contrastive learning, we plot the feature extraction distribution maps of model pre-training and fine-tuning based on HDFS and BGL, respectively. Furthermore, a subset including 8,000 normal log sequences and 2,000 abnormal log sequences is chosen from each type of testing set. The feature extraction distribution maps of model pre-training and fine-tuning are extracted from these sequences using LogSentry method and visualized in a two-dimensional space using a dimensionality reduction method t-SNE35. The visualizations are shown in Fig. 10.
Fig. 10.

t-SNE visualizations of feature extraction.
From the feature extraction distribution maps of the experimental results, it can be seen that after using the contrastive learning method, the normal and abnormal data used for model pre-training and fine-tuning have good aggregation.
Conclusion
In this paper, we propose LogSentry, a new log anomaly detection framework based on contrastive learning and retrieval-augmented. By combining contrastive learning and enhanced retrieval, this framework can better solve the problem of imbalanced normal log data and abnormal log data, and correctly identify abnormal logs better from log data. We demonstrate the effectiveness of our framework on two commonly used datasets (HDFS and BGL) in the field of log anomaly detection.
We also analyzed the impact of some key parameters and performed some related ablation experiments studies. We hope our work will provide a new thought for future researches on log anomaly detection.
On the other hand, since our approach only focuses on the single type of monitoring data as log, some anomalies can’t be found out from log only. Next step, we will consider incorporating methods such as multi-modal data analysis and log semantic analysis into our work to better address the issues of diverse and complex log formats. We plan to combine different sources of monitoring data such as logs, metrics, alerts and traces to execute multi-modal data analysis to find out the system anomalies more sufficiently. We will develop a cross-modal attention framework to synergistically integrate logs, metrics, alerts, and traces for comprehensive anomaly detection. This approach combines BERT-based log semantics with multi-modal fusion, enhancing detection robustness and coverage across diverse data formats. We also plan to use framework such as BERT to capture the semantics of log messages, making anomaly detection more robust and effective.
Acknowledgements
This work is supported by Guizhou Provincial Basic Research Program (Natural Science) Qiankehejichu-ZK[2023]Yiban252, High-level Innovative Talents in Guizhou Province (No. GCC[2023]033), Guizhou Provincial Basic Research Program (Natural Science) Qiankehejichu-JC[2024]Zhongdian013, Natural Science Research Project of Guizhou Provincial Department of Education (No. QJJ[2024]009), Natural Science Research Project of Guizhou Provincial Department of Education under Grant No. [2023]010, QIANKEHE PLATFORM TALENT BQW[2024]015/GZNU[2024]01 and National Natural Science Foundation of China (U22A2026).
Author contributions
Weian Li: Conceptualization, Methodology, Analysis, Writing, Editing. Yang Wu: Methodology, Analysis, Experiments. Wei Huang, Faheng Zhou, Lunzhi Deng: Investigation, Funding acquisition. Weihua Ou, Hongbing Wang: Writing-review, Funding acquisition. All authors contributed to the article and approved the submitted version.
Data availability
The datasets used during the current study are available in the [logpai/loghub] repository, [https://github.com/logpai/loghub/tree/master/HDFS#hdfs_v1] and [https://github.com/logpai/loghub/tree/master/BGL].
Declarations
Competing interests
The authors declare no competing interests.
Footnotes
Publisher’s note
Springer Nature remains neutral with regard to jurisdictional claims in published maps and institutional affiliations.
Contributor Information
Weihua Ou, Email: ouweihuahust@gznu.edu.cn.
Hongbing Wang, Email: hbwang@gznu.edu.cn.
References
- 1.Chen, M., Zheng, A. X., Lloyd, J., Jordan, M. I. & Brewer, E. Failure diagnosis using decision trees. In International Conference on Autonomic Computing, 2004. Proceedings., 36–43 (IEEE, 2004).
- 2.Xu, W., Huang, L., Fox, A., Patterson, D. & Jordan, M. I. Detecting large-scale system problems by mining console logs. In Proceedings of the ACM SIGOPS 22nd symposium on Operating systems principles, 117–132 (2009).
- 3.Xu, W., Huang, L., Fox, A., Patterson, D. & Jordan, M. Online system problem detection by mining patterns of console logs. In 2009 ninth IEEE international conference on data mining, 588–597 (IEEE, 2009).
- 4.Bodik, P., Goldszmidt, M., Fox, A., Woodard, D. B. & Andersen, H. Fingerprinting the datacenter: automated classification of performance crises. In Proceedings of the 5th European conference on Computer systems, 111–124 (2010).
- 5.Liang, Y., Zhang, Y., Xiong, H. & Sahoo, R. Failure prediction in ibm bluegene/l event logs. In Seventh IEEE International Conference on Data Mining (ICDM 2007), 583–588 (IEEE, 2007).
- 6.Han, S. et al. Log-based anomaly detection with robust feature extraction and online learning. IEEE Trans. Inf. Forensics Secur.16, 2300–2311 (2021). [Google Scholar]
- 7.Lou, J.-G., Fu, Q., Yang, S., Xu, Y. & Li, J. Mining invariants from console logs for system problem detection. In 2010 USENIX Annual Technical Conference (USENIX ATC 10) (2010).
- 8.Guo, H. et al. Logformer: A pre-train and tuning pipeline for log anomaly detection. Proc. AAAI Conf. Artif. Intell.38, 135–143 (2024). [Google Scholar]
- 9.Zhang, X. et al. Robust log-based anomaly detection on unstable log data. In Proceedings of the 2019 27th ACM joint meeting on European software engineering conference and symposium on the foundations of software engineering, 807–817 (2019).
- 10.Du, M., Li, F., Zheng, G. & Srikumar, V. Deeplog: Anomaly detection and diagnosis from system logs through deep learning. In Proceedings of the 2017 ACM SIGSAC conference on computer and communications security, 1285–1298 (2017).
- 11.Meng, W. et al. Loganomaly: Unsupervised detection of sequential and quantitative anomalies in unstructured logs. In IJCAI19, 4739–4745 (2019). [Google Scholar]
- 12.Guo, H., Yuan, S. & Wu, X. Logbert: Log anomaly detection via bert. In 2021 international joint conference on neural networks (IJCNN), 1–8 (IEEE, 2021).
- 13.Zhang, T., Huang, X., Zhao, W., Mo, G. & Bian, S. Logcontrast: A weakly supervised anomaly detection method leveraging contrastive learning. In 2023 IEEE 23rd International Conference on Software Quality, Reliability, and Security (QRS), 48–59 (IEEE, 2023).
- 14.Zhou, J. & Qian, Y. Auglog: System log anomaly detection based on contrastive learning and data augmentation. In 2022 5th International Conference on Data Science and Information Technology (DSIT), 1–7 (IEEE, 2022).
- 15.Qi, J. et al. Logencoder: Log-based contrastive representation learning for anomaly detection. IEEE Trans. Netw. Serv. Manag.20, 1378–1391 (2023). [Google Scholar]
- 16.Tian, G., Luktarhan, N., Wu, H. & Shi, Z. Cldtlog: System log anomaly detection method based on contrastive learning and dual objective tasks. Sensors23, 5042 (2023). [DOI] [PMC free article] [PubMed] [Google Scholar]
- 17.Cai, W. et al. A survey on mixture of experts. arXiv preprint arXiv:2407.06204 (2024).
- 18.Zhu, J. et al. Tools and benchmarks for automated log parsing. In 2019 IEEE/ACM 41st International Conference on Software Engineering: Software Engineering in Practice (ICSE-SEIP), 121–130 (IEEE, 2019).
- 19.He, S., Zhu, J., He, P. & Lyu, M. R. Experience report: System log analysis for anomaly detection. In 2016 IEEE 27th international symposium on software reliability engineering (ISSRE), 207–218 (IEEE, 2016).
- 20.Gao, T., Yao, X. & Chen, D. Simcse: Simple contrastive learning of sentence embeddings. arXiv preprint arXiv:2104.08821 (2021).
- 21.Chen, T., Kornblith, S., Norouzi, M. & Hinton, G. A simple framework for contrastive learning of visual representations. In International conference on machine learning, 1597–1607 (PMLR, 2020).
- 22.Guu, K., Lee, K., Tung, Z., Pasupat, P. & Chang, M. Retrieval augmented language model pre-training. In International conference on machine learning, 3929–3938 (PMLR, 2020).
- 23.Jiang, Z. et al. Active retrieval augmented generation. arXiv preprint arXiv:2305.06983 (2023).
- 24.Li, J., Li, D., Xiong, C. & Hoi, S. Blip: Bootstrapping language-image pre-training for unified vision-language understanding and generation. In International conference on machine learning, 12888–12900 (PMLR, 2022).
- 25.Yan, Y. et al. Consert: A contrastive framework for self-supervised sentence representation transfer. arXiv preprint arXiv:2105.11741 (2021).
- 26.Reimers, N. Sentence-bert: Sentence embeddings using siamese bert-networks. arXiv preprint arXiv:1908.10084 (2019).
- 27.Almodovar, C., Sabrina, F., Karimi, S. & Azad, S. Logfit: Log anomaly detection using fine-tuned language models. IEEE Transactions on Network and Service Management (2024).
- 28.Pan, J., Liang, W. S. & Yidi, Y. Raglog: Log anomaly detection using retrieval augmented generation. In 2024 IEEE World Forum on Public Safety Technology (WFPST), 169–174 (IEEE, 2024).
- 29.Zhang, J. et al. Reaugkd: Retrieval-augmented knowledge distillation for pre-trained language models. In Proceedings of the 61st Annual Meeting of the Association for Computational Linguistics (Volume 2: Short Papers), 1128–1136 (2023).
- 30.Malkov, Y. A. & Yashunin, D. A. Efficient and robust approximate nearest neighbor search using hierarchical navigable small world graphs. IEEE Trans. Pattern Anal. Mach. Intell.42, 824–836 (2018). [DOI] [PubMed] [Google Scholar]
- 31.He, S., Zhu, J., He, P. & Lyu, M. R. Loghub: A large collection of system log datasets towards automated log analytics. arXiv e-prints arXiv–2008 (2020).
- 32.Oliner, A. & Stearley, J. What supercomputers say: A study of five system logs. In 37th annual IEEE/IFIP international conference on dependable systems and networks (DSN’07), 575–584 (IEEE, 2007).
- 33.Li, S. et al. False alert detection based on deep learning and machine learning. Int. J. Semant. Web Inf. Syst.18, 1–21 (2022). [Google Scholar]
- 34.Yang, L. et al. Semi-supervised log-based anomaly detection via probabilistic label estimation. In 2021 IEEE/ACM 43rd International Conference on Software Engineering (ICSE), 1448–1460 (IEEE, 2021).
- 35.Van der Maaten, L. & Hinton, G. Visualizing data using t-sne. J. Mach. Learn. Res.9, 2579−2605. (2008).
Associated Data
This section collects any data citations, data availability statements, or supplementary materials included in this article.
Data Availability Statement
The datasets used during the current study are available in the [logpai/loghub] repository, [https://github.com/logpai/loghub/tree/master/HDFS#hdfs_v1] and [https://github.com/logpai/loghub/tree/master/BGL].