

ABSTRACT
Background
Cardiac computed tomography (CT) is a well‐established process used to diagnose coronary artery disease; however, its specific advantages in predicting the use of atherectomy devices during percutaneous coronary intervention (PCI) for moderate to severe calcified lesions remain to be determined. This study aimed to develop a risk scoring system for predicting the use of atherectomy devices in PCI on the basis of morphological findings obtained by preoperative cardiac CT.
Methods
In this retrospective, multicenter, observational study, we screened patients who underwent cardiac CT 6 months before PCI for the target lesion. Consequently, 498 de novo stenotic lesions from 415 patients with moderate to severe calcification were included. Then, 70% of the cohort (derivation cohort, 349 lesions) was randomly selected and used for developing the risk model of predicting the use of an atherectomy device; the remaining 30% (validation cohort, 149 lesions) was used to evaluate the discriminative ability and calibration of the model.
Results
Multivariate analysis in the derivation cohort identified four factors as predictors of the use of atherectomy devices: circumferential angle ≥ 270°, bifurcation, calcified mass, and longitudinal distance ≥ 9 mm. The discriminative ability and calibration of the risk model that was developed using the four factors was excellent in the validation cohort (c‐statistic = 0.87, Hosmer–Lemeshow goodness‐of‐fit test, p = 0.53).
Conclusions
The developed model accurately predicted the use of atherectomy devices in patients with moderate to severe coronary calcification. Estimating atherectomy usage by an easily usable objective tool on the basis of the preoperative cardiac CT findings has the potential for widespread implementation in clinical settings.
Keywords: atherectomy devices, atherectomy score, calcification, computed tomography, coronary lesions
Abbreviations
- CAD
coronary artery disease
- CT
computed tomography
- IVUS
intravascular ultrasound
- kVp
kilovolt peak
- OAS
orbital atherectomy
- OCT
optical coherence tomography
- OFDI
optical frequency domain imaging
- PCI
percutaneous coronary intervention
- RA
rotational atherectomy
- Slab MIP
thin‐slab maximum intensity projection
1. Introduction
Percutaneous coronary intervention (PCI) is an established treatment for ischemic heart disease, with its technological advancements contributing to improved safety and efficacy [1]. However, severe coronary artery calcification remains a significant challenge [2, 3].
Atherectomy devices, including the rotational atherectomy (RA) and orbital atherectomy systems (OAS), are commonly used to manage calcified coronary lesions. However, associated perioperative complications remain a significant concern [4, 5, 6]. Recently, a North American and European expert consensus on RA has been published to provide a clinical standard for RA operators [7, 8]. The use of atherectomy devices necessitates careful preparation, technical expertise, and procedural proficiency. Therefore, accurate preprocedural assessment of the need for atherectomy is crucial for optimal procedural planning. Atherectomy devices are frequently guided by intravascular imaging modalities, such as optical coherence tomography (OCT)/optical frequency domain imaging (OFDI) and intravascular ultrasound (IVUS) [9, 10]. Intravascular imaging has been effective in optimizing the use of atherectomy devices during PCI [11]. However, such imaging devices are infrequently utilized because of limitations in insurance coverage and equipment availability, particularly in Europe, North America, and other regions. Furthermore, the use of intravascular imaging devices may be ineffective because of the presence of severe calcification and/or highly tortuous vessels, making it challenging to assess the lesion morphology before the procedure.
Cardiac computed tomography (CT) is a well‐established diagnostic tool for coronary artery disease (CAD). CT also excels in identifying lesion characteristics and morphology. Consequently, it has increasingly been utilized as an adjunctive tool in formulating strategies for PCI [12]. Some studies investigated the utility of cardiac CT in predicting RA use; however, two studies [13, 14] examined prespecified parameters (mean CT density or per‐lesion calcium scores) to predict RA use, but these parameters were not validated externally. Thus, we sought to develop a CT‐based atherectomy scoring system by comprehensively screening morphological parameters of calcified coronary lesions according to cardiac CT to predict the use of atherectomy devices during PCI. This retrospective study used a large multicenter cohort to conduct derivation and validation analyses.
2. Methods
2.1. Study Population
This retrospective, multicenter observational study was conducted across 14 facilities affiliated with the organization Cardiac CT for Interventionalists Conference in Japan (Supporting Information Appendix). Patients who underwent PCI between April 2021 and March 2022 were screened according to the following conditions: (1) cardiac CT performed within 6 months before PCI, (2) moderate or severe coronary calcification detected on cardiac CT, and (3) de novo lesions in a native coronary artery. Only the image data obtained at 120 peak kilovolt (kVp) were analyzed because the tube voltage (kVp) affects the CT values (Hounsfield units, HU). Between April 2021 and March 2022, 547 lesions from 462 patients met the above‐mentioned criteria. After excluding 49 lesions without a tube voltage of 120 kVp, this study included 498 lesions from 415 patients. Subsequently, 70% of the cohort (derivation cohort, 349 lesions) that was randomly selected was used to develop the risk prediction model, whereas the remaining 30% (validation cohort, 149 lesions) was used to evaluate the model's discriminative ability and calibration (Figure 1).
Figure 1.

Study flow diagram. CT, computed tomography; kVp, kilovolt peak; OAS, orbital atherectomy; PCI, percutaneous coronary intervention; RA, rotational atherectomy.
2.2. Cardiac CT Analysis
Raw CT data were reconstructed and analyzed using commercially available software (Synapse VINCENT version 6.8, Fujifilm Medical Corporation, Tokyo, Japan). Aside from standard image reconstructions in coronary CT angiography, the thin‐slab maximum intensity projection (Slab MIP) method, a convenient reconstruction technique available on a standard workstation, was employed to analyze the lesion characteristics precisely. The lesion with the most heavily calcified segment within the treatment target area was selected for analysis and identified with reference to the coronary angiographic findings. The window level/window width was set at 300/1500 to decrease the blooming artifact of calcium in the CT images [15, 16]. Structures with a density of ≥ 600 HU indicated calcification [17, 18]. The evaluation criteria were selected according to previous reports on cardiac CT and atherectomy devices [9, 10, 13, 14]. The circumferential angle, maximum and mean density (HU), and distribution of the calcification were measured on the cross‐sectional CT images. The calcification's circumferential angle was defined between the lines detected at the center of the lumen. We manually delineated the vessel's outer contour as identified by the software and implemented the necessary corrections accordingly. The software also automatically calculated the maximum and mean density within the vessel's outer contour (both plaque and lumen) (Figure 2A) [14]. The calcified mass, as derived from CT, was defined as a hyperattenuating structure protruding into the center of the vessel on the cross‐sectional CT images, with a density of ≥ 600 HU used as the threshold to indicate calcification [19]. The distribution of the calcification was classified as focal to the myocardial side or elsewhere. Using a three‐dimensional (3D) image obtained from a CT scan (Figure 2B,C), we measured the longitudinal distance of the calcified segment, the whole lesion length of the calcified segment, vessel bending, and calcification volume. The longitudinal distance was the length of the continuous calcified lesions along the long axis, and the whole lesion length was the total length of the multiple calcified lesions, including gaps of ≤ 5 mm between adjacent calcifications. The calcification volume was the total volume of structures with CT values of ≥ 400 and ≥ 600 HU, measured within a 10 mm region (extending 5 mm proximally and distally from the target lesion's calcification). Additionally, a side branch (≥ 2 mm) emerging within the target lesion indicated bifurcation [20]. Two investigators (Y.N. and R.H.) independently analyzed the cardiac CT image at the central lab, and any discrepancies were resolved by consensus. The reproducibility of CT findings was evaluated using a random sample of 20 cases. Interobserver agreement was assessed using the kappa coefficient for categorical variables and the intraclass correlation coefficient (ICC) for continuous variables. There was good agreement for mean density (ICC = 0.93), maximum density (ICC = 0.95), circumferential angle (ICC = 0.92), longitudinal distance (ICC = 0.96), whole lesion length (ICC = 0.94), vessel bending (ICC = 0.84), bifurcation (κ = 0.86), calcified mass (κ = 0.76), distribution (κ = 0.69), calcification volume ≥ 400 HU (ICC = 0.93), and calcification volume ≥ 600 HU (ICC = 0.92).
Figure 2.

Computed tomography (CT) analysis of the coronary artery calcification. Measurement methods for cardiac CT in (A) cross‐sectional, (B) volume rendering 3D imaging (calcification‐focused imaging), and (C) volume rendering 3D imaging (coronary artery area). [Color figure can be viewed at wileyonlinelibrary.com]
2.3. Statistical Analysis
The association between CT morphology and use of atherectomy devices was estimated using a logistic regression model. We converted continuous variables into categorical variables by using the cutoff point at which the Youden index was maximized and included in the model. The risk prediction model was established using a logistic regression model through the backward elimination of variables from the fully adjusted model with 0.05 as the significance level. We used the multivariate analysis results to develop a clinical prediction model, which was then converted into a point‐based risk score using the approach established by the Framingham Heart Study [21, 22]. Subsequently, the performance of the risk prediction model was tested among the participants in the validation cohort. The ability of the risk prediction model to discriminate between those who were treated with and without atherectomy devices was evaluated using the c‐statistic, while the calibration was evaluated using the Hosmer–Lemeshow test. All statistical data were analyzed using SAS version 9.4 (SAS Institute, Cary, NC). A two‐tailed p‐value of < 0.05 was considered statistically significant for all analyses except for the backward elimination.
3. Results
Table 1 presents the patients' crude baseline characteristics. The median age was 73 years, and 25.3% of the participants were women. The mean left ventricular ejection fraction was 63%. The proportion of patients undergoing dialysis was 9.4%, and that of patients with acute coronary syndrome was 6.8%. Lesions were noted in the left main coronary artery in 7.0% of cases, the left anterior descending artery in 58.1%, the left circumflex artery in 12.5%, and the right coronary artery in 21.5%. Supporting Information S1: Figure 1 shows the ability of each CT morphological finding in predicting the use of atherectomy devices. Table 2 shows the crude and multivariate‐adjusted odds ratios for the use of atherectomy devices in the derivation cohort. Using backward elimination of variables (threshold: p < 0.05) to select predictors for the fully adjusted model, we identified four variables, namely, circumferential angle ≥ 270°, longitudinal distance ≥ 9 mm, bifurcation, and calcified mass, as the predictors of the use of atherectomy devices in the risk prediction model. Given that the beta coefficients obtained were relatively close (1.13–1.91) between the variables, we decided to give 1 point to each variable to maximize simplicity for clinical use (Table 2) [23]. For each lesion, all applicable score values were summed to obtain the total difficulty score for that lesion (CT‐based atherectomy score). Each factor was assigned with a letter; A, B, C, and D stand for angle, bifurcation, calcified mass, and longitudinal distance, respectively (Figure 3A). The predicted risk of the use of atherectomy devices can be calculated using the equation described in Figure 3B. The optimal CT‐based atherectomy score cutoff to predict the use of atherectomy devices was ≥ 2, which had a sensitivity and specificity of 76.0% and 82.5%, respectively, as well as positive and negative predictive values of 68.6% and 87.2%, respectively (Supporting Information S1: Table 1). As shown in Supporting Information S1: Figure 2, one patient with a calcification angle > 270° (1 point), bifurcation (1 point), and distance ≥ 9 mm (1 point) without a calcified mass (0 point) obtained a total score of 3 points; thus, the probability of using atherectomy devices was approximately 87.2% (Figure 3).
Table 1.
Patient characteristics.
| All (415 patients) | |
|---|---|
| Age, years | 73 [67–80] |
| Women, % | 25.3 |
| Hypertension, % | 74.6 |
| Diabetes, % | 47.2 |
| Dyslipidemia, % | 70.7 |
| Current smoking, % | 26.2 |
| Family history of CAD, % | 6.3 |
| History of PCI, (%) | 21.7 |
| History of CABG, (%) | 2.9 |
| History of myocardial infarction, % | 13.0 |
| History of heart failure, % | 11.3 |
| LVEF, % | 63 [55–67] |
| Chronic kidney disease, % | 24.4 |
| eGFR, mL/min/1.73 m2 | 62 [50–73] |
| Dialysis, % | 9.4 |
| Acute coronary syndrome, % | 6.8 |
| Chronic total occlusion, % | 6.2 |
| Target lesion location, % | |
| Left main coronary artery | 7.0 |
| Left anterior descending | 58.1 |
| Left circumflex artery | 12.5 |
| Right coronary artery | 21.5 |
| Intravascular imaging (IVUS/OCT), % | |
| IVUS | 77.1 |
| OCT/OFDI | 24.1 |
| Medication, % | |
| Aspirin | 97.1 |
| P2Y12 inhibitor | 97.1 |
| Anticoagulant | 13.5 |
| Statin | 74.7 |
| Ezetimib | 10.6 |
| Beta blocker | 31.8 |
| ACE‐i or ARB | 50.4 |
| Ca blocker | 43.6 |
| Oral hypoglycemic agents | 32.3 |
| Insulin | 12.3 |
Note: Median [interquartile range] or frequency (%) is shown.
Abbreviation: ACE‐i, angiotensin‐converting enzyme inhibitors; ARB, angiotensin II receptor blocker; CABG, coronary artery bypass graft; CAD, coronary artery disease; eGFR, estimated glomerular filtration rate; IVUS, intravascular ultrasound; LVEF, left ventricular ejection fraction; OCT, optical coherence tomography; OFDI, optical frequency domain imaging; PCI, percutaneous coronary intervention.
Table 2.
Morphologic factors associated with use of atherectomy device, derivation cohort (349 lesions).
| Crude | Multivariate | Multivariate (backward)b | Integer score | |||||||
|---|---|---|---|---|---|---|---|---|---|---|
| β | Odds ratio [95% CI] | p value | β | Odds ratio [95% CI] | p value | β | Odds ratio [95% CI] | p value | ||
| Mean density ≥ 600 HU | 1.91 | 6.73 [4.09–11.07] | < 0.001 | 0.35 | 1.42 [0.63–3.22] | 0.40 | ||||
| Maximum density ≥ 1300 HU | 1.34 | 3.83 [2.40–6.12] | < 0.001 | 0.23 | 1.25 [0.60–2.63] | 0.55 | ||||
| Circumferential angle ≥ 270° | 1.82 | 6.20 [3.52–10.92] | < 0.001 | 1.76 | 5.83 [2.63–12.94] | < 0.001 | 1.88 | 6.57 [3.24–13.34] | < 0.001 | 1 |
| Longitudinal distance ≥ 9 mm | 1.70 | 5.48 [3.36–8.95] | < 0.001 | 0.57 | 1.77 [0.81–3.88] | 0.15 | 1.13 | 3.10 [1.71–5.62] | < 0.001 | 1 |
| Whole length ≥ 17 mm | 1.68 | 5.35 [3.30–8.67] | < 0.001 | 0.41 | 1.51 [0.75–3.05] | 0.25 | ||||
| Vessel bending ≥ 20 degrees | 0.59 | 1.80 [1.13–2.88] | 0.01 | 0.37 | 1.44 [0.77–2.70] | 0.25 | ||||
| Bifurcation (+) | 1.49 | 4.45 [2.74–7.23] | < 0.001 | 1.73 | 5.64 [2.92–10.91] | < 0.001 | 1.82 | 6.17 [3.30–11.55] | < 0.001 | 1 |
| Calc. mass | 2.19 | 8.95 [5.22–15.38] | < 0.001 | 1.67 | 5.32 [2.69–10.51] | < 0.001 | 1.91 | 6.73 [3.52–12.87] | < 0.001 | 1 |
| Calc. distribution (myocardial sitea) | −0.09 | 0.91 [0.57–1.46] | 0.71 | 0.25 | 1.29 [0.68–2.45] | 0.44 | ||||
|
Calc. volume (≥ 400 HU) ≥ 65 mm3 |
1.78 | 5.92 [3.63–9.67] | < 0.001 | 0.09 | 1.09 [0.33–3.63] | 0.88 | ||||
|
Calc. volume (≥ 600 HU) ≥ 36mm3 |
1.95 | 7.04 [4.29–11.55] | < 0.001 | 0.22 | 1.25 [0.35–4.45] | 0.73 | ||||
Abbreviations: CI, confidence interval; HU, Hounsfield unit.
Versus epicardial, lateral, and multiple calcification.
Backward elimination (p < 0.05) are presented.
Figure 3.
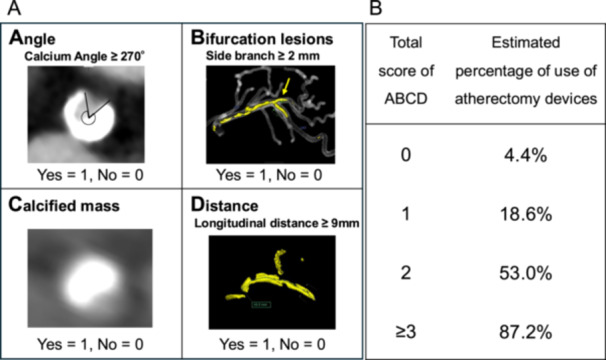
(A) Computed tomography (CT)‐based atherectomy score. The CT‐based atherectomy score consisted of four variables: circumferential angle ≥ 270°, longitudinal distance ≥ 9 mm, bifurcation, and moderate‐to‐severe calcified mass. These factors were individually assigned a letter: A, angle; B, bifurcation; C, calcified mass; and D, distance. (B) Estimated probability of atherectomy devices use according to the total ABCD score. [Color figure can be viewed at wileyonlinelibrary.com]
The validity of the risk prediction model was evaluated by c‐statistics and the Hosmer–Lemeshow test using the validation cohort (n = 149). The c‐statistic was 0.87 (95% confidence interval: 0.81–0.93). Figure 4 shows a comparison between the observed and model‐predicted risks of using atherectomy devices across the four risk groups. The predicted risks of the use of atherectomy devices were similar to the observed risks (Hosmer–Lemeshow goodness‐of‐fit test, p = 0.53).
Figure 4.

Calibration of the computed tomography (CT)‐based atherectomy score. The predicted usage rate of the atherectomy device using the CT‐based atherectomy score and the actual usage rate are shown. The agreements between the predicted and actual usage rates were assessed using the Hosmer–Lemeshow goodness‐of‐fit test across the four risk groups in the validation cohort. [Color figure can be viewed at wileyonlinelibrary.com]
4. Discussion
The developed CT‐based atherectomy score in this study accurately predicted the use of atherectomy devices in PCI in a cohort of patients with moderate to severe coronary calcification. The four risk factors, namely, circumferential angle ≥ 270°, longitudinal distance ≥ 9 mm, bifurcation, and calcified mass, were selected as components of the CT‐based atherectomy score. Estimating the use of atherectomy devices with preoperative cardiac CT using an easily applicable objective tool has the potential to be widely applied in clinical settings. This approach may particularly facilitate the efficient allocation of resources (e.g., time, equipment, and dedicated operators) tailored to the case complexity.
A per‐lesion calcium score assessed through CT reportedly predicts the use of atherectomy devices in RA [13, 14]. However, studies reporting such focused on exploring the factors related to the use of RA devices, with no reports on a risk score predicting the use of RA devices according to the comprehensive screening of morphological parameters. In the present study, we developed a CT‐based atherectomy scoring system according to the largest data set obtained from multiple institutions. Factors such as the circumferential angle and longitudinal distance of calcification are also included in the IVUS‐based and OCT‐based calcium scoring systems [9, 10]. Additionally, the presence of calcified mass is one of the criteria in the IVUS‐based calcium scoring system [10]. Although bifurcation has not been reported as a factor, calcification at the bifurcation site is known to contribute to side‐branch occlusion after stent placement because of the carina shift phenomenon [24]. Recently, the CT bifurcation scoring system was developed to predict side‐branch occlusion during PCI, and notably, calcified plaque in the main vessel was a key risk factor [20]. Therefore, atherectomy devices were more proactively used for patients with bifurcation calcification. Conversely, the present study did not identify calcification volume, vascular bending, or the mean density as risk factors.
Intravascular imaging modalities such as IVUS and OCT/OFDI are effective in optimizing the use of atherectomy devices during PCI [11]. The IVUS‐based and OCT‐based calcium scoring systems are useful for identifying calcified lesions that may benefit from plaque modification before stent implantation [9, 10]. However, a preprocedural intravascular assessment is impossible if IVUS and OCT cannot pass through the target lesion. Furthermore, only a few patients actually used intravascular imaging devices owing to the limitations of insurance coverage and equipment availability. Cardiac CT has become an established tool in the diagnostic workup of patients with suspected CAD, and leveraging preprocedural CT data is highly beneficial. Regarding the advantages of cardiac CT, especially for assessing calcified lesions, it can evaluate calcification preoperatively and examine cases wherein intravascular imaging cannot pass through. Therefore, identifying whether target lesions require the use of atherectomy devices using preprocedural CT would be helpful. Conversely, IVUS and OCT/OFDI cannot accurately evaluate the 3D formation of calcification, including its volume, bending, and overall shape among other factors [25].
Cardiac CT is an accurate, safe, and noninvasive alternative to invasive coronary angiography in CAD diagnosis [26]. It is also useful for assessing calcified coronary lesions and providing appropriate guidance for PCI in the presence of calcified lesions. In addition to routine image reconstructions by coronary CT, Slab MIP methods can generate easily interpretable images that simultaneously display anatomical characteristics as well as lumen and plaque information [27]. Okutsu et al. measured the thickness of coronary calcification using CT data analyzed with Slab MIP [28]. By employing these analyses, CT can help optimize patient selection for PCI and facilitate the planning and guidance of therapeutic interventions beyond the diagnostic phase [12, 29]. By understanding the type and complexity of the disease before the procedure, the necessary materials, personnel, initial strategy, potential complications, and appropriate corrective measures can be more effectively prepared [30]. These advancements represent a transformative shift toward personalized PCI interventions, ultimately improving the outcomes of patients with calcified coronary lesions, which are challenging to manage. Planning complex PCI for severe calcified lesions also enables patients to clearly understand the forthcoming intervention, making the consent procedure more comprehensive, given that the risk associated with these procedures is higher than that associated with PCI for noncalcified lesions. Our risk score comprises four easily measurable parameters; hence, it can be clinically applicable and contribute to the improved organization of the catheterization laboratory workflow beyond the diagnostic and therapeutic phases. Recently, Collet et al. proposed a groundbreaking treatment strategy called CT‐guided PCI [31, 32]. In addition, the Precise Procedural and PCI Plan (P4) Randomized Clinical Trial is currently ongoing (NCT05253677). This investigator‐initiated, multicenter randomized trial compares the clinical outcomes of the CT‐guided PCI strategy with those of the IVUS‐guided PCI strategy. The importance of CT in PCI is increasingly growing, and our proposed CT‐based atherectomy score may further enhance the safety and efficacy of CT‐guided PCI.
5. Limitations
This study has several limitations. First, this study evaluated the predictive capability of cardiac CT for angiography combined with intravascular imaging–guided atherectomy. Therefore, our CT‐based atherectomy score does not predict the necessity of atherectomy and its effectiveness in cases with underexpandable lesions. Second, the accuracy of assessing coronary artery calcification using cardiac CT remains unconfirmed. Third, our study period spanned from 2021 to 2022. During this time, intravascular lithotripsy (IVL) had not yet been approved in Japan. Consequently, cases treated with IVL were not included in this study. However, IVL has been increasingly adopted in recent years and is now frequently preferred over RA or OAS in clinical settings. Accordingly, future validation of the scoring system in an IVL‐inclusive population would be warranted to assess its applicability in contemporary practice. Fourth, the indication for the use of atherectomy devices was determined according to the expert consensus of Cardiovascular Intervention and Therapeutics (CVIT) [6]; however, the final decision to use these atherectomy devices depended on each operator. An important limitation of our score is that it predicts the use of atherectomy rather than the need for plaque modification or the clinical benefit, such as improved stent expansion. Since the decision to use atherectomy devices is largely subjective, the score may primarily reflect institutional or individual practice patterns rather than an objective requirement. Fifth, the prevalence of patients with a history of coronary artery bypass grafting (CABG) was extremely low (< 3%) in this cohort, rendering the applicability of our proposed CT‐based atherectomy score in this population uncertain. Finally, the proposed model lacked external validation. Further validation in an external cohort with different physical characteristics, demographic profiles, and variations in intravascular imaging systems or atherectomy usage thresholds would be desirable.
6. Conclusions
The CT‐based atherectomy scoring system, which accurately predicted the use of atherectomy devices during PCI in patients with moderate to severe calcified lesions, consisted of four components: circumferential angle ≥ 270°, longitudinal distance ≥ 9 mm, bifurcation, and calcified mass. Estimating atherectomy usage by an easily usable objective tool on the basis of the preoperative cardiac CT findings has the potential for widespread implementation in clinical settings.
Ethics Statement
This study conformed to the principles of the Declaration of Helsinki. The study protocol obtained approval from the Clinical Research Ethics Review Committee of the Kyushu University Medical District Department. Given the study's retrospective nature, the requirement for informed consent was based on the opt‐out principle. Patients were informed that data would be collected through each hospital's website and that they could exclude their data from the study. The authors have full access to and take full responsibility for the integrity of the data.
Conflicts of Interest
The authors declare no conflicts of interest.
Supporting information
Supplementary Figure 1: Association between cardiac CT morphology and the use of atherectomy devices. Supplementary Figure 2: Representative case example. Supplementary Table 1: Predictive performance of CT‐based atherectomy score.
Acknowledgments
We would like to thank the members of the Cardiac CT for the Interventionalists Conference (CCTI) for their cooperation in this study. This study was partially supported by a clinical research grant from the Japanese Circulation Society for T.N., Japan Society for the Promotion of Science (JSPS) KAKENHI (Grant Number: 25K11389, 23K08454, 22K16141) for N.Y., T.M., and T.N., a grant from Japan Arteriosclerosis prevention fund (JAPF) for T.N., and the Cross‐ministerial Strategic Innovation Promotion Program (SIP) “Integrated Health Care System” (Grant Number: JPJ012425) for T.M.
Nakano Y., Okutsu M., Hino R., et al., “ A Novel Cardiac Computed Tomography‐Based Calcium Scoring System for Predicting the Use of Atherectomy Devices in Severely Calcified Coronary Lesions,” Catheterization and Cardiovascular Interventions 106 (2025): 2892‐ 2900. 10.1002/ccd.70123.
References
- 1. Neumann F. J., Sousa‐Uva M., Ahlsson A., et al., “2018 ESC/EACTS Guidelines on Myocardial Revascularization,” European Heart Journal 40, no. 2 (2019): 87–165. [DOI] [PubMed] [Google Scholar]
- 2. Sharma S. K., Bolduan R. W., Patel M. R., et al., “Impact of Calcification on Percutaneous Coronary Intervention: MACE‐Trial 1‐Year Results,” Catheterization and Cardiovascular Interventions 94, no. 2 (2019): 187–194. [DOI] [PubMed] [Google Scholar]
- 3. Kawashima H., Serruys P. W., Hara H., et al., “10‐Year All‐Cause Mortality Following Percutaneous or Surgical Revascularization in Patients With Heavy Calcification,” JACC: Cardiovascular Interventions 15, no. 2 (2022): 193–204. [DOI] [PubMed] [Google Scholar]
- 4. Lee M. S., Gordin J. S., Stone G. W., et al., “Orbital and Rotational Atherectomy During Percutaneous Coronary Intervention for Coronary Artery Calcification,” Catheterization and Cardiovascular Interventions 92, no. 1 (2018): 61–67. [DOI] [PubMed] [Google Scholar]
- 5. Sakakura K., Jinnouchi H., Taniguchi Y., Yamamoto K., and Fujita H., “Lifetime Management of Severely Calcified Coronary Lesions: The Treatment Algorithm Focused on the Shape of Calcification,” Cardiovascular Intervention and Therapeutics 38, no. 4 (2023): 375–380. [DOI] [PubMed] [Google Scholar]
- 6. Sakakura K., Ito Y., Shibata Y., et al., “Clinical Expert Consensus Document on Rotational Atherectomy From the Japanese Association of Cardiovascular Intervention and Therapeutics,” Cardiovascular Intervention and Therapeutics 36, no. 1 (2021): 1–18. [DOI] [PMC free article] [PubMed] [Google Scholar]
- 7. Barbato E., Carrié D., Dardas P., et al., “European Expert Consensus on Rotational Atherectomy,” EuroIntervention 11, no. 1 (2015): 30–36. [DOI] [PubMed] [Google Scholar]
- 8. Sharma S. K., Tomey M. I., Teirstein P. S., et al., “North American Expert Review of Rotational Atherectomy,” Circulation Cardiovascular Interventions 12, no. 5 (2019): e007448. [DOI] [PubMed] [Google Scholar]
- 9. Fujino A., Mintz G. S., Matsumura M., et al., “A New Optical Coherence Tomography‐Based Calcium Scoring System to Predict Stent Underexpansion,” EuroIntervention 13, no. 18 (2018): 2182–2189. [DOI] [PubMed] [Google Scholar]
- 10. Zhang M., Matsumura M., Usui E., et al., “Intravascular Ultrasound–Derived Calcium Score to Predict Stent Expansion in Severely Calcified Lesions,” Circulation: Cardiovascular Interventions 14, no. 10 (2021): e010296. [DOI] [PubMed] [Google Scholar]
- 11. Truesdell A. G., Alasnag M. A., Kaul P., et al., “Intravascular Imaging During Percutaneous Coronary Intervention,” Journal of the American College of Cardiology 81, no. 6 (2023): 590–605. [DOI] [PubMed] [Google Scholar]
- 12. Serruys P. W., Hara H., Garg S., et al., “Coronary Computed Tomographic Angiography for Complete Assessment of Coronary Artery Disease,” Journal of the American College of Cardiology 78, no. 7 (2021): 713–736. [DOI] [PubMed] [Google Scholar]
- 13. Sekimoto T., Akutsu Y., Hamazaki Y., et al., “Regional Calcified Plaque Score Evaluated by Multidetector Computed Tomography for Predicting the Addition of Rotational Atherectomy During Percutaneous Coronary Intervention,” Journal of Cardiovascular Computed Tomography 10, no. 3 (2016): 221–228. [DOI] [PubMed] [Google Scholar]
- 14. Kurogi K., Ishii M., Nagatomo T., et al., “Mean Density of Computed Tomography for Predicting Rotational Atherectomy During Percutaneous Coronary Intervention,” Journal of Cardiovascular Computed Tomography 17, no. 2 (2023): 120–129. [DOI] [PubMed] [Google Scholar]
- 15. Andrew M. and John H., “The Challenge of Coronary Calcium on Coronary Computed Tomographic Angiography (CCTA) Scans: Effect on Interpretation and Possible Solutions,” International Journal of Cardiovascular Imaging 31, no. S2 (2015): 145–157. [DOI] [PubMed] [Google Scholar]
- 16. Kurogi K., Ishii M., Ikebe S., et al., “Calcium Evaluation Using Coronary Computed Tomography in Combination With Optical Coherence Tomography,” International Journal of Cardiovascular Imaging 39, no. 9 (2023): 1815–1824. [DOI] [PubMed] [Google Scholar]
- 17. Glodny B., Helmel B., Trieb T., et al., “A Method for Calcium Quantification by Means of CT Coronary Angiography Using 64‐Multidetector CT: Very High Correlation With Agatston and Volume Scores,” European Radiology 19 (2009): 1661–1668. [DOI] [PubMed] [Google Scholar]
- 18. Braber T. L., Willemink M. J., Bohté E. H., Mosterd A., Leiner T., and Velthuis B. K., “Assessment of Coronary Artery Calcium on Low‐Dose Coronary Computed Tomography Angiography With Iterative Reconstruction,” Journal of Computer Assisted Tomography 40, no. 2 (2016): 266–271. [DOI] [PubMed] [Google Scholar]
- 19. Takahashi Y., Toba T., Otake H., et al., “Feasibility of Morphological Assessment of Coronary Artery Calcification With Electrocardiography‐Gated Non‐Contrast Computed Tomography: A Comparative Study With Optical Coherence Tomography,” International Journal of Cardiovascular Imaging 37 (2021): 1445–1453. [DOI] [PubMed] [Google Scholar]
- 20. Lee S.‐H., Lee J. M., Song Y. B., et al., “Prediction of Side Branch Occlusions in Percutaneous Coronary Interventions by Coronary Computed Tomography: The CT Bifurcation Score as a Novel Tool for Predicting Intraprocedural Side Branch Occlusion,” EuroIntervention 15, no. 9 (2019): e788–e795. [DOI] [PubMed] [Google Scholar]
- 21. Wilson P. W. F., D'Agostino R. B., Levy D., Belanger A. M., Silbershatz H., and Kannel W. B., “Prediction of Coronary Heart Disease Using Risk Factor Categories,” Circulation 97, no. 18 (1998): 1837–1847. [DOI] [PubMed] [Google Scholar]
- 22. Tu J. V. and Naylor C. D., “Clinical Prediction Rules,” Journal of Clinical Epidemiology 50, no. 6 (June 1997): 743–744. [DOI] [PubMed] [Google Scholar]
- 23. Morino Y., Abe M., Morimoto T., et al., “Predicting Successful Guidewire Crossing Through Chronic Total Occlusion of Native Coronary Lesions Within 30 Minutes,” JACC: Cardiovascular Interventions 4, no. 2 (2011): 213–221. [DOI] [PubMed] [Google Scholar]
- 24. Sawaya F. J., Lefèvre T., Chevalier B., et al., “Contemporary Approach to Coronary Bifurcation Lesion Treatment,” JACC: Cardiovascular Interventions 9, no. 18 (2016): 1861–1878. [DOI] [PubMed] [Google Scholar]
- 25. Tajima A., Bouisset F., Ohashi H., et al., “Advanced CT Imaging for the Assessment of Calcific Coronary Artery Disease and PCI Planning,” Journal of the Society for Cardiovascular Angiography & Interventions 3, no. 3 (2024): 101299. [DOI] [PMC free article] [PubMed] [Google Scholar]
- 26. Maurovich‐Horvat P., Bosserdt M., Kofoed K. F., et al., “CT or Invasive Coronary Angiography in Stable Chest Pain,” New England Journal of Medicine 386, no. 17 (2022): 1591–1602. [DOI] [PubMed] [Google Scholar]
- 27. Sadamatsu K., Okutsu M., Sumitsuji S., et al., “Practical Utilization of Cardiac Computed Tomography for the Success in Complex Coronary Intervention,” Cardiovascular Intervention and Therapeutics 36 (2021): 178–189. [DOI] [PubMed] [Google Scholar]
- 28. Okutsu M., Mitomo S., Onishi H., et al., “The Estimation of Coronary Artery Calcium Thickness by Computed Tomography Angiography Based on Optical Coherence Tomography Measurements,” Heart and Vessels 38, no. 11 (2023): 1305–1317. [DOI] [PubMed] [Google Scholar]
- 29. Feldmann K., Cami E., and Safian R. D., “Planning Percutaneous Coronary Interventions Using Computed Tomography Angiography and Fractional Flow Reserve‐Derived From Computed Tomography: A State‐of‐the‐Art Review,” Catheterization and Cardiovascular Interventions 93, no. 2 (2019): 298–304. [DOI] [PubMed] [Google Scholar]
- 30. Bouisset F., Ohashi H., Andreini D., and Collet C., “Role of Coronary Computed Tomography Angiography to Optimise Percutaneous Coronary Intervention Outcomes,” Heart 110, no. 16 (2024): 1056–1062. [DOI] [PubMed] [Google Scholar]
- 31. Collet C., Sonck J., Leipsic J., et al., “Implementing Coronary Computed Tomography Angiography in the Catheterization Laboratory,” JACC: Cardiovascular Imaging 14, no. 9 (2021): 1846–1855. [DOI] [PubMed] [Google Scholar]
- 32. Sandoval Y., Leipsic J., Collet C., et al., “Coronary Computed Tomography Angiography to Guide Percutaneous Coronary Intervention: Expert Opinion From a SCAI/SCCT Roundtable,” Journal of Cardiovascular Computed Tomography 19, no. 3 (2025): 277–290. [DOI] [PubMed] [Google Scholar]
Associated Data
This section collects any data citations, data availability statements, or supplementary materials included in this article.
Supplementary Materials
Supplementary Figure 1: Association between cardiac CT morphology and the use of atherectomy devices. Supplementary Figure 2: Representative case example. Supplementary Table 1: Predictive performance of CT‐based atherectomy score.