

Abstract
Background
This study evaluated the effects of hydroxyapatite microtubes and chitosan composite scaffold (HMTs–CHS) on bone regeneration in rat calvarial critical-size defects (CSDs).
Methods
HMTs–CHS composites were fabricated through hydrothermal synthesis and atmospheric pressure sintering. The scaffolds were analyzed using SEM, XRD, and FTIR to verify their structural and chemical characteristics. In vitro studies assessed cell proliferation, cytotoxicity, and osteogenic differentiation using bone marrow mesenchymal stem cells (BMSCs). For in vivo evaluation, 24 rats with 8-mm critical-size calvarial defects were divided into three groups: blank, CHS, and HMTs–CHS. Bone regeneration was evaluated at 30 and 60 days using micro-CT and histological analysis.
Results
The HMTs–CHS scaffold exhibited a well-organized honeycomb-like structure with optimal pore size distribution (100–160 μm). The scaffold significantly enhanced BMSC proliferation and osteogenic differentiation, with increased EdU-positive cells, elevated ALP activity, and enhanced matrix mineralization. Osteogenic markers (RUNX2, COL1, OPN, OCN, BSP) were significantly upregulated in the HMTs–CHS group at both gene and protein levels. In vivo, the HMTs–CHS group showed superior bone regeneration with higher bone volume fraction (BV/TV: 14.07 ± 0.84% at 60 days, representing a − 44% relative improvement over the CHS group at 9.74 ± 1.36%) and better trabecular architecture (p < 0.05). Histological examination confirmed enhanced bone formation and maturation.
Conclusions
The HMTs–CHS composite significantly improved bone regeneration in CSDs compared to CHS alone or no treatment. These findings suggest HMTs–CHS could be a promising biomaterial for treating cranial bone defects, offering an alternative to traditional bone grafts.
Supplementary Information
The online version contains supplementary material available at 10.1186/s40001-025-03386-6.
Keywords: Hydroxyapatite microtubes, Critical-size defect, Bone regeneration, Composite scaffold
Introduction
While autologous bone grafting remains the clinical “gold standard” for bone regeneration, it is associated with significant limitations that restrict its clinical application. Limited bone supply and donor site morbidity represent the most critical disadvantages of autografting [1]. The harvesting procedure itself carries substantial risks, including chronic pain at the donor site (occurring in over 25% of patients), nerve injury, hematoma formation, infection, and potential fracture at the harvest site [2, 3]. Furthermore, procurement morbidity and constraints on obtainable bone quantities significantly limit the use of autografts, particularly for large cranial defects [4]. These inherent limitations have driven extensive research toward developing synthetic bone graft substitutes that can replicate the osteogenic, osteoinductive, and osteoconductive properties of autologous bone without the associated donor site complications.
In contrast to autografts, synthetic composite scaffolds combining hydroxyapatite (HA) and chitosan (CHS) offer distinct advantages by eliminating donor site morbidity while providing controlled degradation rates and enhanced osteogenic potential. HA, with its crystalline structure mimicking natural bone mineral, provides an ideal osteoconductive scaffold for cell attachment, proliferation, and new bone formation [5]. CHS is a naturally biodegradable polymer primarily produced through the deacetylation of chitin, one of the most abundant polysaccharides found in nature and extracted from the exoskeletons of crustaceans [6]. The synergistic combination of HA and CHS in scaffolds promotes mesenchymal stem cell differentiation into osteoblasts through HA's bioactive signals and CHS's supportive matrix structure [7, 8]. Recent studies have demonstrated that CHS/HA composites significantly promote bone regeneration in critical-size defects (CSDs) [9–11]. These biomimetic scaffolds can be fabricated with precise architectural control and optimal pore sizes for cell infiltration and vascularization while maintaining mechanical properties similar to natural bone that allow their use in load-bearing tissue engineering applications [12]. CHS acts as a stabilizer for hydroxyapatite nanoparticles, maintaining the electrostatic stability of the composite in slightly acidic environments, which is beneficial for long-term applications [13]. The controlled degradation rate of CHS/HA composites allows for the gradual release of incorporated drugs or growth factors, which can further enhance osteogenesis [14]. Moreover, the combination of CHS and HA in scaffolds significantly enhances biomineralization, as evidenced by the formation of a bone-like apatite layer on the scaffold surface after incubation in simulated body fluids [15]. In addition, CS/HA composite materials demonstrate antimicrobial effects on various bacteria types, inhibiting microbial attachment and biofilm development—a significant benefit for infection prevention in osseous implants [16]. This multifunctional approach creates a synergistic environment that supports new bone formation without the risks inherent to autograft harvesting.
Zhang and colleagues have developed a novel composite scaffold comprising ultralong HMTs and CHS in 2017 [17]. The HMT–CHS composite scaffold exhibits significantly improved mechanical properties compared to scaffolds made from CHS alone or CHS combined with HA nanorods [17]. The combination of HMT and CHS results in a composite material with enhanced mechanical properties, biocompatibility, and potential for various biomedical applications. This composite leverages the strengths of both components: the structural similarity of hydroxyapatite to bone mineral and the bioactivity and biodegradability of CHS. Similar to Zhang et al.'s approach [17], other researchers have explored the unique structural advantages of hydroxyapatite in tubular and nanowire forms for bone regeneration. Hou et al. [18] demonstrated that HMTs can form a "pipeline framework" structure within GelMA scaffolds, enhancing mechanical properties, breathability, and signal transmission for bone tissue regeneration. In addition, ultralong hydroxyapatite nanowires have shown promising results when combined with CHS or other polymers. Sun et al. [19] developed porous nanocomposites comprising ultralong hydroxyapatite nanowires decorated with zinc-containing nanoparticles and CHS, showing excellent bone repair capability in CSDs. Chen et al. [20] further advanced this field by creating biomimetically ordered ultralong hydroxyapatite nanowire-based hierarchical scaffolds with osteoimmunomodulatory properties, demonstrating superior bone defect regeneration through regulation of macrophage polarization. These studies collectively suggest that the elongated morphology of hydroxyapatite—whether in microtube or nanowire form—provides unique advantages for scaffold design and bone regeneration applications.
Building upon these studies shown above [17–20], the HMT–CHS composite scaffold has shown promising potential in tissue engineering. However, to date, no studies have systematically investigated its efficacy in promoting bone regeneration in cranial CSDs. While the composite's enhanced mechanical properties and biocompatibility have been established, its osteogenic potential in vivo, particularly in cranial bone repair, remains unexplored. The present study aims to address this knowledge gap by evaluating the capacity of HMT–CHS scaffolds to promote bone regeneration in rat calvarial CSDs. This investigation represents the first comprehensive assessment of HMT–CHS scaffolds in cranial bone repair, potentially offering a novel therapeutic strategy for treating cranial bone defects.
In this study, we conducted a comprehensive investigation of the HMTs–CHS composite scaffold's potential for bone regeneration through both in vitro and in vivo experiments. Scaffold physicochemical attributes were assessed through multiple analytical techniques, including SEM for morphological examination, XRD for crystalline structure analysis, and FTIR for molecular interaction evaluation. In vitro studies evaluated the scaffold's biocompatibility and osteogenic potential using bone marrow mesenchymal stem cells (BMSCs). Cell proliferation was assessed through CCK-8 and EdU assays, while cytotoxicity was evaluated using LDH release measurements. The osteogenic differentiation capacity was examined through ALP activity, matrix mineralization, and the expression of osteogenic markers at both gene and protein levels. Furthermore, we established a rat calvarial CSD model to evaluate the scaffold's bone regeneration capacity in vivo, utilizing micro-CT analysis and histological examination to assess new bone formation. This systematic approach allowed us to evaluate the potential of HMTs–CHS composite scaffolds as a promising biomaterial for bone tissue engineering applications, particularly in the treatment of cranial bone defects.
Materials and methods
Synthesis of HMTs
HMTs were prepared using a modified hydrothermal method (12). Initially, deionized water (4.5 mL), ethanol (8.5 mL), and oleic acid (7 mL) were combined in a polytetrafluoroethylene reactor and stirred for 10 min using a magnetic stirrer. Aqueous solutions of CaCl2 (0.2200 g in 10 mL H2O), NaOH (0.600 g in 10 mL H2O), and (NaPO3)6 (0.2377 g in 10 mL H2O) were then added dropwise to the stirring mixture. The prepared mixture underwent thermal processing in a TR 30 oven (Germany) at 180 °C for 25 h within a sealed stainless steel pressure vessel. Following natural cooling to ambient temperature, the resultant material was harvested and subjected to comprehensive purification using sequential ethanol and deionized water wash cycles. The washed hydroxyapatite microtube sample was placed in a culture dish and freeze-dried (SCIENTZ-12N) for 48 h until a white powdery substance was obtained, indicating the successful formation of HMTs.
Synthesis of CHS
To prepare the CHS solution, 2 g of CHS powder (CAS: 9012-76-4, Shanghai Aladdin Bio-Chem Technology Co., LTD, Shanghai, China) was added to 98 mL of 1% acetic acid solution. The mixture was stirred at room temperature for 12 h to obtain a CHS solution with a solid content of 2%. The solution was then transferred to a mold and frozen at − 20 °C overnight. Subsequently, the frozen sample was subjected to a 48 h freeze-drying process. Prior to use, the sample was sterilized under ultraviolet light in a clean bench for 2 h [21].
Synthesis of HMTs–CHS
Initially, a dilute CHS solution (0.5% solid content) was formulated. This base medium was enriched with HMTs to establish a 6.5 wt% concentration relative to the solvent mass. After 12 h of constant agitation produced a homogeneous white suspension, the material was transferred to cylindrical alumina molds (10 mm internal diameter) and subjected to a freezing protocol (−20 °C for 4 h). Following lyophilization for 48 h, the specimens underwent thermal processing in a Cameo AGT-3 rapid sintering unit (China) using a precisely controlled three-stage sintering protocol [17].
The sintering program consisted of: (1) a heating phase with a controlled temperature ramp rate of 10 °C/minute from room temperature (approximately 25 °C) to 1300 °C, resulting in a total heating time of approximately 127.5 min; (2) a soaking phase at 1300 °C for 2 h under atmospheric conditions to ensure complete densification and phase transformation; and (3) a cooling phase with natural cooling to room temperature at an average rate of approximately 5 °C/minute. The total sintering cycle time was approximately 6.5 h.
In this fabrication strategy, CHS serves as a processing aid rather than a final component of the scaffold. During freeze–drying, the CHS matrix acts as a binder that maintains the spatial arrangement of HMTs and provides the template for creating the hierarchical porous architecture. The heating rate of 10 °C/minute was selected to allow gradual thermal decomposition of the organic components, minimizing thermal stress and preventing crack formation while preserving the templated porous structure. During the sintering process at 1300 °C under atmospheric conditions, the CHS undergoes complete thermal decomposition and oxidative removal, leaving behind a porous calcium phosphate ceramic scaffold.
This high sintering temperature was selected specifically to optimize the hydroxyapatite component. Temperatures above 1200 °C are necessary to achieve sufficient densification of hydroxyapatite, improving mechanical strength through enhanced particle bonding and grain growth. The 2 h soaking time at 1300 °C was optimized to achieve adequate densification of hydroxyapatite and phase transformation (as confirmed by XRD analysis) without excessive grain growth that could compromise the porous structure. The sintered ceramic structure achieves mechanical properties suitable for bone tissue engineering applications, which would not be possible with lower temperature processing that might retain organic content but would compromise structural integrity.
Materials characterization
Comprehensive material characterization employed multiple analytical methods to examine HMTs, CHS, and their composite. Morphological assessment utilized Hitachi TM-3000 electron microscopy operated at 15 kV (10 mm working distance). Crystallographic properties were investigated via Rigaku SmartLab SE diffractometer with copper radiation (λ = 1.5406 Å), scanning between 10° and 80° (2θ) at 0.02° increments and 2°/min velocity. Molecular composition analysis was conducted using Thermo Fisher Nicolet iS20 spectroscopy spanning 400–4000 cm⁻1 wavenumbers with 4 cm⁻1 resolution (32 measurement cycles per specimen). Supplementary nanoscale structural visualization of HMTs employed Hitachi HT7800 TEM (transmission electron microscopy) (200 kV acceleration voltage) using carbon-coated copper specimen supports [22].
Isolation, culture and characterization of BMSCs
BMSCs were isolated from 10- to 12 day-old Sprague–Dawley rats following established protocols [23]. Bone marrow cell isolation and culture were performed using the following protocol: bone marrow was extracted from rat femurs and tibias using DMEM/F12 medium supplemented with 10% fetal bovine serum and 1% penicillin–streptomycin. The cell suspension was processed through a 70 μm cell strainer and centrifuged at 1000 rpm for 5 min. Cell pellets were resuspended in complete culture medium and seeded into 75 cm2 culture flasks. After 24 h, non-adherent cells were removed by medium replacement. Adherent cells were maintained at 37 °C in a humidified 5% CO2 atmosphere, with media refreshed every 3 days. Upon reaching 80–90% confluence, cells were passaged using 0.25% trypsin–EDTA, with passages 3–5 selected for subsequent experimental procedures.
To induce osteogenic differentiation, BMSCs were cultured in a specialized medium composed of basal culture medium enriched with 10 mM β-glycerophosphate, 50 μg/mL ascorbic acid, and 10⁻⁷ M dexamethasone. Culture media were replenished tri-weekly, and osteogenic progression was evaluated through Alizarin Red S staining at 14 and 21 days to quantify calcium mineralization. For adipogenic differentiation, BMSCs were exposed to an induction medium containing basal medium supplemented with 0.5 mM isobutylmethylxanthine, 1 μM dexamethasone, 10 μg/mL insulin, and 100 μM indomethacin. Media were replaced every 3 days, and lipid accumulation was assessed via Oil Red O staining after 14 days to visualize adipogenic transformation.
Bone marrow mesenchymal stem cell (BMSC) phenotyping was conducted through immunophenotypic characterization via multiparameter flow cytometry. Cellular surface marker expression was evaluated using fluorescently labeled monoclonal antibodies. Specifically, potential mesenchymal stem cell markers were assessed, including CD29, CD73, and CD90 as positive indicators, while CD14, CD34, and CD45 served as exclusion markers.
CCK-8 assay
The Cell Counting Kit-8 (CCK-8; MCE, China) was used to perform the CCK-8 assay [24]. Scaffold materials measuring 5 × 5 mm were positioned at the base of 96-well culture plates and categorized into three groups: blank control group (BMSCs cultured directly on tissue culture plastic without any scaffold materials), CHS group and HMTs–CHS group. Each group had 3 samples. BMSCs at passage 3 were seeded into the 96-well plates. After a duration of 24 h, the culture medium along with non-adherent cells was discarded. The culture medium was then replaced and cultivation continued. This process was documented as day 0 for the CCK-8 evaluation, which was used to assess cell viability and proliferation on different substrates after incubation periods of 1, 3, and 7d. The optical density (OD) value for each group was determined using an enzyme microscope at a wavelength of 450 nm.
EDU cell proliferation assay
Cell proliferation dynamics were assessed through a comprehensive 5-ethynyl-2′-deoxyuridine (EdU) incorporation proliferation assay [25]. BMSCs were strategically distributed across varied culture conditions (blank control: cells cultured directly on tissue culture plastic without scaffolds, CHS: cells cultured on CHS scaffolds, and HMTs–CHS: cells cultured on HMTs–CHS composite scaffolds) in 24-well culture plates, maintaining a consistent cellular seeding density of 2 × 10⁴ cells per well. The proliferative potential was systematically examined at multiple timepoints: days 1, 3, 5, and 7. During each assessment interval, cells underwent a targeted EdU labeling protocol, involving a 2 h incubation with 50 μM EdU solution at 37 °C. Subsequently, cells were processed through a standardized fixation and permeabilization sequence: initial 4% paraformaldehyde fixation followed by 0.5% Triton X-100 permeabilization. Utilizing the Cell-Light™ EdU Apollo® 488 In Vitro Imaging Kit, cellular proliferation was visualized through precise fluorescent staining. DAPI was employed for nuclear counterstaining, enabling comprehensive cellular visualization. Fluorescence microscopy captured representative images, with EdU-positive cell quantification performed across five randomly selected microscopic fields per experimental condition. Proliferation rates were mathematically derived by calculating the proportion of EdU-positive cells relative to the total DAPI-stained cellular population, providing a quantitative measure of cellular replication potential.
Alkaline phosphatase (ALP) staining
Osteogenic differentiation of BMSCs was evaluated using ALP staining across Blank control (cells cultured on tissue culture plastic without scaffolds), CHS, and HMTs–CHS scaffolds at 7, 14, and 21 days. Cells were cultured in osteogenic medium supplemented with β-glycerophosphate, ascorbic acid, and dexamethasone in 24-well plates. At designated timepoints, cells underwent fixation with 4% paraformaldehyde and were washed with PBS. ALP enzymatic activity was detected using the BCIP/NBT ALP Color Development Kit. Stained samples were examined under a light microscope, with blue–violet staining intensity indicating ALP activity levels [26, 27].
Alizarin red S staining
Matrix mineralization of BMSCs was evaluated using Alizarin Red S staining [28, 29] on Blank control (cells cultured on tissue culture plastic without scaffolds), CHS, and HMTs–CHS scaffolds at 14 and 21 days. Cells were cultured in osteogenic medium and subsequently fixed with 4% paraformaldehyde. Following careful washing with distilled water, samples were stained with 2% Alizarin Red S solution (pH 4.2) for 15 min. After thorough dye removal, calcium deposits were visualized and documented under light microscopy. Intense red staining signified extracellular matrix mineralization.
LDH cytotoxicity assay
Scaffold cytotoxicity was assessed through lactate dehydrogenase (LDH) release measurement using a commercial cytotoxicity assay kit [30]. BMSCs were cultured on Blank control (cells cultured on tissue culture plastic without scaffolds), CHS, and HMTs–CHS scaffolds in 24-well plates. Culture supernatants were collected at 1, 3, 5, and 7 days, centrifuged, and processed according to the kit's protocol. LDH enzymatic activity was quantified spectrophotometrically at 490 nm, with results expressed in units per liter.
Quantitative real-time PCR analysis
RNA was isolated from BMSCs cultured on various scaffolds using TRIzol reagent, with concentration and quality assessed spectrophotometrically. cDNA synthesis was performed following standard reverse transcription protocols. Quantitative real-time PCR was conducted using SYBR Green chemistry, targeting osteogenic genes RUNX2, COL1, OPN, OCN, and BSP, with GAPDH serving as the normalization control. Gene expression was quantified utilizing the 2–ΔΔCt comparative method [31].
Western blot analysis
Protein extraction from BMSCs was performed using RIPA lysis buffer supplemented with protease inhibitors. Protein quantification was conducted via BCA assay, with 30 μg samples separated through SDS–PAGE and transferred to PVDF membranes. Immunoblotting involved milk-based membrane blocking, followed by overnight incubation with primary antibodies against osteogenic markers and GAPDH at 4 °C. After secondary antibody treatment, protein visualization was achieved using chemiluminescence, with band quantification performed through ImageJ software and normalized to GAPDH [32].
Animal ethics and housing conditions
Ethical approval for the study was obtained from the Changzhi Medical College Laboratory Animal Center (Permit Number: DW2022083) and the Universiti Sains Malaysia Institutional Animal Care and Use Committee. Experimental procedures adhered to the Guide for the Care and Use of Laboratory Animals. The research utilized 24 male Sprague Dawley rats (5 months, 230–350 g) and one juvenile rat (10–12 days) for bone marrow mesenchymal stem cell isolation. Rats were maintained under controlled environmental conditions (20–26 °C, 40–70% humidity) with unrestricted access to standard diet and water. Sample size calculation was based on the 3R principles (replacement, reduction, and refinement) of animal experimentation as described by Russell and Burch [33]. Sample size was calculated using G*Power statistical software (α = 0.05, power = 0.8), ensuring the minimum number of animals necessary for statistically robust results.
Surgical procedure and experimental design
A total of 25 male Sprague Dawley rats were used in this study, including one 10–12 day-old rat for BMSCs isolation and 24 rats for the critical-size calvarial defect model. The 24 rats were randomly divided into three experimental groups (n = 8 per group): (1) blank control group (BG group): critical-size calvarial defects left empty without any scaffold implantation; (2) CHS group: defects filled with CHS scaffold; and (3) HMTs–CHS group: defects filled with HMTs–CHS composite scaffold. Each group was further subdivided for analysis at two timepoints (n = 4 per group per timepoint): 30- and 60 day post-surgery.
Rats were anesthetized via intraperitoneal injection of ketamine (90 mg/kg) and xylazine (5 mg/kg), with body weight recorded. The skull surgical site was sterilized using compound iodine, and local anesthesia was administered through subcutaneous lidocaine injection [34]. A midline sagittal incision exposed the parietal region, with skin and periosteum carefully retracted. Using a trephine under sterile saline irrigation, an 8-mm diameter cranial defect was precisely created. This specific defect size was selected based on prior studies demonstrating spontaneous non-healing in rat calvaria [35].
UV-sterilized scaffold materials (8 mm diameter) were implanted into defect sites for treatment groups, while the blank group defects remained unaltered. Wounds were meticulously sutured, with animals individually housed and marked. At 30- and 60 day post-surgery, rats underwent humane euthanasia following AVMA guidelines via carbon dioxide inhalation. Respiratory and cardiac cessation were confirmed, with cervical dislocation performed as a secondary verification method. Skulls were subsequently harvested, fixed in 4% formaldehyde for 48 h, and prepared for micro-CT bone regeneration analysis.
Micro-CT analysis
Calvarial defect bone regeneration was assessed through high-resolution micro-computed tomography at 30- and 60-day post-surgery using a Skyscan 1176 micro-CT system. Image acquisition parameters included 55 kV voltage, 200 μA current, 40 ms exposure, and 0.3° rotational increments with an aluminum filter. Scan reconstruction was performed utilizing NRecon software, enabling comprehensive three-dimensional visualization of bone healing progression.
The 8 mm diameter defect was selected as the CSD model for this study based on well-established criteria in bone regeneration research. A CSD is defined as the smallest intraosseous wound that will not heal spontaneously during the lifetime of the animal or within the study period [36]. The 8 mm calvarial defect in adult rats has been extensively validated and is widely accepted as the standard CSD model for evaluating bone regenerative therapies and biomaterials [37]. This defect size ensures that any observed bone regeneration can be attributed to the therapeutic intervention rather than spontaneous healing, providing a stringent and clinically relevant testing environment. Furthermore, the rat calvarial CSD model offers several advantages, including reproducibility, minimal surgical morbidity, a non-load-bearing orthotopic site that mimics clinical craniofacial bone defects, and the ability to create bilateral defects for direct comparison of treatments [38]. The region of interest (ROI) for analysis was defined as a cylindrical volume corresponding to the original 8-mm diameter defect area. This standardized ROI was used consistently across all samples and timepoints to ensure comprehensive evaluation of new bone formation throughout the healing process. In the blank group (empty defects), the measured radiopacity directly represented the volume of newly formed bone tissue (BV). However, for defects filled with CHS or HMTs–CHS scaffolds, the measured radiopacity represented the combined signal from both the scaffold material and newly formed bone tissue, as their gray levels were similar [39]. Precise differentiation between scaffold and newly formed bone tissue was achieved by establishing a grayscale threshold calibration using pre-implantation scaffold reference scans.
Bone regeneration was quantitatively assessed through multiple morphometric parameters [40]. Volume-based metrics included tissue volume (TV), bone volume (BV), and bone volume percentage (BV/TV). Surface-related analyses encompassed total tissue surface (TS), bone surface (BS), specific bone surface (BS/BV), and bone surface density (BS/TV). Trabecular microarchitecture was evaluated by measuring trabecular thickness (Tb.Th), number (Tb.N), and separation (Tb.Sp). These comprehensive parameters provided insights into both the quantity and structural quality of newly formed bone within the defect sites.
Histological analysis
Following micro-CT analysis, skull specimens were fixed in 10% neutral formaldehyde fixative for 48 h. The 10% neutral formaldehyde fixative was prepared by adding 4.4 g sodium dihydrogen phosphate and 25.9 g disodium hydrogen phosphate to 900 ml ultrapure water, stirring until completely dissolved, then adding 100 ml formaldehyde solution and mixing well.
After fixation, specimens underwent decalcification in 15% EDTA solution for 4 weeks, with solution replacement every 3 days. The 15% EDTA decalcification solution was prepared by dissolving 300 g EDTA-2Na and 45 g Tris in ultrapure water to a final volume of 2000 ml. Following complete decalcification, specimens were progressively dehydrated through graded ethanol series (70%, 80%, 90%, 95%, and 100%), cleared with xylene, and embedded in paraffin wax [41].
Coronal Sections (5 μm thick) were prepared using a microtome, with three sections per defect sampled to ensure comprehensive bone regeneration assessment. Standard hematoxylin and eosin (H&E) staining was performed, involving deparaffinization, rehydration, hematoxylin and eosin staining, and mounting. Histological analysis was conducted using a digital light microscope, enabling detailed examination of bone regeneration across the defect site.
Statistical analysis
The collected in vitro experimental data were processed and analyzed using GraphPad Prism software (v9.0). The results are expressed as the mean ± standard deviation (SD). Statistical analyses of cell proliferation, EdU-positive cell rates, LDH activity, ALP activity, calcium deposition, and gene/protein expression levels were performed using two-way ANOVA, with time and treatment as variables, followed by Tukey's post-hoc test for multiple comparisons. For the in vivo studies, micro-CT quantitative data were statistically analyzed using IBM SPSS Statistics (v24.0). Differences between groups were assessed using one-way ANOVA with Bonferroni post-hoc test. Statistical significance was set at p < 0.05 for all analyses.
Results
Morphological and structural characterization of HMTs, CHS, and HMTs–CHS composites
The microstructure and morphology of HMTs were investigated using SEM and TEM, as shown in Fig. 1A–D. The SEM micrographs revealed well-dispersed HMTs with distinct tubular structures at both ends (Fig. 1A, B). TEM analysis confirmed that these tubular structures extended throughout the entire length of each microtube (Fig. 1C, D). Morphometric analysis showed that the HMTs had an average length of 25 ± 4.8 µm and an average width of 1 ± 0.3 µm, resulting in an aspect ratio of approximately 25.
Fig. 1.

Comprehensive morphological and structural characterization of HMTs, CHS, and HMTs–CHS materials. A, B SEM micrographs showing the overall distribution and detailed structure of HMTs with scale bars of 10 μm and 2 μm, respectively; (C, D) TEM micrographs demonstrating the hollow tubular structure of HMTs with scale bars of 10 μm and 1 μm, respectively; (E–G) pure CHS scaffold at different magnifications (scale bars: 500 μm, 200 μm, and 50 μm) demonstrating irregular pore distribution with thin walls; (H–J) HMTs–CHS composite scaffold at different magnifications (scale bars: 500 μm, 200 μm, and 50 μm) showing uniform pore distribution with sizes ranging from 30 to 200 μm, and evenly dispersed HMTs stacked within the CHS matrix forming a network structure; (K) XRD patterns of HMTs, CHS, and HMTs–CHS scaffolds showing their crystalline characteristics. The HMTs demonstrate sharp, symmetrical diffraction peaks indicating high crystallinity, while the CHS shows diffuse peaks near 2θ = 20°. The HMTs–CHS composite exhibits a mixed crystalline phase combining characteristics of both materials. The X-axis represents the diffraction angle (2θ) in degrees, and the Y-axis shows the diffraction intensity in arbitrary units (a.u.). Black dots indicate the characteristic diffraction peaks; (L) FTIR spectra of HMTs, CHS, and HMTs–CHS scaffolds demonstrating their chemical composition and molecular interactions. The X-axis represents the wavenumber (cm⁻1), indicating the frequency of molecular vibrations, and the Y-axis shows the transmittance (%) representing the proportion of radiation transmitted through the sample. Key absorption peaks are labeled with their corresponding wavenumbers, and dashed lines indicate the alignment of significant peaks across different samples
The pure CHS scaffold exhibited a highly porous structure with non-uniform pore distribution, as shown in Fig. 1E–G. These pores formed an interconnected network throughout the scaffold, with pore diameters varying from tens to hundreds of micrometers. The scaffold walls appeared thin and delicate, indicating the inherent porosity of the CHS material. In contrast, the HMTs–CHS composite scaffold demonstrated more organized structural features (Fig. 1H–J). The scaffold displayed a uniform honeycomb-like architecture with pore sizes ranging from 30 to 200 μm, predominantly between 100 and 160 μm. Higher magnification images revealed that HMTs were evenly dispersed and well-integrated within the CHS matrix, forming an interconnected three-dimensional network structure. Notably, the tubular structure of HMTs was preserved throughout the composite scaffold, suggesting successful incorporation of HMTs into the CHS matrix without structural deterioration.
The crystalline characteristics of the materials were analyzed using XRD (Fig. 1K). The CHS pattern exhibited diffuse diffraction peaks with a characteristic broad peak near 2θ = 20°, consistent with its semi-crystalline or amorphous structure. In contrast, HMTs displayed sharp, symmetrical diffraction peaks matching the standard hydroxyapatite pattern, with no impurity peaks and low background noise, indicating high crystallinity and purity of the sample. The XRD pattern of the HMTs–CHS composite scaffold revealed a mixed crystalline phase containing both hydroxyapatite and tricalcium phosphate, suggesting partial phase transformation of hydroxyapatite during the sintering process. While the characteristic sharp peaks of hydroxyapatite were prominent in the composite, the broad peak of CHS near 2θ = 20° was not clearly visible due to the overlapping diffraction patterns and the relatively low intensity of tricalcium phosphate peaks.
The chemical composition and molecular interactions of the materials were characterized using FTIR spectroscopy (Fig. 1L). In the HMTs spectrum, characteristic OH stretching vibrations were observed at 3571 cm⁻1 and 2924 cm⁻1, with the latter peak primarily attributed to hydrogen bonds in water molecules and hydroxyl groups. Multiple peaks characteristic of phosphate groups (P–O vibrations) were identified at 470 cm⁻1, 560 cm⁻1, 602 cm⁻1, 961 cm⁻1, 1024 cm⁻1, and 1096 cm⁻1. The CHS spectrum revealed several characteristic peaks: the amino functional group at 3419 cm⁻1, C–H stretching vibration of methyl and methylene groups in the sugar ring structure at 2874 cm⁻1, and C = O stretching vibration at 1647 cm⁻1 indicating the material's crystallinity and degree of deacetylation. Additional peaks included the amino group (-NH₂) and amide bond (-CONH-) at 1594 cm⁻1, acetic acid-derived vibrations at 1417 cm⁻1, and C–O–C stretching vibrations of the glycosidic bonds at 1109 cm⁻1 and 1132 cm⁻1. Analysis of the HMTs–CHS composite scaffold showed enhanced intensity of peaks at 3419 cm⁻1, 2924 cm⁻1, 2874 cm⁻1, and 1594 cm⁻1 compared to HMTs while maintaining the distinctive phosphate peak at 1024 cm⁻1. These spectral characteristics confirmed the successful preparation of the HMTs–CHS composite.
Characterization of rat BMSCs
BMSCs were characterized through morphological observation, differentiation potential assessment, and surface marker analysis (Fig. 2). Phase contrast microscopy of passage 3 BMSCs revealed homogeneous, spindle-shaped cells arranged in a characteristic whirlpool pattern (Fig. 2A). The multipotent differentiation capacity of BMSCs was confirmed by their ability to differentiate into adipogenic and osteogenic lineages. After adipogenic induction, Oil Red "O" staining demonstrated the presence of red-stained lipid droplets within the cells (Fig. 2B). Similarly, Alizarin Red S staining revealed the formation of mineralized nodules following osteogenic induction (Fig. 2C). Flow cytometric analysis of cell surface markers confirmed the typical BMSC immunophenotype (Fig. 2D). The cells showed high expression levels (> 95%) of positive mesenchymal markers, including CD29 (99.3%), CD73 (97.2%), and CD90 (99.5%). Conversely, the cells exhibited minimal expression (< 2%) of hematopoietic markers CD14 (1.1%), CD34 (1.1%), and CD45 (1.2%), consistent with the standard criteria for BMSC identification.
Fig. 2.

Characterization of SD rat BMSCs. A Phase contrast microscopy of P3 BMSCs showing typical spindle-shaped morphology and whirlpool-like arrangement; (B) oil red “O” staining demonstrating adipogenic differentiation potential with red-stained lipid droplets; (C) Alizarin Red S staining showing osteogenic differentiation potential with mineralized nodule formation; (D) flow cytometry analysis of surface markers CD14, CD29, CD34, CD45, CD73, and CD90, confirming the characteristic BMSC immunophenotype with specific expression percentages indicated in each panel
Cell viability and proliferation analysis
As shown in Fig. 3A, both HMTs–CHS and CHS scaffolds demonstrated good biocompatibility and promoted cell growth. During the initial culture period (days 1–3), both groups showed similar proliferation patterns with relatively moderate growth rates. By day 5, the HMTs–CHS group exhibited significantly higher cell viability compared to the CHS group. Cell proliferation rates stabilized in both groups by day 7, with the HMTs–CHS group maintaining higher cell viability compared to the CHS group.
Fig. 3.

Cell viability and proliferation analysis of BMSCs on different scaffolds. A Cell viability evaluated by CCK-8 assay over 7 days of culture. The Y-axis represents cell viability as a percentage of the control group (100%), and the X-axis shows the culture time in days. Data are presented as mean ± SD. B Quantitative analysis of BMSC proliferation rate by EdU staining. Data are presented as mean ± SD (n = 5). ns: not significant; *p < 0.05; ***p < 0.001. C, D Representative fluorescence images of EdU staining at different timepoints (1d, 3 d, 5 d, and 7 d). EdU-positive cells (green) indicate proliferating cells, cell nuclei were counterstained with DAPI (blue), and merged images show the overlay of EdU and DAPI signals. Both HMTs–CHS and CHS groups promoted cell growth, with HMTs–CHS showing superior proliferation-promoting effects across all timepoints
The proliferation of BMSCs on different scaffolds was quantitatively assessed using EdU staining (Fig. 3B–D). At day 1, while there was no significant difference between the Blank and CHS groups (ns) or between CHS and HMTs–CHS groups (ns), the HMTs–CHS group showed significantly higher proliferation compared to the Blank group (*p < 0.05). By day 3, both CHS and HMTs–CHS groups demonstrated significantly higher EdU-positive cell rates compared to the Blank group (*p < 0.05), though no significant difference was observed between CHS and HMTs–CHS groups. At day 5, the CHS group showed significantly higher proliferation than the Blank group (***p < 0.001), and the HMTs–CHS group exhibited significantly higher rates than both the CHS group (*p < 0.05) and Blank group (***p < 0.001). This trend became more pronounced at day 7, where highly significant differences (***p < 0.001) were observed between all groups, with HMTs–CHS showing the highest proliferation rate, followed by CHS, and the Blank group showing the lowest rate. The fluorescence images clearly showed a progressive increase in EdU-positive cells (green) over time, with the HMTs–CHS group consistently showing the highest number of proliferating cells across all timepoints. Cell nuclei were counterstained with DAPI (blue), and merged images showed the overlay of EdU and DAPI signals, confirming the superior proliferation-promoting effects of the HMTs–CHS scaffold.
Cytotoxicity assessment by LDH release
The cytotoxicity of different scaffolds was evaluated by measuring LDH release from BMSCs over a 7-day period (Fig. 4). At day 1, both CHS and HMTs–CHS groups showed significantly higher LDH activity compared to the Blank group (***p < 0.001), with the CHS group exhibiting the highest LDH release, while HMTs–CHS group showed significantly lower LDH levels than CHS group (***p < 0.001). By day 3, while the CHS group maintained significantly elevated LDH levels compared to both Blank and HMTs–CHS groups (***p < 0.001), there was no significant difference between HMTs–CHS and Blank groups. By days 5 and 7, LDH levels had decreased and stabilized across all groups, with no significant differences observed between any of the experimental groups (ns). This trend suggests an initial adaptive response of cells to the scaffold materials, followed by stabilization and improved cell compatibility over time. The reduction in LDH release to levels comparable with the Blank group indicates good biocompatibility of both CHS and HMTs–CHS scaffolds after the initial contact period.
Fig. 4.

Cytotoxicity assessment of different scaffolds by LDH release assay. The LDH activity in culture supernatant was measured at 1, 3, 5, and 7 days. The Y-axis represents LDH activity (U/L), and the X-axis shows the culture time in days. Data are presented as mean ± SD. Statistical significance: ns = not significant; *p < 0.05; **p < 0.01. Higher LDH activity indicates greater cytotoxicity. Both CHS and HMTs–CHS groups showed initially elevated LDH levels at day 1, which gradually decreased and stabilized to levels comparable to the blank control by day 7, suggesting good biocompatibility after the initial adaptation period
Osteogenic differentiation assessment by ALP and Alizarin Red S staining
The osteogenic differentiation potential of BMSCs on different scaffolds was evaluated using ALP staining (Fig. 5A). At day 7, all groups showed minimal ALP activity, with the HMTs–CHS group displaying slightly more intense staining compared to the CHS and blank control groups. By day 14, there was a notable increase in ALP activity across all groups, with both CHS and HMTs–CHS groups exhibiting more intense blue–violet staining compared to the blank control. The HMTs–CHS group showed the most pronounced ALP activity, suggesting enhanced osteogenic differentiation. At day 21, the difference in ALP staining intensity became more prominent. The HMTs–CHS group demonstrated the strongest ALP activity, characterized by extensive and intense blue–violet staining throughout the culture area. The CHS group also showed increased ALP activity compared to the blank control, but to a lesser extent than the HMTs–CHS group. This progressive increase in ALP expression over time, particularly in the HMTs–CHS group, indicates that the composite scaffold effectively promotes osteogenic differentiation of BMSCs.
Fig. 5.

Osteogenic differentiation analysis of BMSCs on different scaffolds. A ALP staining of BMSCs cultured on different scaffolds (blank control, CHS, and HMTs–CHS) at 7, 14, and 21 days. Blue–violet staining indicates ALP activity, showing progressive increase in intensity with the HMTs–CHS group demonstrating the strongest staining. B Alizarin Red S staining of BMSCs cultured on different scaffolds at 14 and 21 days. Red staining indicates calcium deposition in the extracellular matrix, with the HMTs–CHS group showing the most extensive mineralization, particularly at day 21. Both assays demonstrate enhanced osteogenic differentiation in the HMTs–CHS group compared to CHS and blank control groups
The extent of matrix mineralization on different scaffolds was evaluated using Alizarin Red S staining (Fig. 5B). At day 14, all groups showed evidence of calcium deposition, with varying degrees of intensity. The HMTs–CHS group exhibited more intense red staining and larger mineralized nodules compared to both the CHS and blank control groups, indicating enhanced calcium deposition. The CHS group showed moderate mineralization, while the blank control group displayed minimal calcium deposits. By day 21, the differences in mineralization became more pronounced. The HMTs–CHS group demonstrated extensive mineralization characterized by intense red staining throughout the culture area and the formation of large mineralized nodules. The CHS group also showed increased mineralization compared to day 14, but to a lesser extent than the HMTs–CHS group. The blank control group exhibited the least mineralization, though showing some increase from day 14. These results suggest that the HMTs–CHS composite scaffold significantly enhances matrix mineralization during osteogenic differentiation of BMSCs.
mRNA and protein expression analysis of early and late osteogenic marker genes
The qRT-PCR analysis revealed significantly increased expression of osteogenic marker genes in both CHS and HMTs–CHS groups compared to the control group (Fig. 6A). RUNX2 expression was significantly higher in both CHS (**p < 0.01) and HMTs–CHS (**p < 0.01) groups compared to the control, with HMTs–CHS showing higher expression than CHS (*p < 0.05). COL1 showed marked upregulation in the HMTs–CHS group (***p < 0.001) compared to both control and CHS groups, with CHS also showing significant increase compared to control (*p < 0.05). Similar patterns were observed for OPN, where both experimental groups showed significant upregulation compared to control (*p < 0.05, **p < 0.01), with HMTs–CHS demonstrating higher expression than CHS (*p < 0.05). For OCN, both groups showed significant increases compared to control (**p < 0.01), with HMTs–CHS exhibiting the highest expression (****p < 0.0001 vs. control, **p < 0.01 vs. CHS). BSP expression followed a similar trend, with significant upregulation in both CHS and HMTs–CHS groups compared to control (**p < 0.01, ***p < 0.001), and HMTs–CHS showing higher expression than CHS (*p < 0.05).
Fig. 6.

Expression of osteogenic markers in BMSCs cultured on different scaffolds. A qRT-PCR analysis of RUNX2, COL1, OPN, OCN, and BSP gene expression. B Western blot analysis of osteogenic proteins. C Quantification of protein expression levels normalized to GAPDH. Data are presented as mean ± SD. *p < 0.05, **p < 0.01, ***p < 0.001, ****p < 0.0001
Western blot analysis revealed significant changes in the expression of both early and late osteogenic markers (Fig. 6B, C, Supplementary file Figs. S1–S7). The early osteogenic markers RUNX2 and COL1 showed progressive increases across the groups. Compared to the Blank Control group, the CHS group demonstrated significantly increased expression of both RUNX2 and COL1 (*p < 0.05). The HMTs–CHS group showed further enhanced expression of these markers, with significantly higher levels compared to both the Blank Control (*p < 0.05) and CHS groups (#p < 0.05). For the late osteogenic markers, a similar trend was observed. The expression levels of OPN, OCN, and BSP were significantly upregulated in the CHS group compared to the Blank Control (*p < 0.05). The HMTs–CHS group exhibited the highest expression levels of all three proteins, showing significant increases compared to both the Blank Control (*p < 0.05) and CHS groups (#p < 0.05). Specifically, OPN levels increased approximately 1.8-fold, OCN levels increased about twofold, and BSP levels increased approximately 1.6-fold in the HMTs–CHS group compared to the Blank Control.
Micro-CT analysis of bone regeneration
Bone regeneration within the calvarial CSDs was evaluated using micro-CT at 30- and 60 day post-surgery (Fig. 7). The pattern of new bone formation in all groups progressed from the defect periphery toward the center. The blank group showed minimal bone regeneration, limited primarily to the defect margins, indicating that these CSDs could not heal spontaneously. In contrast, both CHS and HMTs–CHS groups demonstrated new bone formation in the central region of the defects, with the HMTs–CHS group exhibiting more extensive bone coverage.
Fig. 7.
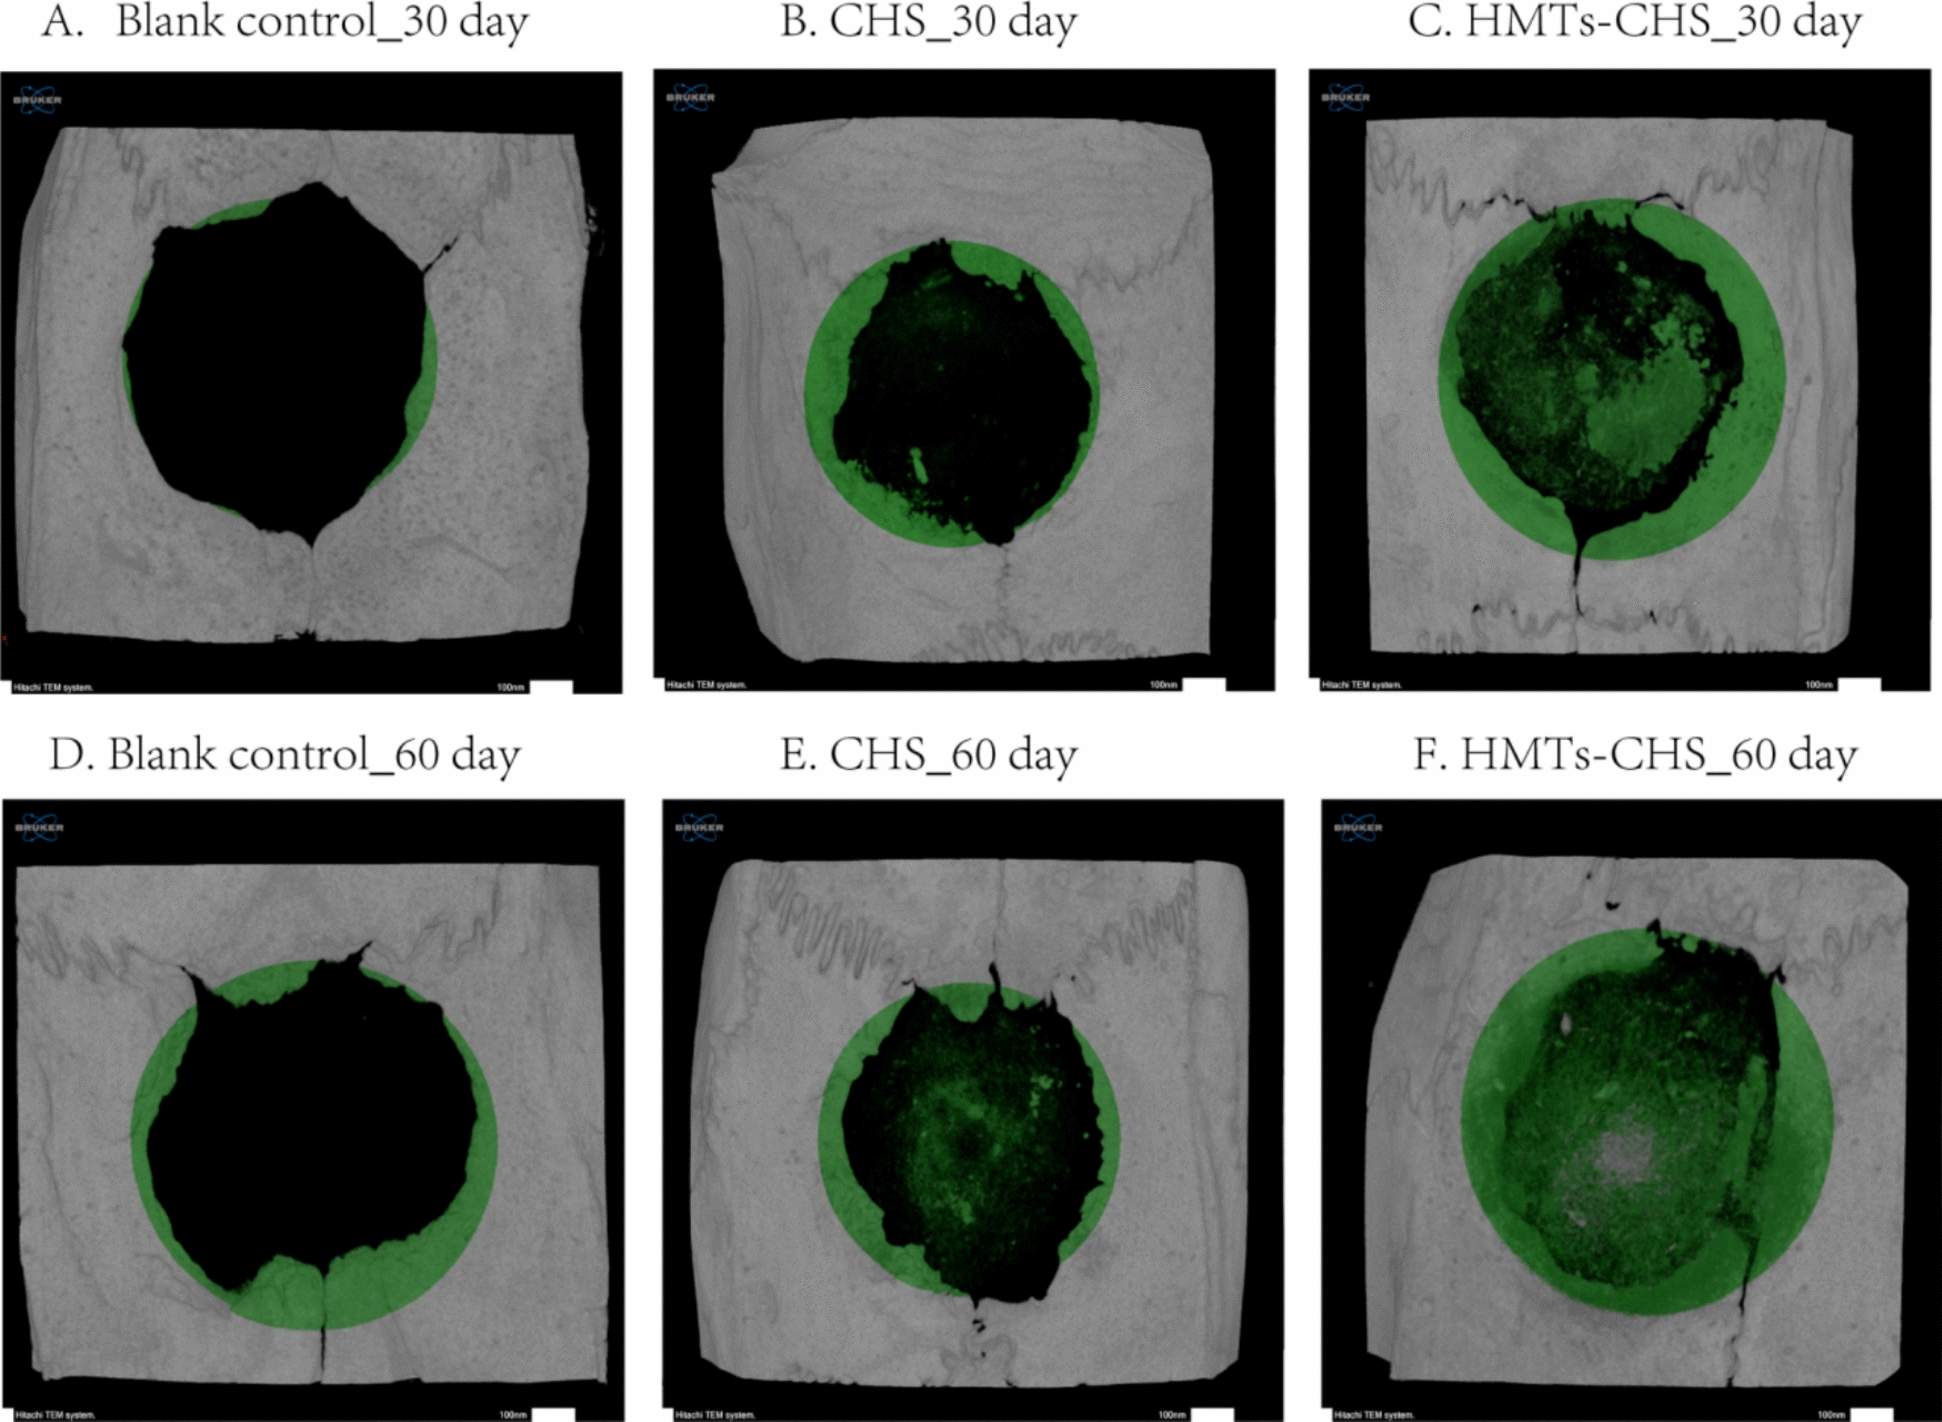
Micro-CT analysis of bone regeneration in rat calvarial CSDs. A–C Representative images at 30-day post-surgery and (D–F) at 60 day post-surgery for Blank Group, CHS group, and HMTs–CHS group, respectively. Green coloring indicates new bone formation
Quantitative analysis at 30 day post-surgery (Table 1) revealed significant differences in bone surface (BS; p = 0.019), bone surface density (BS/TV; p = 0.035), and trabecular number (Tb.N; p < 0.001). Notably, trabecular separation (Tb.Sp) also showed significant differences between groups (p = 0.005). Other parameters including tissue volume (TV; p = 0.556), bone volume (BV; p = 0.342), percent bone volume (BV/TV; p = 0.342), bone surface/volume ratio (BS/BV; p = 0.527), and trabecular thickness (Tb.Th; p = 0.103) showed no significant differences at this timepoint. At 60-day post-surgery (Table 1), while absolute bone volume (BV) showed a trend toward higher values in the HMTs–CHS group (13.92 ± 1.36 mm3) compared to CHS (11.12 ± 2.71 mm3) and blank groups (10.28 ± 1.41 mm3), this difference did not reach statistical significance (p = 0.060). However, bone quality parameters demonstrated significant superiority of the HMTs–CHS scaffold. The bone volume fraction (BV/TV), which normalizes bone volume to the total defect volume and provides a more accurate assessment of defect filling, was significantly higher in the HMTs–CHS group (14.07 ± 0.84%) compared to both CHS (9.74 ± 1.36%) and blank groups (10.00 ± 1.52%, p = 0.002). Moreover, surface-related parameters including bone surface (BS, p = 0.001) and bone surface density (BS/TV, p = 0.001) were significantly elevated in the HMTs–CHS group, indicating not only greater quantity but also superior quality and maturity of newly formed bone tissue.
Table 1.
Quantitative micro-CT analysis of bone repair parameters in each experimental group at 30- and 60-day post-surgery, showing mean ± SD values and statistical significance (p values) between groups
| Bone repair parameters | Units | BG | CHS | HMTs–CHS | p value |
|---|---|---|---|---|---|
| 30 days | |||||
| Tissue volume (TV) | mm3 | 102.03 (1.55) | 103.02 (1.30) | 102.38 (0.80) | 0.556 |
| Bone volume (BV) | mm3 | 7.92 (1.38) | 8.33 (0.82) | 9.06 (0.83) | 0.342 |
| Percent bone volume (BV/TV) | % | 7.76 (1.36) | 8.09 (0.77) | 8.84 (0.75) | 0.342 |
| Bone surface (BS) | mm2 | 71.26 (6.24) | 85.76 (6.23) | 86.83 (8.13) | 0.019 |
| Bone surface/volume ratio (BS/BV) | 1/mm | 9.25 (1.77) | 10.34 (0.98) | 9.64 (1.15) | 0.527 |
| Bone surface density (BS/TV) | 1/mm | 0.70 (0.07) | 0.83 (0.07) | 0.85 (0.08) | 0.035 |
| Trabecular thickness (Tb.Th) | mm | 0.51 (0.08) | 0.36 (0.09) | 0.37 (0.11) | 0.103 |
| Trabecular number (Tb.N) | 1/mm | 0.16 (0.02) | 0.26 (0.02) | 0.19 (0.06) | < 0.001 |
| Trabecular separation (Tb.Sp) | mm | 1.06 (0.16) | 1.47 (0.14) | 1.53 (0.18) | 0.005 |
| 60 days | |||||
| Tissue volume (TV) | mm3 | 102.92 (1.94) | 102.52 (1.86) | 102.56 (0.71) | 0.902 |
| Bone volume (BV) | mm3 | 10.28 (1.41) | 11.12 (2.71) | 13.92 (1.36) | 0.060 |
| Percent bone volume (BV/TV) | % | 10.00 (1.52) | 9.74 (1.36) | 14.07 (0.84) | 0.002 |
| Bone surface (BS) | mm2 | 71.31 (16.40) | 104.60 (20.78) | 150.03 (23.81) | 0.001 |
| Bone surface/volume ratio (BS/BV) | 1/mm | 7.12 (1.83) | 9.95 (3.68) | 10.82 (1.65) | 0.158 |
| Bone surface density (BS/TV) | 1/mm | 0.69 (0.15) | 1.02 (0.20) | 1.47 (0.24) | 0.001 |
| Trabecular thickness (Tb.Th) | mm | 0.41 (0.06) | 0.42 (0.04) | 0.46 (0.05) | 0.436 |
| Trabecular number (Tb.N) | 1/mm | 0.27 (0.11) | 0.27 (0.02) | 0.37 (0.03) | 0.096 |
| Trabecular separation (Tb.Sp) | mm | 1.57 (0.14) | 1.60 (0.17) | 1.35 (0.11) | 0.068 |
Histological evaluation of bone regeneration
Histological analysis revealed distinct patterns of bone regeneration across all experimental groups at both timepoints. At 30-day post-surgery, the Blank Group (Fig. 8A) showed new bone formation limited to the defect margins, while the central region was filled with loose connective tissue. The fibrous tissue distant from the bone margins appeared more dense, with collagen fibers arranged parallel to the defect surface. Inflammatory cells, fibroblasts, and newly formed blood vessels were observed throughout the defect area. In the CHS group at 30 days (Fig. 8B), irregular scaffold materials were widely distributed and embedded within collagen fibers throughout the defect area. The central region contained a mixture of fibroblasts, osteocytes, new bone formation, and blood vessels. Notably, vacuoles and fissures were observed surrounding the newly formed bone, with evidence of bone tissue remodeling at both the defect margins and central regions. The HMTs–CHS group at 30 days (Fig. 8C) demonstrated irregular scaffold material distribution interwoven with collagen fibers. New bone formation was observed at the defect margins alongside highly cellularized connective tissue. Multiple bone islands composed of osteoid tissue formed in the central defect region, with some containing medullary spaces. Some areas showed aseptic inflammatory response during the repair process.
Fig. 8.

H&E staining of calvarial defects at 30- and 60 day post-surgery. A–C Representative images at 30 days showing new bone formation in Blank Group, CHS group, and HMTs–CHS group, respectively. D–F Representative images at 60 day post-surgery for Blank Group, CHS group, and HMTs–CHS group. The dotted line was used to show the border of the original basal bone and regenerated bone
By 60-day post-surgery, the Blank Group (Fig. 8D) showed increased new bone formation at the defect margins, with visible bone islands connecting to the defect edges. However, the central region remained predominantly filled with connective tissue. The CHS group (Fig. 8E) showed significant scaffold degradation, with new bone formation present at both the margins and central regions. Multiple irregular bone islands were observed in the central area, interspersed with loose connective tissue.
The HMTs–CHS group at 60 days (Fig. 8F) exhibited extensive new bone formation throughout both the marginal and central regions of the defect. The new bone in the central region had consolidated into larger segments, showing increased volume and distribution. Connective tissue was notably reduced, and small amounts of unabsorbed scaffold material remained visible, surrounded by macrophages.
Discussion
The morphological analysis results revealed that HMTs–CHS forms a well-organized honeycomb-like structure with pore sizes predominantly ranging from 100 to 160 μm, encompassed within a broader distribution of 30–200 μm. This pore size distribution is particularly advantageous for bone tissue engineering applications, as previous studies have established that pore sizes between 100 and 400 μm are optimal for bone regeneration [42]. Specifically, pores around 100 μm facilitate cell adhesion and proliferation, while larger pores promote cell migration and vascularization [43]. The hierarchical pore structure observed in our scaffold aligns with these requirements, where the smaller pores (30–100 μm) can support initial cell attachment and proliferation, while the majority pores (100–160 μm) provide adequate space for cell migration, matrix deposition, and vascular ingrowth. This structural feature is particularly significant as it mimics the hierarchical organization of natural bone tissue, where multiple scales of porosity contribute to different biological functions. The honeycomb-like architecture not only provides mechanical support but also creates interconnected channels that are crucial for nutrient diffusion and waste removal, essential factors for successful bone regeneration [44].
Beyond the pore architecture of our HMTs–CHS scaffold, the elongated morphology of hydroxyapatite itself plays a crucial role in bone regeneration. The effectiveness of elongated hydroxyapatite structures extends beyond nanowires to include microtubes. Hou et al. (2022) [18] demonstrated that HMTs form a unique “pipeline framework” within scaffolds, which interconnects adjacent pores and enhances mechanical properties, breathability, and signal transmission—features that complement the osteogenic properties observed with nanowire-based composites. Furthermore, the tubular morphology of hydroxyapatite structures has been shown to offer advantages over conventional particle forms, with Beaufils et al. (2019) [45] reporting that calcium-deficient hydroxyapatite nanotubes exhibit better biological and mechanical properties than spherical particles. In addition, Fu et al. (2021) [46] found that incorporating ultralong hydroxyapatite nanowires into composite membranes effectively enhanced bone tissue formation in rat calvarial defects, with optimal mechanical properties achieved at 10 wt% nanowire content. These findings collectively support the structural design rationale of our HMTs–CHS scaffold, where the ultralong tubular morphology of HMTs provides both mechanical reinforcement and bioactive signaling for enhanced osteogenesis.
The CCK-8 assay showed significantly enhanced cell proliferation in the HMTs–CHS group compared to the CHS group at day 5, while micro-CT analysis results confirmed superior bone regeneration with higher BV/TV, BS, and BS/TV values (p < 0.05) in the HMTs–CHS group at 60-day post-surgery. The combination of ultralong HMTs and CHS has been shown to enhance osteogenic effects compared to using CHS alone. This improvement is attributed to the synergistic properties of HMT and CHS, which together provide superior mechanical strength, biocompatibility, and drug delivery capabilities. The integration of these materials results in a composite scaffold that is particularly effective for bone tissue engineering and regeneration applications. These findings align with previous research by Sun et al. [19], who demonstrated that combining ultralong hydroxyapatite nanowires with CHS promotes osteogenic differentiation. In particular, the Zn-UHANWs/CS (ultralong HA nanowires decorated with zinc-containing nanoparticles and CHS) composite scaffold enhances the osteogenic differentiation of rat bone-marrow-derived mesenchymal stem cells, facilitating in vivo bone regeneration more effectively than pure CHS scaffolds [19]. Similar enhancement effects have been reported by Souto-Lopes et al. [47], who found that HA–CHS composites promote higher bone volume and new bone formation compared to CHS alone. This was confirmed through microCT and histological analysis, which showed increased calcium deposition and bone ingrowth in the HA–CHS composite group [47]. In addition, Safira et al. used rats model and found that HA–CHS composites modulate cytokine levels and increase biochemical markers associated with bone formation, such as ALP and calcium, more effectively than CHS alone [48]. Moreover, Gawel et al. have demonstrated that HA–CHS composites support better cell proliferation and osteogenic differentiation compared to CHS scaffolds. The superior performance of such composite systems has been attributed to the synergistic effects between HA and CHS, where HA provides bioactive signals for osteogenesis, while CHS offers a suitable matrix for cell growth [47].
The enhanced osteogenic differentiation observed in the HMTs–CHS group can be attributed to the coordinated regulation of both early and late osteogenic markers. Our results demonstrated significant upregulation of RUNX2, a master transcription factor essential for osteogenic differentiation, which initiates the expression of key bone-specific genes. Peng et al. found that biomimetic scaffolds composed of HA and CHS have been shown to support the adhesion and proliferation of murine mesenchymal stem cells (mMSCs), leading to increased RUNX2 expression [49]. The simultaneous increase in COL1 expression, which is crucial for the formation of the extracellular matrix, suggests that the HMTs–CHS scaffold effectively triggers the initial stages of osteogenic differentiation. This finding aligns with previous study conducted by Yang et al. showing that CS/HA composite films can enhance the expression of COL1 in MSCs [50]. The subsequent elevation of late osteogenic markers (OPN, OCN, and BSP) indicates successful progression through the osteogenic differentiation cascade. OPN, as a prominent non-collagenous protein in bone matrix, plays a crucial role in cell attachment and matrix mineralization through its calcium-binding properties and interaction with integrin receptors [51]. OCN, primarily expressed during the late stages of osteogenic differentiation, regulates hydroxyapatite crystal formation and acts as a signaling molecule to coordinate bone mineralization [52]. BSP, another key component of mineralized tissues, facilitates initial crystal formation during bone mineralization and promotes osteoblast differentiation through its RGD sequence-mediated cell adhesion [53]. The ability of HMTs–CHS to promote both early and late markers can be explained by the synergistic effects of its components: the ultralong HMTs provide sustained calcium and phosphate ion release, while CHS's positive surface charge facilitates cell adhesion and subsequent activation of mechanotransduction pathways that promote osteogenic gene expression. This coordinated enhancement of the entire osteogenic program likely contributes to the superior bone regeneration observed in our in vivo studies.
The superior osteogenic performance of HMTs–CHS scaffolds can be attributed to the unique structural characteristics of ultralong HMTs, particularly their hollow tubular morphology and high aspect ratio. The hollow tubular structure creates a “pipeline framework” that interconnects adjacent pores, enhancing mechanical properties, breathability, and signal transmission throughout the scaffold [18]. This hollow architecture provides a high surface area (> 100 m2/g) with mesoporous shell walls, facilitating enhanced protein adsorption, cell attachment, and controlled delivery of bioactive molecules [54]. Studies have demonstrated that hydroxyapatite with higher aspect ratios exhibit superior osteogenic effects through osteoimmunomodulation, specifically by promoting T cell infiltration and IL-22 production, which activates JAK1/STAT3 signaling in bone marrow stromal cells [55]. In addition, ultralong hydroxyapatite nanowires can be assembled into biomimetically ordered structures that guide directional stem cell migration and promote M2 macrophage polarization, creating a favorable osteoimmune environment [20]. The elongated morphology of HMTs (aspect ratio ~ 25) mimics the anisotropic architecture of natural bone matrix, providing both mechanical reinforcement and topographical cues for cell guidance. In contrast to conventional spherical hydroxyapatite particles that primarily function through passive osteoconduction, the ultralong tubular morphology of HMTs actively orchestrates spatial cell organization and enhances osteoinduction through multiple synergistic mechanisms, explaining the significantly enhanced bone regeneration observed in this study.
Despite the promising results of this study, several limitations should be acknowledged. First, while the HMTs–CHS scaffold demonstrated enhanced bone regeneration, the molecular mechanisms underlying this improved osteogenic effect, particularly the signaling pathways involved in cell–material interactions, remain to be fully elucidated. Second, our in vivo study was limited to a 60-day observation period, which may not be sufficient to evaluate the long-term stability and complete remodeling of the regenerated bone tissue. A longer follow-up period, specifically 90- or 120-day studies, would provide valuable insights into complete scaffold resorption and bone maturation processes over time. Third, although the critical-size calvarial defect model is widely accepted for evaluating bone regeneration, additional studies using load-bearing bone defect models would be beneficial. Specifically, biomechanical testing in a rabbit femoral defect model could validate the scaffold's load-bearing capacity under mechanical stress conditions, though scalability of HMT synthesis may pose challenges for large-scale production needed for such studies. Furthermore, the current study focused primarily on radiological and histological assessments; future research should include comprehensive biomechanical testing to evaluate the mechanical properties of the regenerated bone tissue. Finally, while our sample size was sufficient for statistical analysis, larger scale studies would be valuable to validate these findings and assess potential variations in healing responses. Future investigations should also explore the possibility of incorporating growth factors or bioactive molecules into the HMTs–CHS scaffold to further enhance its osteogenic potential and optimize its degradation rate to better match the pace of new bone formation.
The findings of this study open up promising avenues for future research and clinical applications in bone tissue engineering. The successful development of the HMTs–CHS composite scaffold suggests several directions for further investigation, particularly exploring the potential of using the hollow structure of HMTs as carriers for bioactive molecules and growth factors to enhance bone regeneration. From a clinical perspective, the scaffold shows considerable potential for translation, especially in oral and maxillofacial surgery, where it could serve as a viable alternative to traditional bone grafts. This is particularly significant in cases, where autologous bone grafting is limited by donor site availability or morbidity. The scaffold's demonstrated ability to promote bone regeneration, combined with its biocompatibility and suitable mechanical properties, suggests promising clinical applications. In the context of maxillofacial surgery, the HMTs–CHS scaffold could be particularly valuable for reconstructing cranial bone defects resulting from trauma, tumor resection, or congenital malformations, where the non-load-bearing nature of calvarial bones aligns well with the scaffold's mechanical properties. The scaffold's porous architecture and osteoinductive capacity make it especially suitable for addressing the unique challenges of cranial defect repair, including the need for adequate vascularization and integration with the dura mater and overlying soft tissues. However, translating this technology from laboratory to clinical scale will require addressing the scalability challenges inherent to hydrothermal synthesis of HMTs, particularly the batch-to-batch consistency, production time (25-h synthesis cycles), and manufacturing costs associated with large-volume production. Future work should explore optimized continuous-flow hydrothermal systems or alternative synthesis methods that maintain the unique tubular morphology while enabling cost-effective mass production suitable for clinical demands. Before clinical implementation, larger animal studies and comprehensive safety assessments will be necessary to validate these findings and optimize the scaffold for human use. Future research should also focus on optimizing the degradation rate of the scaffold to better match the pace of new bone formation. Specifically, modulating the CHS molecular weight, degree of deacetylation, and the HA/CHS ratio could provide fine control over degradation kinetics, ensuring that scaffold resorption occurs synchronously with new bone formation rather than prematurely or too slowly. Long-term stability is another critical consideration for clinical translation; the scaffold must maintain sufficient mechanical integrity during the early healing phase while gradually transferring load-bearing function to the regenerating bone tissue. Balancing these temporal requirements—controlled degradation matched to bone regeneration rates while preserving structural stability—will be essential for achieving optimal clinical outcomes in CSDs. Incorporating advanced imaging techniques for long-term follow-up studies would provide valuable insights into the complete regeneration process and integration with host tissue.
Conclusion
In this study, we successfully fabricated and characterized a novel HMTs–CHS composite scaffold with optimal structural properties for bone tissue engineering. In vitro studies demonstrated that the HMTs–CHS scaffold significantly enhanced BMSC proliferation and osteogenic differentiation, supported by elevated expression of both early and late osteogenic markers. The scaffold's superior performance was further validated in vivo using a rat calvarial CSD model. Micro-CT analysis revealed that the HMTs–CHS group achieved a 14.07 ± 0.84% bone volume fraction at 60 days, representing a 44% relative improvement over the CHS group (9.74 ± 1.36%), alongside superior trabecular architecture. Complementary histological evaluation confirmed more extensive bone formation throughout the defect site, with greater maturation and organization of the regenerated tissue. The enhanced bone formation and maturation observed in the HMTs–CHS group can be attributed to the synergistic effects of ultralong HMTs and CHS, where the microtubes provide biomimetic calcium phosphate signals, while CHS offers an optimal matrix for cell attachment and growth. These findings establish the HMTs–CHS composite scaffold as a promising biomaterial for bone tissue engineering, particularly in the treatment of cranial bone defects, and suggest potential for future development in load-bearing applications.
Reporting guidelines statement
This study was designed and reported in accordance with the ARRIVE guidelines (Animal Research: Reporting of In Vivo Experiments) for the ethical use of animals in research. All experimental procedures followed these guidelines to ensure appropriate experimental design, statistical methods, and comprehensive reporting of relevant details regarding the animals used in this study.
Supplementary Information
Supplementary Material 1: Figure S1. The full-length gel of Fig 6B-upper panel showing RUNX2 protein expression in BMSCs cultured on different scaffolds. Figure S2. The full-length gel of Fig 6B-upper panel showing COL1 protein expression in BMSCs cultured on different scaffolds. Figure S3. The full-length gel of Fig 6B-upper panel showing GAPDH protein expressioncorresponding to RUNX2 and COL1 blots. Figure S4. The full-length gel of Fig 6B-lower panel showing OPN protein expression in BMSCs cultured on different scaffolds. Figure S5. The full-length gel of Fig 6B-lower panel showing OCN protein expression in BMSCs cultured on different scaffolds. Figure S6. The full-length gel of Fig 6B-lower panel showing BSP protein expression in BMSCs cultured on different scaffolds. Figure S7. The full-length gel of Fig 6B-lower panel showing GAPDH protein expressioncorresponding to OPN, OCN, and BSP blots
Acknowledgements
Nothing to declare.
Abbreviations
- ALP
Alkaline phosphatase
- ANOVA
Analysis of variance
- BCA
Bicinchoninic acid
- BMSCs
Bone marrow mesenchymal stem cells
- BS
Bone surface
- BS/BV
Bone surface/volume ratio
- BS/TV
Bone surface density
- BSP
Bone sialoprotein
- BV
Bone volume
- BV/TV
Bone volume fraction
- CCK-8
Cell counting Kit-8
- CHS
Chitosan
- COL1
Collagen type I
- CSD
Critical-size defect
- DAPI
4′,6-Diamidino-2-phenylindole
- DMEM/F12
Dulbecco’s modified eagle medium/F12
- EDTA
Ethylenediaminetetraacetic acid
- EdU
5-Ethynyl-2′-deoxyuridine
- FBS
Fetal bovine serum
- FTIR
Fourier transform infrared spectroscopy
- GAPDH
Glyceraldehyde-3-phosphate dehydrogenase
- HA
Hydroxyapatite
- H&E
Hematoxylin and eosin
- HMTs
Hydroxyapatite microtubes
- LDH
Lactate dehydrogenase
- micro-CT
Micro-computed tomography
- OCN
Osteocalcin
- OPN
Osteopontin
- PBS
Phosphate-buffered saline
- PVDF
Polyvinylidene fluoride
- qRT-PCR
Quantitative real-time polymerase chain reaction
- RIPA
Radioimmunoprecipitation assay
- ROI
Region of interest
- RUNX2
Runt-related transcription factor 2
- SD
Standard deviation
- SDS–PAGE
Sodium dodecyl sulfate–polyacrylamide gel electrophoresis
- SEM
Scanning electron microscopy
- Tb.N
Trabecular number
- Tb.Sp
Trabecular separation
- Tb.Th
Trabecular thickness
- TEM
Transmission electron microscopy
- TS
Total tissue surface
- TV
Tissue volume
- XRD
X-ray diffraction
Author contributions
LL and JW conceived and designed the study, performed the experiments, analyzed the data, and wrote the original draft. WS validated the experimental results and provided research resources. HT supervised the research and provided critical feedback. TL contributed to methodology development and data interpretation. LL and ZAG were responsible for project administration, funding acquisition, and manuscript review and editing. All authors have read and approved the final manuscript.
Funding
The authors did not receive support from any organization for the submitted work. No funding was received to assist with the preparation of this manuscript. No funding was received for conducting this study.
Data availability
The raw data and processed data supporting the findings of this study are available from the corresponding author upon reasonable request.
Declarations
Ethics approval and consent to participate
All animal experimental procedures followed the recommendations of the Guide for the Care and Use of Laboratory Animals and were approved by the Committee on the Ethics of Animal Experiments of Changzhi Medical College laboratory animal center (Permit Number: DW2022083) and the Universiti Sains Malaysia Institutional Animal Care and Use Committee (USM IACUC) with the Animal Ethics Approval Number: USM/IACUC/2024/(147)(1336).
Competing interest
The authors declare no competing interests.
Footnotes
Publisher's Note
Springer Nature remains neutral with regard to jurisdictional claims in published maps and institutional affiliations.
Liang Liang and Junyan Wang have contributed as the first author.
Contributor Information
Liang Liang, Email: liangliang@xmhnphdss.cn, Email: 281133678@qq.com.
Zuryati Ab Ghani, Email: zuryati@usm.my.
References
- 1.García-Gareta E, Coathup MJ, Blunn GW. Osteoinduction of bone grafting materials for bone repair and regeneration. Bone. 2015;81:112–21. [DOI] [PubMed] [Google Scholar]
- 2.Myeroff C, Archdeacon M. Autogenous bone graft: donor sites and techniques. J Bone Joint Surg Am. 2011;93:2227–36. [DOI] [PubMed] [Google Scholar]
- 3.Baldwin P, Li DJ, Auston DA, Mir HS, Yoon RS, Koval KJ. Autograft, allograft, and bone graft substitutes: clinical evidence and indications for use in the setting of orthopaedic trauma surgery. J Orthop Trauma. 2019;33:203–13. [DOI] [PubMed] [Google Scholar]
- 4.Betz RR. Limitations of autograft and allograft: new synthetic solutions. Orthopedics. 2002;25:s561-570. [DOI] [PubMed] [Google Scholar]
- 5.Rahman S, Maria KH, Ishtiaque MS, Nahar A, Das H, Hoque SM. Evaluation of a novel nanocrystalline hydroxyapatite powder and a solid hydroxyapatite/Chitosan-Gelatin bioceramic for scaffold preparation used as a bone substitute material. Turk J Chem. 2020;44:884–900. [DOI] [PMC free article] [PubMed] [Google Scholar]
- 6.Alonzo M, Primo FA, Kumar SA, Mudloff JA, Dominguez E, Fregoso G, et al. Bone tissue engineering techniques, advances and scaffolds for treatment of bone defects. Curr Opin Biomed Eng. 2021. 10.1016/j.cobme.2020.100248. [DOI] [PMC free article] [PubMed] [Google Scholar]
- 7.Carvalho JA, Jayme CC, Matsuo FS, Tedesco AC. Chitosan-gelatin/hydroxyapatite-based scaffold associated with mesenchymal stem cells differentiate into osteoblasts improves the surface of the bone lesion in mice C57BL/6J. J Appl Polym Sci. 2024;141:e54978. [Google Scholar]
- 8.Soriente A, Fasolino I, Gomez-Sánchez A, Prokhorov E, Buonocore GG, Luna-Barcenas G, et al. Chitosan/hydroxyapatite nanocomposite scaffolds to modulate osteogenic and inflammatory response. J Biomed Mater Res A. 2022;110:266–72. [DOI] [PMC free article] [PubMed] [Google Scholar]
- 9.Gaweł J, Milan J, Żebrowski J, Płoch D, Stefaniuk I, Kus-Liśkiewicz M. Biomaterial composed of chitosan, riboflavin, and hydroxyapatite for bone tissue regeneration. Sci Rep. 2023;13:17004. [DOI] [PMC free article] [PubMed] [Google Scholar]
- 10.Chatzipetros E, Damaskos S, Tosios KI, Christopoulos P, Donta C, Kalogirou EM, et al. The effect of nano-hydroxyapatite/chitosan scaffolds on rat calvarial defects for bone regeneration. Int J Implant Dent. 2021;7:40. [DOI] [PMC free article] [PubMed] [Google Scholar]
- 11.Piszko PJ, Piszko A, Kiryk S, Kiryk J, Horodniczy T, Struzik N, et al. Bone regeneration capabilities of scaffolds containing chitosan and nanometric hydroxyapatite-systematic review based on in vivo examinations. Biomimetics (Basel). 2024. 10.3390/biomimetics9080503. [DOI] [PMC free article] [PubMed] [Google Scholar]
- 12.Li LH, Kommareddy KP, Pilz C, Zhou CR, Fratzl P, Manjubala I. In vitro bioactivity of bioresorbable porous polymeric scaffolds incorporating hydroxyapatite microspheres. Acta Biomater. 2010;6:2525–31. [DOI] [PubMed] [Google Scholar]
- 13.Babbi L, Barbanti-Brodano G, Gasbarrini A, Boriani S. Iliac crest bone graft: a 23-years hystory of infection at donor site in vertebral arthrodesis and a review of current bone substitutes. Eur Rev Med Pharmacol Sci. 2016;20:4670–6. [PubMed] [Google Scholar]
- 14.Urbaniak J, Kołodziejska B, Kaflak A. Synthesis of new chitosan-carbonate hydroxyapatite composites with potential application in bone tissue engineering-physicochemical analysis. Progress Chem Appl Chitin Deriv. 2022;27:217–27. [Google Scholar]
- 15.Nga NK, Tam LTT, Ha NT, Viet PH, Huy TQ. Enhanced biomineralization and protein adsorption capacity of 3D chitosan/hydroxyapatite biomimetic scaffolds applied for bone-tissue engineering. RSC Adv. 2020;10:43045–57. [DOI] [PMC free article] [PubMed] [Google Scholar]
- 16.Lipton AN, Fathima A, Vincent S. In-vitro evaluation of chitosan-hydroxyapatite nanocomposite scaffolds as bone substitutes with antibiofilm properties. J Pure Appl Microbiol. 2021. 10.22207/JPAM.15.3.39. [Google Scholar]
- 17.Zhang YG, Zhu YJ, Chen F, Sun TW. A novel composite scaffold comprising ultralong hydroxyapatite microtubes and chitosan: preparation and application in drug delivery. J Mater Chem B. 2017;5:3898–906. [DOI] [PubMed] [Google Scholar]
- 18.Hou X, Chen Y, Chen F, Liu J, Wang T, Luo Y, et al. The hydroxyapatite microtubes enhanced GelMA hydrogel scaffold with inner “pipeline framework” structure for bone tissue regeneration. Compos Part B Eng. 2022;228:109396. [Google Scholar]
- 19.Sun TW, Yu WL, Zhu YJ, Chen F, Zhang YG, Jiang YY, et al. Porous nanocomposite comprising ultralong hydroxyapatite nanowires decorated with zinc-containing nanoparticles and chitosan: synthesis and application in bone defect repair. Chemistry. 2018;24:8809–21. [DOI] [PubMed] [Google Scholar]
- 20.Geng X, Tang Y, Yuan B, Dai Y, Yu H-P, Xiong Z-C, et al. Biomimetically ordered ultralong hydroxyapatite nanowires-based hierarchical hydrogel scaffold with osteoimmunomodulatory and osteogenesis abilities for augmenting bone regeneration. Chem Eng J. 2024;488:151136. [Google Scholar]
- 21.Kumar P, Dehiya BS, Sindhu A. Comparative study of chitosan and chitosan–gelatin scaffold for tissue engineering. Int Nano Lett. 2017;7:285–90. [Google Scholar]
- 22.Mourdikoudis S, Pallares RM, Thanh NTK. Characterization techniques for nanoparticles: comparison and complementarity upon studying nanoparticle properties. Nanoscale. 2018;10:12871–934. [DOI] [PubMed] [Google Scholar]
- 23.Liang L, Wang J, Zhang Y, Shen Z, Zheng J, Li J, et al. Transdifferentiation of bone marrow-derived mesenchymal stem cells into salivary gland-like cells using a novel culture method. Biotechnol Lett. 2015;37:1505–13. [DOI] [PubMed] [Google Scholar]
- 24.Fan J, Schiemer T, Vaska A, Jahed V, Klavins K. Cell via cell viability assay changes cellular metabolic characteristics by intervening with glycolysis and pentose phosphate pathway. Chem Res Toxicol. 2024;37:208–11. [DOI] [PMC free article] [PubMed] [Google Scholar]
- 25.Angelozzi M, de Charleroy CR, Lefebvre V. EdU-based assay of cell proliferation and stem cell quiescence in skeletal tissue sections. Methods Mol Biol. 2021;2230:357–65. [DOI] [PMC free article] [PubMed] [Google Scholar]
- 26.Ansari S, Ito K, Hofmann S. Alkaline phosphatase activity of serum affects osteogenic differentiation cultures. ACS Omega. 2022;7:12724–33. [DOI] [PMC free article] [PubMed] [Google Scholar]
- 27.Nakamura T, Nakamura-Takahashi A, Kasahara M, Yamaguchi A, Azuma T. Tissue-nonspecific alkaline phosphatase promotes the osteogenic differentiation of osteoprogenitor cells. Biochem Biophys Res Commun. 2020;524:702–9. [DOI] [PubMed] [Google Scholar]
- 28.Gregory CA, Gunn WG, Peister A, Prockop DJ. An alizarin red-based assay of mineralization by adherent cells in culture: comparison with cetylpyridinium chloride extraction. Anal Biochem. 2004;329:77–84. [DOI] [PubMed] [Google Scholar]
- 29.Bernar A, Gebetsberger JV, Bauer M, Streif W, Schirmer M. Optimization of the alizarin red S assay by enhancing mineralization of osteoblasts. Int J Mol Sci. 2022. 10.3390/ijms24010723. [DOI] [PMC free article] [PubMed] [Google Scholar]
- 30.Kumar P, Nagarajan A, Uchil PD. Analysis of cell viability by the lactate dehydrogenase assay. Cold Spring Harb Protoc. 2018. 10.1101/pdb.prot095497. [DOI] [PubMed] [Google Scholar]
- 31.Livak KJ, Schmittgen TD. Analysis of relative gene expression data using real-time quantitative PCR and the 2(-Delta Delta C(T)) method. Methods. 2001;25:402–8. [DOI] [PubMed] [Google Scholar]
- 32.Mahmood T, Yang PC. Western blot: technique, theory, and trouble shooting. N Am J Med Sci. 2012;4:429–34. [DOI] [PMC free article] [PubMed] [Google Scholar]
- 33.Cruz-Orive LM, Weibel ER. Recent stereological methods for cell biology: a brief survey. Am J Physiol. 1990;258:L148-156. [DOI] [PubMed] [Google Scholar]
- 34.Odabas S, Derkuş B, Vargel İ, Vural AC. Surgical method for critical sized cranial defects in rat cranium. MethodsX. 2023;10:102208. [DOI] [PMC free article] [PubMed] [Google Scholar]
- 35.Senatov F, Maksimkin A, Chubrik A, Kolesnikov E, Orlova P, Krivozubov M, et al. Osseointegration evaluation of UHMWPE and PEEK-based scaffolds with BMP-2 using model of critical-size cranial defect in mice and push-out test. J Mech Behav Biomed Mater. 2021;119:104477. [DOI] [PubMed] [Google Scholar]
- 36.Schmitz JP, Hollinger JO. The critical size defect as an experimental model for craniomandibulofacial nonunions. Clin Orthop Relat Res. 1986. 10.1097/00003086-198604000-00036. [PubMed] [Google Scholar]
- 37.Spicer PP, Kretlow JD, Young S, Jansen JA, Kasper FK, Mikos AG. Evaluation of bone regeneration using the rat critical size calvarial defect. Nat Protoc. 2012;7:1918–29. [DOI] [PMC free article] [PubMed] [Google Scholar]
- 38.Cooper GM, Mooney MP, Gosain AK, Campbell PG, Losee JE, Huard J. Testing the critical size in calvarial bone defects: revisiting the concept of a critical-size defect. Plast Reconstr Surg. 2010;125:1685–92. [DOI] [PMC free article] [PubMed] [Google Scholar]
- 39.Diallo AM, Rota S, Boissière M, Bardonnet R, Pauthe E, Petite H, et al. Osteoformation potential of an allogenic partially demineralized bone matrix in critical-size defects in the rat calvarium. Mater Sci Eng C Mater Biol Appl. 2021;127:112207. [DOI] [PubMed] [Google Scholar]
- 40.Nascimento T, Gerber JT, Verbicaro T, Arce RM, Elsalanty ME, Fontana JD, et al. Biochemical and X-ray micro-computed tomographic analyses of critical size bone defects grafted with autogenous bone and mercerized bacterial cellulose membranes salified with alendronate. J Oral Biosci. 2021;63:408–15. [DOI] [PubMed] [Google Scholar]
- 41.Fischer AH, Jacobson KA, Rose J, Zeller R. Hematoxylin and eosin staining of tissue and cell sections. CSH Protoc. 2008;2008:pdb.prot4986. [DOI] [PubMed] [Google Scholar]
- 42.Cordonnier T, Sohier J, Rosset P, Layrolle P. Biomimetic materials for bone tissue engineering–state of the art and future trends. Adv Eng Mater. 2011;13:B135–50. [Google Scholar]
- 43.Murphy CM, Haugh MG, O’Brien FJ. The effect of mean pore size on cell attachment, proliferation and migration in collagen-glycosaminoglycan scaffolds for bone tissue engineering. Biomaterials. 2010;31:461–6. [DOI] [PubMed] [Google Scholar]
- 44.Bružauskaitė I, Bironaitė D, Bagdonas E, Bernotienė E. Scaffolds and cells for tissue regeneration: different scaffold pore sizes-different cell effects. Cytotechnology. 2016;68:355–69. [DOI] [PMC free article] [PubMed] [Google Scholar]
- 45.Beaufils S, Rouillon T, Millet P, Le Bideau J, Weiss P, Chopart JP, et al. Synthesis of calcium-deficient hydroxyapatite nanowires and nanotubes performed by template-assisted electrodeposition. Mater Sci Eng C Mater Biol Appl. 2019;98:333–46. [DOI] [PubMed] [Google Scholar]
- 46.Fu Y, Zhang J, Lin H, Mo A. 2D titanium carbide(MXene) nanosheets and 1D hydroxyapatite nanowires into free standing nanocomposite membrane: in vitro and in vivo evaluations for bone regeneration. Mater Sci Eng C Mater Biol Appl. 2021;118:111367. [DOI] [PubMed] [Google Scholar]
- 47.Souto-Lopes M, Grenho L, Manrique Y, Dias MM, Lopes JCB, Fernandes MH, et al. Bone regeneration driven by a nano-hydroxyapatite/chitosan composite bioaerogel for periodontal regeneration. Front Bioeng Biotechnol. 2024;12:1355950. [DOI] [PMC free article] [PubMed] [Google Scholar]
- 48.Safira A, Rani CAM, Fikri F, Purnomo A, Khairani S, Chhetri S, et al. Hydroxyapatite-chitosan composites derived from sea cucumbers and shrimp shells ameliorate femoral bone defects in an albino rat model. Vet World. 2023;16:1084–91. [DOI] [PMC free article] [PubMed] [Google Scholar]
- 49.Peng H, Yin Z, Liu H, Chen X, Feng B, Yuan H, et al. Electrospun biomimetic scaffold of hydroxyapatite/chitosan supports enhanced osteogenic differentiation of mMSCs. Nanotechnology. 2012;23:485102. [DOI] [PubMed] [Google Scholar]
- 50.Yang J, Liu A, Han Y, Li Q, Tian J, Zhou C. Osteodifferentiation of mesenchymal stem cells on chitosan/hydroxyapatite composite films. J Biomed Mater Res A. 2014;102:1202–9. [DOI] [PubMed] [Google Scholar]
- 51.Depalle B, McGilvery CM, Nobakhti S, Aldegaither N, Shefelbine SJ, Porter AE. Osteopontin regulates type i collagen fibril formation in bone tissue. Acta Biomater. 2021;120:194–202. [DOI] [PMC free article] [PubMed] [Google Scholar]
- 52.Komori T. Functions of osteocalcin in bone, pancreas, testis, and muscle. Int J Mol Sci. 2020. 10.3390/ijms21207513. [DOI] [PMC free article] [PubMed] [Google Scholar]
- 53.Gordon JA, Tye CE, Sampaio AV, Underhill TM, Hunter GK, Goldberg HA. Bone sialoprotein expression enhances osteoblast differentiation and matrix mineralization in vitro. Bone. 2007;41:462–73. [DOI] [PubMed] [Google Scholar]
- 54.Xiao W, Fu H, Rahaman MN, Liu Y, Bal BS. Hollow hydroxyapatite microspheres: a novel bioactive and osteoconductive carrier for controlled release of bone morphogenetic protein-2 in bone regeneration. Acta Biomater. 2013;9:8374–83. [DOI] [PMC free article] [PubMed] [Google Scholar]
- 55.Yu F, Lian R, Liu L, Liu T, Bi C, Hong K, et al. Biomimetic hydroxyapatite nanorods promote bone regeneration via accelerating osteogenesis of BMSCs through T cell-derived IL-22. ACS Nano. 2022;16:755–70. [DOI] [PubMed] [Google Scholar]
Associated Data
This section collects any data citations, data availability statements, or supplementary materials included in this article.
Supplementary Materials
Supplementary Material 1: Figure S1. The full-length gel of Fig 6B-upper panel showing RUNX2 protein expression in BMSCs cultured on different scaffolds. Figure S2. The full-length gel of Fig 6B-upper panel showing COL1 protein expression in BMSCs cultured on different scaffolds. Figure S3. The full-length gel of Fig 6B-upper panel showing GAPDH protein expressioncorresponding to RUNX2 and COL1 blots. Figure S4. The full-length gel of Fig 6B-lower panel showing OPN protein expression in BMSCs cultured on different scaffolds. Figure S5. The full-length gel of Fig 6B-lower panel showing OCN protein expression in BMSCs cultured on different scaffolds. Figure S6. The full-length gel of Fig 6B-lower panel showing BSP protein expression in BMSCs cultured on different scaffolds. Figure S7. The full-length gel of Fig 6B-lower panel showing GAPDH protein expressioncorresponding to OPN, OCN, and BSP blots
Data Availability Statement
The raw data and processed data supporting the findings of this study are available from the corresponding author upon reasonable request.