

Abstract
Aims:
To investigate the preliminary efficacy of a cognitive behavioral sleep and circadian intervention on glycemic and psychological outcomes in young adults with type 1 diabetes.
Methods:
Glycemic and psychological outcomes were evaluated in 39 young adults (mean age 21.08, diabetes duration 11.7 years, mean glycated hemoglobin 8.46%, 41% female) from March 2022 to October 2023. Participants were randomly assigned (1:1) to a 12-week cognitive behavioral sleep and circadian condition (n = 21) or a time-balanced attention control condition (n = 18). Data were collected using continuous glucose monitors, research-grade actigraphy, and daily sleep surveys at baseline, post-intervention, and 3-month follow-up.
Results:
The cognitive behavioral sleep and circadian intervention condition showed significant improvements in glycemic outcomes, with reductions in the coefficient of variation and mean amplitude of glucose excursions three months post-intervention. It also resulted in decreased diabetes distress at both time points, unlike the Attention Control group, which had minimal changes.
Conclusions:
Future research should confirm these preliminary findings in larger, more diverse samples with varied intervention lengths and a longer-term follow-up.
Keywords: diabetes mellitus, type 1; young adult; sleep-promoting intervention
1. Introduction
Type 1 diabetes (T1D) affects over 2 million Americans, and its incidence is on the rise in the post-COVID-19 era (1.14 times higher in the first 12 months and 1.27 times higher in the subsequent 12 months) (1). Young adults aged 18–26 years are estimated to represent the highest proportion of adults living with type 1 diabetes and have the lowest achievement of glycemic targets (only 14% with glycated hemoglobin [HbA1C] < 7%) compared to adults in other age groups (30% 26–49 years; 29% > 50 years) (2). This low achievement is compounded by a major challenge in T1D care for young adults, predominantly the low follow-up frequency with healthcare providers, which adversely affects glycemic target achievement and increases the risk of vascular complications. Contributing issues such as geographical displacement, suboptimal provider and patient rapport, and low self-management readiness have been well-documented (3,4). Furthermore, the challenges of transitioning to adult care for young adults have been explored in several studies globally, highlighting the need for targeted interventions. (3,5).
Two sleep health dimensions, including sleep duration and timing, directly affect glycemia (6,7). Specifically, well-controlled experiments on sleep deprivation or misalignment (forced desynchrony) have shown effects on glucose regulation, including glucose tolerance and metabolism, and insulin sensitivity (6,7). Transdiagnostic sleep and circadian approaches are emerging in the literature, which have been applied to various populations with chronic conditions (e.g., obesity, pain, irritable bowel syndrome (8,9). However, despite the prevalence of insufficient sleep duration and inconsistent sleep timing among young adults with T1D, there is a limited availability of behavioral interventions to improve sleep duration and timing. Researchers have confirmed that total and partial sleep deprivation directly affects glucose regulation (6,10). Sleep deprivation is a significant component of cognitive behavioral therapy for insomnia, a common sleep behavioral intervention targeting individuals with clinically significant insomnia and aiming to increase homeostatic sleep drive (11). The well-established detrimental impact of sleep deprivation on glucose regulation, combined with the low prevalence of co-occurring clinical insomnia, suggests that sleep and circadian behavioral interventions have not been developed for the majority of the T1D population. There have been a few behavioral sleep-promoting interventions that exist for children and adolescents aged 5 to 17 (12,13) and adults across a broader age range of 18–65 years with T1D (14). No sleep and circadian interventions exist for young adults with T1D, who face unique challenges during the transition to adult care, such as lifestyle changes, psychosocial factors, technology use, and increased peer reliance (15). Sleep and circadian behavioral interventions tailored to the unique needs and circumstances of young adults with T1D are needed.
Thus, the primary aim of this study was to evaluate the preliminary efficacy of a cognitive behavioral sleep and circadian health intervention (CB-Sleep Health) on short-term and long-term glycemic health and psychological outcomes for young adults with T1D. We tested the following primary hypotheses: that the 12-week clinical trial CB-Sleep Health would improve chronic (long-term) hyperglycemia (HbA1C) (H1) and short-term glucose variability (CGM-derived) immediately post-intervention (H2). We also looked at psychological outcomes (general and diabetes-related distress and diabetes quality of life) as secondary outcomes (H3 and H4). A secondary hypothesis was that these improvements would be sustained 3 months post-intervention (H5 - H8).
2. RESEARCH DESIGN AND METHODS
2.1. Design
This research was a single-center parallel group, open-label randomized controlled trial carried out at Case Western Reserve University between March 2022 and October 2023. The study included eligible participants who were randomly assigned 1:1 (parallel) to one of two groups: CB-Sleep Health (n = 21) or a time-balanced attention control condition (n = 18) stratified by sex assigned at birth (Figure 1). The trial adhered to the Consolidated Standards of Reporting Trials (CONSORT) guidelines and was registered at ClinicalTrials.gov (NCT# NCT04975230). Ethical approval was granted by the University Hospitals Institutional Review Board (IRB) (#STUDY20211165). There were no changes to methods after trial commencement.
Figure 1: Study Diagram.
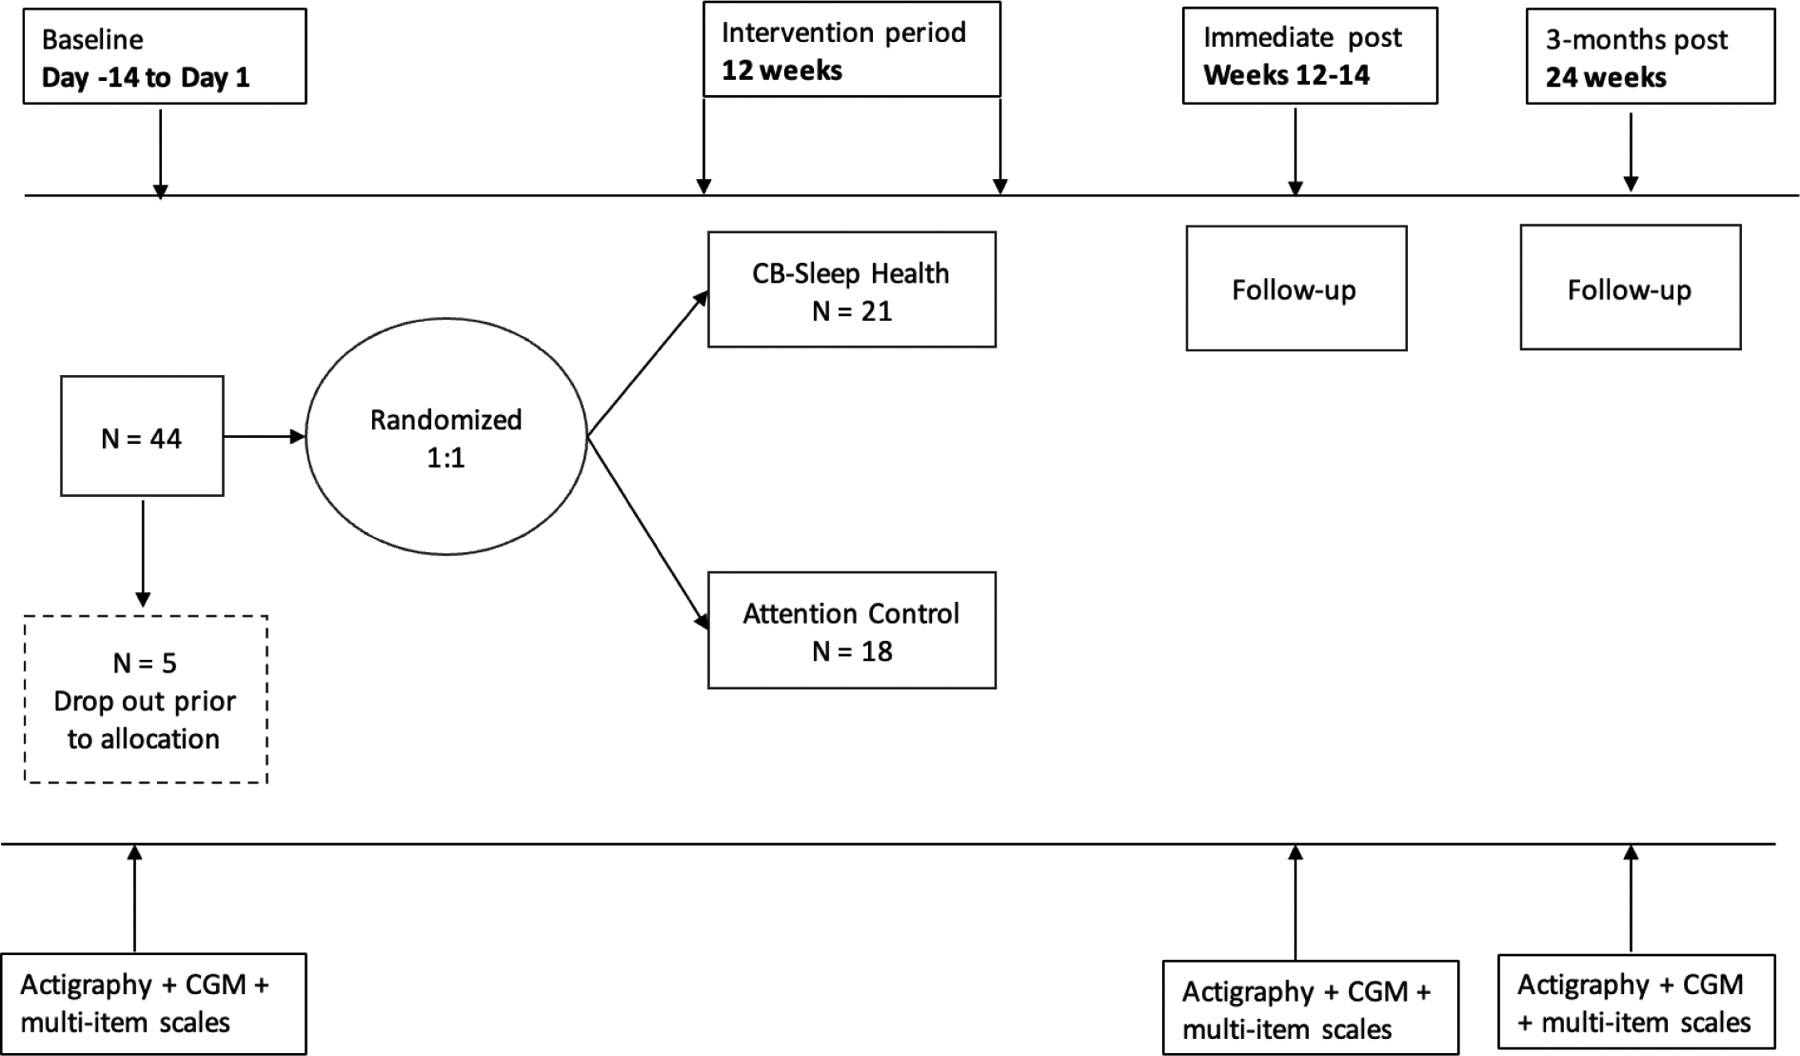
The timeline for the study is depicted at the top, with baseline period denoted by day -14 to day 1, the 12-week intervention, and follow ups immediately after and 3-months post intervention. We recruited 44 into the baseline period and 5 dropped out prior to allocation, 39 were allocated 1:1 to the cognitive behavioral sleep and circadian intervention (CB-Sleep Health condition) (n = 21) or to the attention control (n = 18). The measurements taken are at the bottom, actigraphy + continuous glucose monitoring (CGM) + multi-item scales.
2.2. Participants
A convenience sample of English-speaking adults aged 18–26 years with T1D for at least 6 months and without complex medical or psychiatric comorbidities was recruited from diabetes specialty clinics in Northeast Ohio. T1D diagnosis was confirmed with ICD-10 code + ≥ 2 of the following: <10 years age at diagnosis, positive autoantibodies (Glutamic Acid Decarboxylase 65 [GAD65], (Insulinoma-Associated Antigen 2 [IA2], Islet Cell Cytoplasmic Autoantibodies [ICA], Zinc Transporter 8 [ZnT8]. We did not invite individuals to participate with known sleep disorders, including obstructive sleep apnea (apnea/hypopnea index ≥15/h), periodic limb movement disorder, restless legs syndrome; those who were currently pregnant, worked night shift, reported trans meridian travel (long distance travel across several time zones), with a habitual sleep duration > 7 hours on work or school days, who were achieving glycemic targets defined as HbA1C values <7% (53.0 mmol/mol) or > 80% time in range (70–180mg/dL), or those currently enrolled in an intervention study. These criteria were chosen to minimize the confounding effects on the primary outcomes of interest and to select participants with room for improvement in their sleep duration and glycemic target achievement.
We determined a final analytic sample size of 40 (allowing for 10% attrition) based on previous studies on sleep behavioral intervention studies in adolescents or adults with T1D a priori (12,14,16). A power calculation for sample size was not conducted due to the pilot nature of the study, and our sample size is in line with several published studies and papers on the appropriate pilot sample size (17–19). A sample of 40 participants (20 per group) was determined to assist us in determining a Cohen’s eta effect size with 95% CI for group differences at post-intervention (3 months) with bias-corrected limits of [.00 −.14], [.00 −.24], and [.01 −.34] for small (n2 = .01), medium (n2 = .06), and large (n2 = .14) effect sizes respectively (17).
A three-step screening process was used, including electronic health record screening, interviews, and a 2-week home monitoring period. Out of 307 individuals screened, 60 were excluded for low HbA1C levels and 1 for a recent T1D diagnosis (< 6 months). Of the 285 participants approached for further screening, 61 declined, and 180 could not be reached. For step 3, 75 potentially eligible participants were screened, with 30 excluded for various reasons (lost to follow-up = 30, declined device = 5, refused = 5). A total of 44 participants completed the 2-week monitoring period with a response rate of 58.7%, which is higher than comparable studies where the response rates ranged from 44.2% (20) to 53% (21).
2.3. Procedure
Following the initial screening and monitoring period, participants were randomly assigned to one of two study conditions: (1) CB-Sleep Health or (2) a time-balanced attention control condition. Random allocation was done by a study biostatistician using a random number generator in SAS, with stratification based on sex at birth. The project manager or research assistant was responsible for participant enrollment. Following this, the project manager opened an opaque envelope created for each stratum (male and female) and assigned participants to one of the two conditions, ensuring a balanced distribution of participants based on sex across the conditions. The statistician remained blinded to participant condition assignment. After the 12-week treatment period and a subsequent 3-month follow-up, participants underwent various assessments, including 14 days of actigraphy with daily sleep diaries, 14 days of CGM monitoring, questionnaires, and HbA1C point-of-care tests at each time point. Sleep diaries were completed for 14 consecutive days at baseline, post-intervention, and at the 3-month follow-up, as well as daily during the 12-week intervention period. The sleep diaries included all components of the Pittsburgh Sleep Diary (22) and information on diabetes-specific symptoms and treatment (insulin dosing). Participants received compensation for each assessment, ranging from $30 for the baseline assessment to $50 for the post-intervention and follow-up assessments. Additional compensation of $30 was provided based on wear compliance, determined through data extraction from devices. Parking passes were also provided for study visits.
To record an objective measure of sleep and circadian behavior, participants wore the Actiwatch Spectrum Plus (Philips Respironics) (23). The Spectrum Plus is reliable and validated in adults with T1D and other chronic conditions (24,25). Spectrum Plus records activity data using a standard spectrum of light and non-wear detection, which can be used to identify valid measures of circadian disorders, sleep disturbance, and other temporal rhythms detectable in the time series data (23). Participants were instructed to wear the Spectrum Plus for 14 continuous days on their non-dominant wrist at each time point. Participants depressed the “lights out” button to demarcate the start of their time in bed and “lights on” to demarcate the end of their time in bed. Data were recorded in 30-second epochs using the medium sensitivity setting on the Spectrum Plus.
2.4. CB-Sleep Health Condition
A three-session (over 12 weeks), individual CB-Sleep Health manual was derived from existing efficacious protocols and the Association of Diabetes Care and Education Specialists (ADCES) curriculum (26–28). The manualized CB-Sleep Health sessions were delivered face-to-face (76.2%, n = 16) or via telehealth (23.8%, n = 5) by trained master’s prepared research assistants under the supervision of a licensed counselor. Session 1 was 60 minutes in length, covering treatment, sleep, diabetes education, assessment, and tips for creating a healthy sleep environment. Sessions 2 and 3 were 30-minute booster sessions to assess progress towards previous goals and to modify goals going forward if needed. Over the 12-week study period, brief weekly follow-ups (5 minutes) conducted by phone call, text, or email, and Zoom/in person were conducted. The sleep education component included an overview (sleep stages, circadian rhythm, sleep hygiene), sleep health and environmental assessment (review of a sleep clinician’s report), creating a sleep environment (stimulus control, correcting unhelpful sleep-related beliefs and basic stress reduction), and sleep extension (extending bedtime by 1 hour titrating 15 minutes per week when sleep efficiency ≥ 85%). The diabetes component of the education included an overview of pathophysiology and treatment, preventing/detecting/treating acute complications, healthy eating, coping, and problem-solving. Progressive muscle relaxation and guided imagery of a preferred place (e.g., ocean, nature walk, starry night) were practiced during the main session. Sessions 2 and 3 focused on reinforcing healthy sleep behavior and assessing progress. Weekly follow-ups were conducted through text or phone calls, and treatment adherence and sleep diaries were reviewed in all sessions.
2.5. Attention Control Condition
A time-balanced three-session Attention control manual was derived from the ADCES curriculum, with time spent analogous to the experimental condition. The Attention Control group received a time-balanced diabetes component of the education, and sessions were centered on participant-driven goals (66.7%, n = 12 face to face and 33.3%, n = 6 via telehealth). An initial 60-minute consultation was conducted to set goals and develop an action plan, followed by 30-minute booster sessions every 4 weeks in addition to brief weekly follow-ups. Weekly follow-ups were conducted through text or phone calls, and participant-driven goal progress was reviewed in all sessions. This structure allowed participants in the CB-Sleep Health condition to receive specialized support focused on their sleep health needs while maintaining a comparable level of interaction and support in the Attention Control condition.
3. Measures
3.1. Demographic and clinical characteristics
Demographic and clinical data were collected from medical records, including age, race, ethnicity, gender, sex, height, weight, T1D diagnosis (confirmed with ICD-10 code), diabetes duration (years), most recent HbA1C (3 months), medical history, and cross-validated with the self-report baseline survey. Additional variables were collected via the baseline survey, such as identity variables (race, ethnicity, gender), education, employment status, full-time student status, insulin therapy regimen, and CGM device brand (if applicable). We also measured insomnia symptom severity with the 7-item insomnia severity index to assess whether the intervention negatively affected or exacerbated new insomnia symptoms (29).
3.2. Long-Term Glycemic Health Outcomes (Primary)
HbA1C was measured during clinic visits using the Siemens Vantage Glucose Analyzer® (range = 2.5 – 14%) (30). The HbA1C from the most recent clinic visit was used to measure long-term glycemic target achievement. We also derived the glucose management indicator (GMI) from the raw continuous glucose monitor (CGM) data. GMI (%) is calculated as (3.38 + 0.02345 × [mean glucose in mg/dL]) (31).
3.3. Short-Term Glycemic Health Outcomes (Primary)
Short-term glycemic health outcomes were estimated from raw CGM data and included % time in the target range (70 – 180 mg/dL), coefficient of variation ([SD/Mean] * 100%), and mean amplitude of glucose excursion (32). CGMs accurately detect glucose patterns across various levels and have a test-retest reliability from 0.77 – 0.95 (33). All participants had their own CGM or were given a Dexcom G6 CGM to obtain glucose patterns. CGM data were downloaded directly from participant devices and subsequently processed using Glyculator [version 3.0, Medical University of Lodz, Poland]. Only CGM data for days with >80% completeness were included in the calculations. CGM devices are applied to participants using an automatic inserter that inserts a small sensor wire beneath the skin surface (34). CGM systems collect glucose data continuously, providing average glucose data every 3 to 5 minutes (34).
3.4. Psychological Outcomes (Secondary Outcomes)
3.4.1. Diabetes Distress Scale.
Emotional distress related to diabetes was measured using the 17-item Diabetes Distress Scale (35). The Diabetes Distress Scale questions are answered on a 6-point Likert scale, indicating how problematic the item is, where 1 indicates no problem, and 6 indicates a very serious problem (35). The range of scores is 17–102, where higher scores indicate a greater degree of emotional distress due to diabetes (35).
3.4.2. General Distress (PROMIS).
General emotional distress was measured using the 8-item PROMIS v1.0 (emotional distress-depression) scale (36). Questions are answered on a 5-point Likert scale (ranging from never to always). Raw scores range from 8–40 and are standardized into a T-score ranging from 38.2 to 81.3, with higher scores indicating higher emotional distress symptoms (36).
3.4.3. Diabetes Quality of Life.
Health-related quality of life, specifically diabetes-related, was measured using the 15-item Diabetes Quality of Life Brief Inventory (37). Each response is rated from 1 (never) to 5 (all the time), with scores ranging from 15–75, and higher scores indicating higher diabetes quality of life (37).
3.5. Statistical analysis
Intention-to-treat analyses were conducted with no imputation for missing data, and statistical tests were two-sided with statistical significance set at p < 0.05 (SAS version 9.4 [SAS Institute, Cary, NC] and SPSS version 29.0). Primary glycemic health and secondary psychologic health outcomes and 3-month follow-up were modeled as a function of fixed effects for timepoint (Level 1, nested within-person), treatment condition (Level 2), and their interaction (the latter term was included to assess whether intervention differences observed immediately postintervention were maintained at 3 months), adjusting for baseline outcome value to improve precision (38) and to account for possible regression to the mean (39). For effect size calculations (see below), parallel analyses were conducted for within-participant change from baseline at postintervention and 3-month follow-up, again adjusting for baseline outcome value.
Linear mixed models with a participant-specific intercept accounted for within-participant correlation over time (40). Separate models were conducted for each outcome (Tables 2 – 3). This was a small sample with no preselected covariates of interest, nor were there between-group differences at baseline, due in part to study design – sex-stratified randomization and narrow inclusion criteria (narrow age range, T1D for at least 6 months without complex medical or psychiatric comorbidities); therefore, analyses were conducted without adjustment for covariates. Effect sizes (Cohen’s d) for each arm and each follow-up time point were calculated as mean within-participant change from baseline estimated from linear mixed models for within-participant change adjusting for baseline outcome value, divided by arm-specific baseline outcome standard deviation (41,42), and applying Hedges’ bias correction (41). Cohen’s d values were interpreted as: 0.20 small, 0.50 medium, and 0.80 large.
Table 2:
Descriptive and inferential statistics for glycemic health outcomes
| Baseline(a) | Post(b) | 3-Month(b) | Cohen’s d (95% Confidence Interval)(c) | |||||
|---|---|---|---|---|---|---|---|---|
| Mean (N) | SE | Mean (N) | SE | Mean (N) | SE | Baseline to Post | Baseline to 3-Month | |
| Long-Term Glycemic Outcomes | ||||||||
| Glycated Hemoglobin A1C (%) G x T p-value = .2000 | ||||||||
| CB-Sleep Health | 8.43 (21) | 0.39 | 7.79 (15) | 0.35 | 8.23 (13) | 0.36 | −0.45 (−1.10, 0.05) | −0.18 (−0.81, 0.40) |
| Attention Control | 8.51 (18) | 0.43 | 8.65 (11) | 0.40 | 8.52 (14) | 0.37 | 0.06 (−0.59, 0.74) | −0.0002 (−0.57, 0.57) |
| Between-group difference | −0.08 | 0.58 | −0.86 | 0.53 | −0.28 | 0.52 | ||
| Glucose Management Indicator (%) G x T p-value = .7104 | ||||||||
| CB-Sleep Health | 8.22 (19) | 0.22 | 8.13 (14) | 0.20 | 8.41 (15) | 0.19 | −0.09 (−0.68, 0.47) | 0.17 (−0.36, 0.75) |
| Attention Control | 8.07 (14) | 0.26 | 8.06 (10) | 0.23 | 8.20 (11) | 0.22 | −0.20 (−0.96, 0.46) | −0.03 (−0.70, 0.62) |
| Between-group difference | 0.14 | 0.34 | 0.07 | 0.30 | 0.21 | 0.29 | ||
| Short-Term Glycemic Outcomes | ||||||||
| Time in Range (% time in range: 70–180mg/dL) G x T p-value = .7131 | ||||||||
| CB-Sleep Health | 43.11 (19) | 4.35 | 43.93 (14) | 3.76 | 39.65 (15) | 3.64 | 0.04 (−0.53, 0.62) | −0.18 (−0.76, 0.35) |
| Attention Control | 45.81 (14) | 5.07 | 45.46 (10) | 4.44 | 43.66 (11) | 4.26 | 0.12 (−0.56, 0.86) | 0.02 (−0.63, 0.69) |
| Between-group difference | −2.70 | 6.68 | −1.53 | 5.82 | −4.60 | 5.60 | ||
| Coefficient of Variation (%) G x T p-value = .3427 | ||||||||
| CB-Sleep Health | 36.02 (19) | 1.12 | 34.95 (14) | 1.35 | 30.98W (15) | 1.31 | −0.13 (−0.73, 0.42) | −0.89 (−1.69, −0.37) |
| Attention Control | 36.33 (14) | 1.31 | 36.84 (10) | 1.60 | 35.12 (11) | 1.54 | 0.25 (−0.40, 1.03) | −0.11 (−0.80, 0.53) |
| Between-group difference | −0.31 | 1.72 | −1.89 | 2.09 | −4.14 | 2.02 | ||
| Mean Amplitude of Glucose Excursions G x T p-value = .1684 | ||||||||
| CB-Sleep Health | 134.60 (19) | 6.22 | 125.62 (14) | 5.98 | 111.83W, B (15) | 5.78 | −0.16 (−0.76, 0.39) | −0.61 (−1.31, −0.11) |
| Attention Control | 126.67 (14) | 7.24 | 126.53 (10) | 7.07 | 130.83(11) | 6.75 | −0.16 (−0.91, 0.51) | 0.02 (−0.64, 0.68) |
| Between-group difference | 7.93 | 9.55 | −0.91 | 9.26 | −19.00 | 8.89 | ||
Note: (N), number of participants; G X T, group by time interaction; Post, posttreatment.
Observed mean and standard error (SE).
Model-based estimated means and SEs, (standard errors) from linear mixed modeling.
Calculated as mean within-participant change divided by group-specific baseline standard deviation.
Number in analytic sample denoted by (n). Hedges’ bias correction applied. Bolded mean value indicates p < 0.05; wSignificant (p < .05) within-group change from baseline, p = .0017 for coefficient of variation and p = .0039 for mean amplitude of glucose excursions. B Significant (p = .0440) between-group difference at time point. Cohen’s d is interpreted as 0.20 small, 0.50 medium, and 0.80 large.
Table 3:
Descriptive and inferential statistics for secondary diabetes psychological outcomes
| Baseline(a) | Post(b) | 3-Month(b) | Cohen’s d (95% Confidence Interval)(c) | |||||
|---|---|---|---|---|---|---|---|---|
| M (N) | SE | M (N) | SE | M (N) | SE | BL to Post | BL to 3-Month | |
| Diabetes Distress G x T p-value = .0756 | ||||||||
| CB-Sleep Health | 33.57 (21) | 3.21 | 30.56 (18) | 2.03 | 26.98W, B (17) | 2.06 | −0.16 (−0.68, 0.32) | −0.42 (−1.01, 0.06) |
| Attention Control | 35.28 (18) | 3.46 | 33.06 (13) | 2.35 | 34.68 (14) | 2.30 | 0.02 (−0.58, 0.62) | 0.12 (−0.44, 0.71) |
| Between-group difference | −1.71 | 4.72 | −2.50 | 3.12 | −7.70 | 3.10 | ||
| General Distress G x T p-value = .0826 | ||||||||
| CB-Sleep Health | 52.10 (21) | 2.15 | 53.27 (18) | 2.06 | 50.82 (17) | 2.11 | 0.06 (−0.43, 0.57) | −0.20 (−0.74, 0.29) |
| Attention Control | 55.98 (18) | 2.33 | 51.52 (13) | 2.41 | 55.64 (14) | 2.33 | −0.11 (−0.73, 0.47) | 0.27 (−0.27, 0.90) |
| Between-group difference | −3.88 | 3.17 | 1.75 | 3.17 | −4.82 | 3.15 | ||
| Diabetes Quality of Life G x T p-value = .0255 | ||||||||
| CB-Sleep Health | 58.14 (21) | 1.79 | 59.70 (18) | 1.32 | 60.46 (17) | 1.34 | 0.25 (−0.23, 0.78) | 0.36 (−0.11, 0.92) |
| Attention Control | 56.33 (18) | 1.94 | 60.50 (13) | 1.53 | 57.47 (14) | 1.50 | 0.24 (−0.32, 0.90) | −0.06 (−0.64, 0.51) |
| Between-group difference | 1.81 | 2.64 | −0.80 | 2.03 | 2.99 | 2.02 | ||
Note: (N), number of participants.
Observed mean and standard error (SE).
Model-based estimated means and SEs from linear mixed modeling.
Calculated as mean within-participant change divided by group-specific baseline standard deviation.
Number in analytic sample denoted by (n). Hedges’ bias correction applied. Bolded mean value indicates p < 0.05; wSignificant (p < .01) within-group change from baseline. B Significant (p < 0.01) between-group difference at time point. Cohen’s d is interpreted as 0.20 small, 0.50 medium, and 0.80 large. Table 3, diabetes distress: W p-value = .0089 for 3-month mean within-participant change from baseline to CB-Sleep Health condition; B p-value = .0194 for between-condition mean difference at 3 months.
In sensitivity analyses, we repeated the linear mixed modeling analyses after employing last observation carried forward imputation of missing outcome values at immediately post-intervention and 3 months.
3.6. Data and Resource Availability Statement
The datasets generated during and/or analyzed in the current study are available from the corresponding author upon reasonable request
4. Results
4.1. Participant Characteristics
A total of 39 participants were included in the final sample, divided into two groups: 21 in the CB-Sleep Health condition and 18 in the Attention Control condition (Table 1). Throughout the study's follow-up visits, all but 6 participants remained, resulting in an 85% retention rate. At the time of enrollment, the mean age of participants was 21.08 years, with a standard deviation of 2.24 years. Of the sample, 41% were female, 71.8% identified as Non-Hispanic White, 15.4% as Non-Hispanic Black, 2.6% as Non-Hispanic Asian, 2.6% as Hispanic White, and 2.6% as Hispanic Black. The mean BMI was 25.87 (SD = 5.6) kg/m2, and the mean T1D duration was 11.68 (SD = 4.8) years. There were no significant differences between the two groups in terms of demographic or clinical variables. The mean HbA1C was 8.46 (SD = 1.79) %, glucose management indicator 8.16 (SD = 0.95) %, time in range (70–180 mg/dL) 44.08 (SD = 18.65) %, coefficient of variation 36.31 (SD = 4.80) %, and mean amplitude of glucose excursions 130.87 (SD = 4.80) mg/dL. For the psychological variables, the mean diabetes distress score was 34.6 (SD = 14.53) with 61.3% meeting the cutoff for moderate diabetes distress and 27.4% meeting the cutoff for severe diabetes distress. The mean general distress score was 48.9 (SD = 7.2), with 28.9% meeting the cutoff for moderate general distress, and the mean diabetes quality of life score was 57.31 (SD = 8.15). There were no significant differences between conditions for these outcome variables of interest. Compared with other participants, the 6 participants with follow-up dropout had a longer mean duration of Type 1 diabetes (13.2 years versus 11.6 years, p=.6926), a higher baseline HbA1C (8.75 versus 7.9, p=.6926), and a lower baseline time in range (40.0 versus 46.9, p=.9068). Analyses adjusted for baseline outcome values.
Table 1:
Pretreatment Clinical Characteristics of Randomized Participants by Condition (N = 39)
| Demographic Characteristics | CB-Sleep Health | (N = 21) | Attention Control | (N = 18) | P value |
|---|---|---|---|---|---|
| Sex, n (%) | .688 | ||||
| Male | 13 | (61.9) | 10 | (55.6) | |
| Female | 8 | (38.1) | 8 | (44.4) | |
| Age, M (SD) | 20.95 | (2.16) | 21.22 | (2.39) | .681 |
| Race x Ethnicity (%) | .777 | ||||
| Non-Hispanic White | 16 | (76.2) | 12 | (66.7) | |
| Non-Hispanic Black | 3 | (14.3) | 3 | (16.7) | |
| Non-Hispanic Asian | 1 | (4.8) | 0 | (0) | |
| Hispanic White | 0 | (0) | 1 | (5.6) | |
| Hispanic Black | 0 | (0) | 1 | (5.6) | |
| College student (%yes) | 8 | (38.1) | 10 | (55.6) | .276 |
| Clinical Characteristics | |||||
| T1D Duration, Mean (SD) | 11.38 | (4.91) | 12.06 | (4.68) | .521 |
| Insulin pump (%yes) | 14 | (66.7) | 14 | (77.8) | .442 |
| A1C, Mean (SD) | 8.43 | (1.57) | 8.51 | (2.06) | .895 |
| Time in Range, Mean (SD) | 43.11 | (19.66) | 45.40 | (17.82) | .367 |
| Body mass index (kg/m2), Mean (SD) | 25.02 | (5.36) | 25.70 | (6.10) | .865 |
Note: Time in Range 70–180 mg/dL measured by continuous glucose monitor
4.2. Outcomes
4.2.1. Sleep Outcomes
Actigraphy-derived sleep variables, including sleep duration, sleep efficiency, and regularity, did not significantly differ between groups at baseline. For the CB-Sleep Health group vs. the Attention Control group, sleep duration was 6 hours 24 minutes vs. 6 hours 56 minutes at baseline (T0), 6 hours 46 minutes vs. 6 hours 10 minutes immediately post-intervention (T2), and 6 hours 50 minutes vs. 6 hours 18 minutes 3 months post-intervention (T3), respectively. There was a significant increase in sleep duration for the CB-Sleep Health group, while there was a significant decrease in sleep duration for the Attention Control group (p < .01) (sleep duration 6 hours 24 minutes vs. 6 hours 56 minutes at baseline (T0), 6 hours 46 minutes vs. 6 hours 10 minutes immediately post-intervention (T2), and 6 hours 50 minutes vs. 6 hours 18 minutes 3 months post-intervention (T3), respectively. For both groups (CB-Sleep Health vs. Attention Control, respectively), sleep efficiency was stable across time points (85.6% vs. 84.7% at T0, 85.8% vs. 84.0% at T2, and 85.9% vs. 84.6% at T3). Unexpectedly, sleep regularity was significantly worse for the CB-Sleep Health group immediately post-intervention (interdaily stability 0.41 at T0 to 0.31 at T2); however, there were no further declines at T3 (interdaily stability 0.31). In contrast, there was not a significant change in interdaily stability for the Attention Control Condition (0.50 at T0, 0.37 at T2, and 0.43 at T3).
4.2.2. Glycemic outcomes
Descriptive and inferential statistics for all glycemic outcomes are depicted in Table 2, and estimated marginal means for HbA1C are depicted in Figure 2a. There were moderate to large improvements 3 months post intervention in short term glycemic outcomes including coefficient of variation (d = −0.89, p = .002) (Figure 2b) and mean amplitude of glucose excursions (d = −0.61, p = .004), in the CB-Health condition; consistent with the latter result, the between-group difference at 3 months was statistically significant (mean difference=-19.00, p=.0440). There were small to moderate improvements in the long-term glycemic outcome (HbA1C). There was a moderate effect (decrease) in HbA1C immediately post-intervention in the CB-Sleep Health condition (d = −0.45, p =.054) compared to a small nonsignificant worsening in the Attention Control condition (d = 0.06, p = .739) (H1). There was a small within-participant improvement (not significant) in GMI from baseline to immediate post-intervention for both conditions (d = −0.09, p = 0.623 and −0.20, p = 0.467, respectively).
Figure 2a. Primary Outcome Glycated Hemoglobin Estimated Marginal Means.

The graph highlights the differences in glycated hemoglobin measurements, indicating how the cognitive behavioral sleep and circadian condition depicted by the solid line impacts glycated hemoglobin compared to the attention control group depicted by the dotted line.
Figure 2b. Primary Outcome Coefficient of Variation Estimated Marginal Means.

The graph highlights the differences in coefficient of variation measurements, indicating how the cognitive behavioral sleep and circadian condition depicted by the solid line impacts coefficient of variation compared to the attention control group depicted by the dotted line.
4.2.3. Psychological outcomes
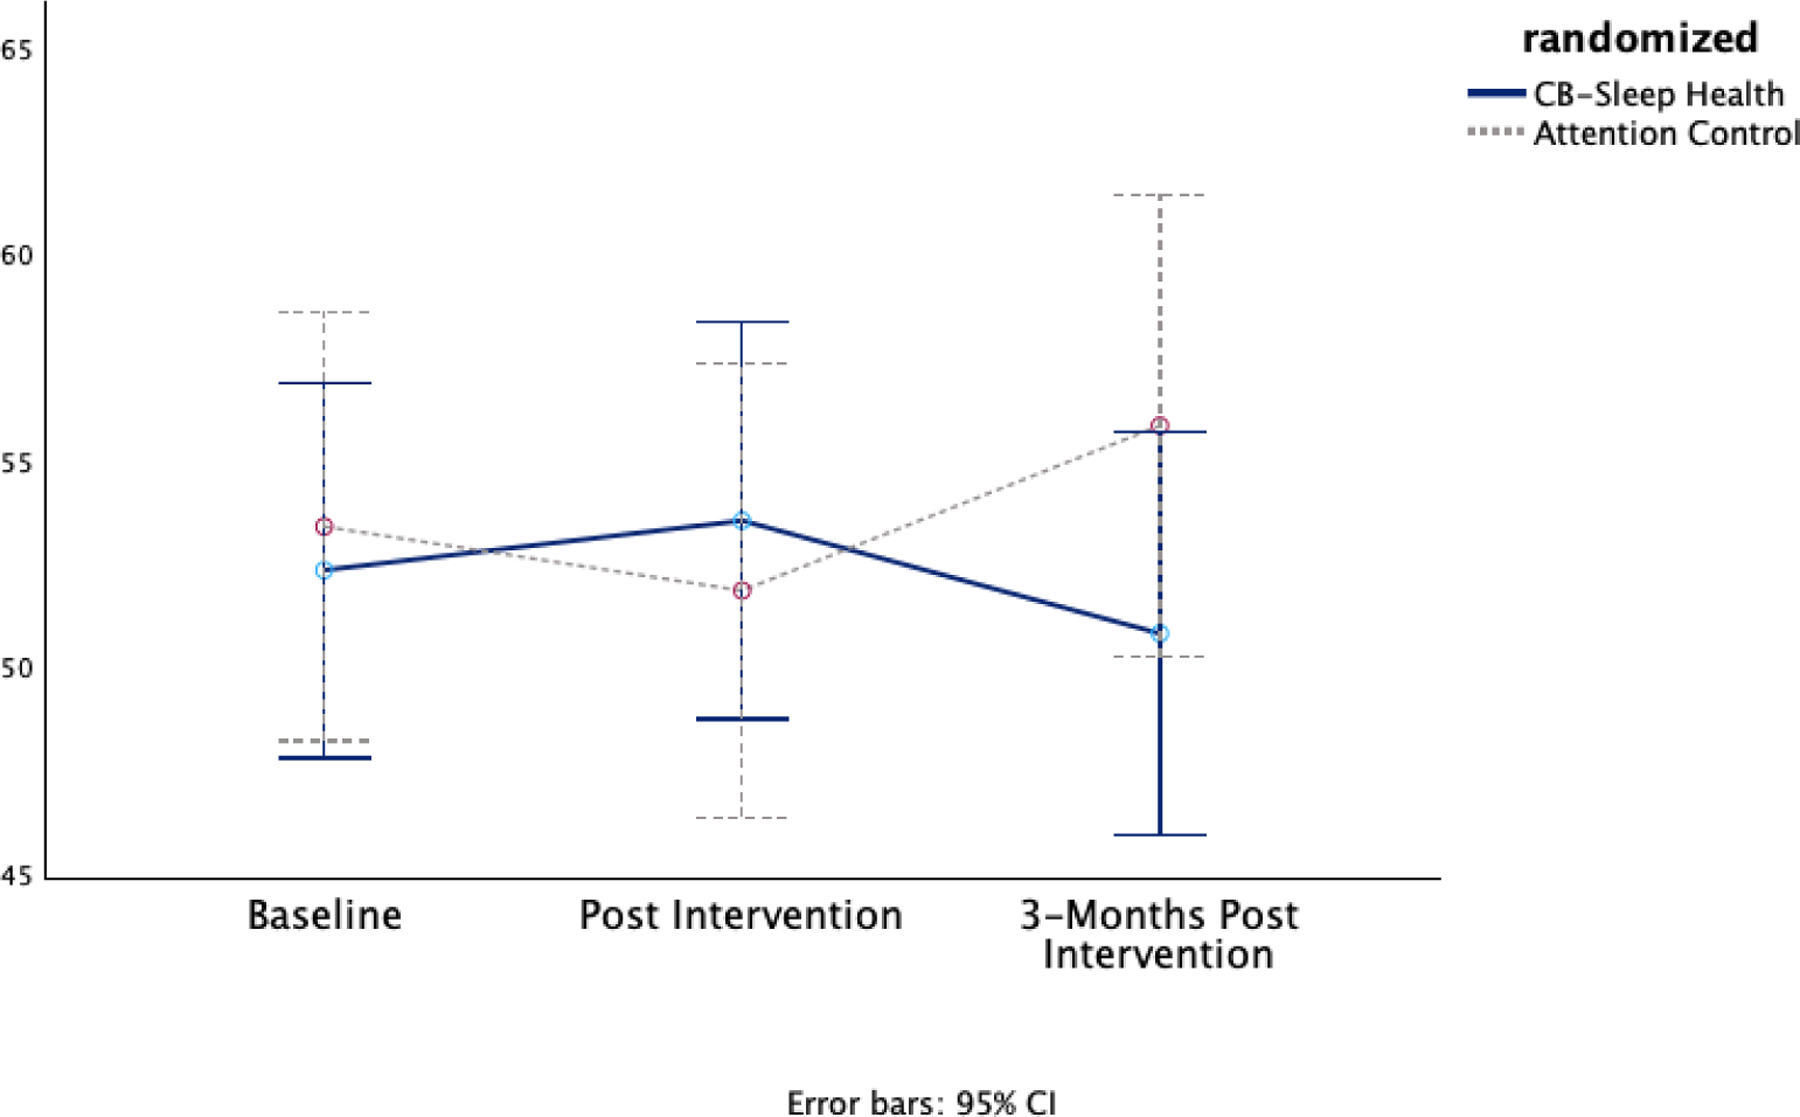
Descriptive and inferential statistics for psychological outcomes are presented in Table 3. In the CB-Sleep Health condition, there were improvements in diabetes distress at both time points, starting with a small, not statistically significant decrease from baseline to post-intervention (d = −0.16, p = .284), followed by a moderate statistically significant decrease at the 3-month follow-up (d = −0.42, p = .009). In contrast, the baseline-adjusted within-participant changes in diabetes distress in the Attention Control condition were slightly elevated – i.e., slight worsening– and not statistically significant (d = 0.02, p = .905 at post-intervention and d = 0.12, p = .412 at 3 months) (Figure 2c).
Figure 2c. Secondary Outcome Diabetes Distress Estimated Marginal Means.

The graph highlights the differences in diabetes distress measurements, indicating how the cognitive behavioral sleep and circadian condition depicted by the solid line impacts diabetes distress compared to the attention control group depicted by the dotted line.
There was minimal within-participant change in general distress for both conditions at both time points (Figure 2d). There was a small nonsignificant positive effect on diabetes quality of life in the CB-Sleep Health condition from baseline to post-intervention (Cohen’s d = 0.25, p = 0.223) and at the 3-month follow-up (Cohen’s d = 0.36, p = .083) (Figure 2e). There was a small nonsignificant effect of diabetes quality of life for the Attention Control condition immediately post and 3 months post intervention (Cohen’s d = 0.24, p = .121 and −0.06, p = .705 respectively).
Figure 2d. Secondary Outcome General Distress Marginal Means.
The graph highlights the differences in general distress measurements, indicating how the cognitive behavioral sleep and circadian condition depicted by the solid line impacts general distress compared to the attention control group depicted by the dotted line.
Figure 2e. Secondary Outcome Diabetes Quality of Life Marginal Means.

The graph highlights the differences in diabetes quality of life measurements, indicating how the cognitive behavioral sleep and circadian condition depicted by the solid line impacts diabetes quality of life compared to the attention control group depicted by the dotted line.
4.2.4. Sensitivity analyses
Results from the imputation of missing outcome values using last observation carried forward were highly consistent with corresponding results in Tables 2 and 3. An exception was the mean 3-month between-condition difference for mean amplitude of glucose excursions; the estimated mean participant decline in the CB-Sleep Health group was somewhat smaller with LOCF, resulting in a non-statistically significant difference versus the Attention Control condition (p = .2594, versus p = .0440 in Table 2). The direction of the between-condition difference, however, was consistent with Table 2 results, i.e., a larger (and statistically significant) decline in the CB-Sleep Health condition compared with the Attention Control condition.
5. Discussion
This is the first pilot study where the efficacy of a cognitive-behavioral sleep intervention was tested in young adults aged 18–26 years with Type 1 Diabetes, demonstrating significant improvements in both glycemic and psychological outcomes, thereby addressing an under-researched area of diabetes management. The results supported our primary hypothesis, showing a positive effect on long-term (HbA1C and GMI) and short-term (time in range and mean amplitude of glucose excursions) glycemic outcomes, favoring the CB-Sleep Health condition. Improving HbA1C is crucial as it helps prevent long-term complications, while reducing glycemic variability (aiming for a coefficient of variation below 36%) can delay complications by minimizing hypoglycemia risk. Additionally, CB-Sleep Health showed higher preliminary efficacy in improving psychological outcomes, such as diabetes distress and quality of life, compared to the attention control condition. However, both interventions had limited and varied impacts on general distress scores.
Cognitive behavioral therapies (CBT) have been used in multiple randomized control trials (RCTs) and pilot studies to address modifiable risk factors related to internalizing problems (e.g., stress arousal, emotional processing, and cognitive factors) (43). While CBT has been employed in this population, the benefits to both short- and long-term clinical outcomes are mixed. For instance, in a systematic review and meta-analysis of RCTs in T1D, long-term CBT (≥ 6 months) was associated with a significant reduction in HbA1C (44). However, when CBT was deployed for less than six months, it showed little to no benefit. Also, sleep behavior is not a focus of standard CBT interventions. Therefore, sleep behavior-focused CBT may be a valuable tool to improve the psychological and clinical outcomes of young adults with T1D when the intervention is administered for at least six months as a stand-alone therapy. There are not enough data currently to determine the length of CBT treatment encompassing sleep and circadian behavior.
Our primary hypothesis was that the 12-week CB-Sleep Health trial would improve chronic hyperglycemia (HbA1C) and short-term glucose variability. Consistent with this hypothesis, post-intervention and at the 3-month follow-up, CB-Sleep Health showed small to large improvements in long-term (HbA1C and GMI) and short-term (time in range, coefficient of variation, and mean amplitude of glucose excursions) glycemic outcomes. Compared to the attention control, CB-Sleep Health had moderate HbA1C improvements immediately post-intervention, with small to moderate positive effects on short-term glycemic outcomes. These results align with previous studies linking diabetes sleep education to improved glycemic control in adults with diabetes (44–46).
We examined psychological outcomes, including general and diabetes-related distress and diabetes quality of life, as secondary outcomes. The CB-Sleep Health group showed significant improvements in diabetes distress and quality of life at both post-intervention and the 3-month follow-up, with diabetes distress reductions bringing several participants below the moderate distress threshold of ≥30 on the Diabetes Distress Scale. This change is clinically significant, as lower diabetes distress is associated with better self-management. In contrast, the Attention Control group had mixed results with a lower diabetes distress score immediately post-intervention and a slight rebound at the 3-month follow-up. Contrary to the hypothesis, general distress did not show the same level of improvement, which may suggest that the intervention's focus was primarily on diabetes-specific issues rather than addressing broader psychological support needs. This indicates a potential gap in care that may require additional interventions targeting general mental health to enhance overall psychological well-being.
When comparing these findings to prior cognitive behavioral therapy (CBT) studies in T1D and other chronic conditions, the results align with previous research where diabetes-specific interventions led to notable improvements in diabetes distress but not necessarily in general distress levels (47). This emphasizes the importance of tailored interventions that address specific challenges faced by individuals with chronic illnesses while also recognizing the potential need for integrated psychological support strategies in order to address the broader emotional difficulties experienced by patients.
For diabetes quality of life, the CB-Sleep Health intervention consistently improved scores from baseline to post-intervention and further at the 3-month follow-up. However, the Attention Control condition showed an increase in quality of life post-intervention but a slight decrease at the 3-month follow-up, which was consistent with van der Ven et al.'s study, where it was determined that 3 months may not be enough time to apply CBT interventions with long-term gains (48).
4.1. Limitations
There are some limitations to consider when interpreting the results and applying them to broader populations and contexts. First, this was a pilot study focused on feasibility and efficacy; therefore, the restricted sample size limits our ability to draw definitive conclusions or detect potentially meaningful effects across all outcomes. We acknowledge that scaling the study in future work could strengthen the implications of our findings. Also, we were unable to measure whether there were differences in delivery (in-person vs. telehealth) due to the small cell count for telehealth delivery. Second, although the study design was randomized, we recognize the potential impact of unmeasured confounding factors, particularly due to the diversity in participants' sleep habits, T1D self-management practices, and lifestyle variations. Moreover, the recruitment of participants from diabetes specialty clinics may limit the sample by excluding young adults with T1D who are managed by primary care and those who do not receive routine care. Finally, the 6-month study duration with a 3-month follow-up period post-intervention may not have captured the long-term effects of the intervention on glycemic and psychological health outcomes. Therefore, incorporating a follow-up period of 6 to 12 months in future studies would be beneficial for establishing the sustained impact of the intervention.
Strengths of the study include the strict inclusion criteria, employment of randomization, and blinding of the statistician responsible for generating the randomization sequence and analyzing the outcomes. Additionally, we excluded individuals with potential confounding factors such as pregnancy, other complex medical or psychiatric conditions, and cases with severe circadian misalignment, such as night shift work. This minimized the impact of selection and outcome biases, thereby enhancing the internal validity of the study findings. The inclusion of an Attention Control condition also helped offset any potential changes over time and common threats to internal validity (e.g., maturation, history). By comparing the results to a baseline, we were better positioned to estimate the effects of the intervention with more precision and accuracy.
6. Conclusion
Overall, the results indicate that the CB-Sleep Health intervention had a positive impact on glycemic outcomes, particularly in the short-term, and more consistent and substantial improvements in diabetes distress and quality of life compared to the Attention Control condition. The preliminary findings highlight the importance of incorporating cognitive-behavioral sleep and circadian health interventions into diabetes self-management education programs and routine care to improve glycemic health and psychological well-being. These findings underscore CB-Sleep Health as a promising intervention for enhancing glycemic and psychological clinical outcomes in a unique population of young adults with T1D, suggesting its potential utility in clinical practice and further research.
A larger powered trial with a more diverse sample in terms of age, race, and other socioeconomic factors, including additional observation points over a longer period (3–6 months), and carefully designed inclusion criteria to ensure both internal and external validity, would offer better insight into the effectiveness of the intervention and offer wider generalizability of the results. In addition, conducting longer-term follow-up studies would provide a more comprehensive understanding of the potentially lasting effects of the CB-Sleep Health intervention.
7. Clinical relevence
Partnering with community clinics, especially those serving underrepresented populations, could facilitate access to a broader spectrum of participants. This approach would not only boost sample diversity but could also help illuminate potential cultural differences in sleep practices and diabetes management barriers that may affect outcomes. This cognitive behavioral intervention could be implemented by diabetes care clinicians such as nurses, physicians, and social workers as part of normal diabetes care. These interactions could be added to regular in-person or telehealth visits, or as stand-alone appointments. By adding this intervention to regular care visits, the exposure to the intervention could be increased beyond the 3-month time frame of the current study, which may further increase the benefits.
Table 4:
Sensitivity analysis of last observation carried forward for glycemic health outcomes
| Baseline(a) | Post(b) | 3-Month(b) | ||||
|---|---|---|---|---|---|---|
| M (N) | SE | M (N) | SE | M (N) | SE | |
| Long-Term Glycemic Outcomes | ||||||
| Glycated Hemoglobin A1C (%) G x T p-value = .6241 | ||||||
| CB-Sleep Health | 8.43 (21) | 0.39 | 8.03 | 0.29 | 8.10 | 0.29 |
| Attention Control | 8.51 (18) | 0.43 | 8.52 | 0.31 | 8.45 | 0.31 |
| Between-group difference | −0.08 | 0.58 | −0.49 | 0.42 | −0.35 | 0.42 |
| Glucose Management Indicator (%) G x T p-value = .6842 | ||||||
| CB-Sleep Health | 8.22 (19) | 0.22 | 8.11 | 0.15 | 8.33 | 0.15 |
| Attention Control | 8.07 (14) | 0.26 | 8.00 | 0.17 | 8.11 | 0.17 |
| Between-group difference | 0.14 | 0.34 | 0.11 | 0.22 | 0.22 | 0.22 |
| Short-Term Glycemic Outcomes | ||||||
| Time in Range (% time in range: 70–180mg/dL) G x T p-value = .6489 | ||||||
| CB-Sleep Health | 43.11 (19) | 4.35 | 44.60 | 2.83 | 40.96 | 2.83 |
| Attention Control | 45.81 (14) | 5.07 | 46.60 | 3.30 | 45.25 | 3.30 |
| Between-group difference | −2.70 | 6.68 | −1.99 | 4.35 | −4.29 | 4.35 |
| Coefficient of Variation (%) G x T p-value = .2708 | ||||||
| CB-Sleep Health | 36.02 (19) | 1.12 | 35.80 | 1.04 | 32.47W | 1.04 |
| Attention Control | 36.33 (14) | 1.31 | 36.85 | 1.21 | 35.59 | 1.21 |
| Between-group difference | −0.31 | 1.72 | −1.05 | 1.59 | −3.12 | 1.59 |
| Mean Amplitude of Glucose Excursions G x T p-value = .2065 | ||||||
| CB-Sleep Health | 134.60 (19) | 6.22 | 129.36 | 5.13 | 118.79W | 5.13 |
| Attention Control | 126.67 (14) | 7.24 | 127.63 | 5.98 | 127.87 | 5.98 |
| Between-group difference | 7.93 | 9.55 | 1.73 | −0.85 | −9.08 | −0.85 |
Note: Primary analysis presented in Table 2.
Table 5:
Sensitivity analysis of last observation carried forward for psychological outcomes
| Baseline(a) | Post(b) | 3-Month(b) | ||||
|---|---|---|---|---|---|---|
| M (N) | SE | M (N) | SE | M (N) | SE | |
| Diabetes Distress G x T p-value = .0825 | ||||||
| CB-Sleep Health | 33.57 (21) | 3.21 | 32.81 | 1.74 | 29.86W,B | 1.74 |
| Attention Control | 35.28 (18) | 3.46 | 34.44 | 1.88 | 35.44 | 1.88 |
| Between-group difference | −1.71 | 4.72 | −1.63 | 2.57 | −5.58 | 2.57 |
| General Distress G x T p-value = .0790 | ||||||
| CB-Sleep Health | 52.10 (21) | 2.15 | 54.26 | 1.76 | 52.04 | 1.76 |
| Attention Control | 55.98 (18) | 2.33 | 53.47 | 1.91 | 56.41 | 1.96 |
| Between-group difference | −3.88 | 3.17 | 0.79 | 2.61 | −4.37 | 2.61 |
| Diabetes Quality of Life G x T p-value = .0681 | ||||||
| CB-Sleep Health | 58.14 (21) | 1.79 | 58.71 | 1.19 | 59.33 | 1.19 |
| Attention Control | 56.33 (18) | 1.94 | 58.73 | 1.28 | 56.84 | 1.28 |
| Between-group difference | 1.81 | 2.64 | −0.02 | 1.75 | 2.49 | 1.75 |
Note: Primary analysis presented in Table 3.
Highlights.
Young adults with type 1 diabetes often experience insufficient sleep duration and inconsistent sleep timing, yet behavioral interventions to improve these issues are limited.
The cognitive behavioral sleep and circadian intervention improved glycemic outcomes and reduced diabetes distress. In contrast, the control group showed no notable changes.
These results should be confirmed with a larger population and longer follow up period.
Acknowledgments:
There were no third-party writers or external authorship involved in the generation of this manuscript.
Funding:
SG is funded by the National Institute of Nursing Research (NINR) R00NR018886 and the National Institute of Diabetes and Digestive and Kidney Diseases (NIDDK) R01DK136604. Its contents are solely the responsibility of the authors and do not necessarily represent the official view of NIH.
Declaration of Interest Statement:
Stephanie A. Griggs reports financial support for salary was provided by National Institute of Nursing Research. Stephanie A. Griggs reports financial support for salary was provided by National Institute of Diabetes and Digestive and Kidney Diseases. Sybil L. Crawford reports financial support for salary was provided by National Institute of Nursing Research. Sybil L. Crawford reports financial support for salary was provided by National Institute of Diabetes and Digestive and Kidney Diseases. Kingman P. Strohl reports financial support was provided for salary by National Institute of Diabetes and Digestive and Kidney Diseases. Jamie R. Wood reports financial support for salary was provided by National Institute of Diabetes and Digestive and Kidney Diseases. Ronald L. Hickman reports financial support for salary was provided by National Institute of Diabetes and Digestive and Kidney Diseases. If there are other authors, they declare that they have no known competing financial interests or personal relationships that could have appeared to influence the work reported in this paper.
Footnotes
AI-written text: During the preparation of this work the author(s) used Grammarly and the built in Microsoft Office Editor tool in order to proofread the manuscript for grammatical errors and clarity. After using this tool/service, the author(s) reviewed and edited the content as needed and take(s) full responsibility for the content of the publication.
Ethical statement: The PI obtained institutional review board approval from University Hospitals (STUDY20211165).
Contributor Information
Bethany L. Armentrout, Case Western Reserve University, Frances Payne Bolton School of Nursing, Cleveland, OH, USA 44106.
Megan L. Wenzell, Case Western Reserve University, Frances Payne Bolton School of Nursing, Cleveland, OH, USA 44106.
Kingman P. Strohl, Case Western Reserve University, School of Medicine, Cleveland, OH, USA 44106.
Sybil L. Crawford, University of Massachusetts Chan Medical School, Tan Chingfen Graduate School of Nursing, Worcester, MA, USA 01655.
Jamie R. Wood, Case Western Reserve University, School of Medicine, Pediatric Endocrinology, University Hospitals Rainbow Babies and Children’s Hospital, Cleveland, OH, USA 44106.
Chiang-shan R. Li, Yale University, School of Medicine, New Haven, Connecticut, USA 06519.
Ronald L. Hickman, Jr, Case Western Reserve University, Frances Payne Bolton School of Nursing, Cleveland, OH, USA 44106.
Stephanie Alisha Griggs, Case Western Reserve University, Frances Payne Bolton School of Nursing, Cleveland, OH, USA 44106.
References
- 1.D’Souza D, Empringham J, Pechlivanoglou P, Uleryk EM, Cohen E, Shulman R. Incidence of Diabetes in Children and Adolescents During the COVID-19 Pandemic: A Systematic Review and Meta-Analysis. JAMA Netw Open [Internet]. 2023. Jun 1 [cited 2024 Aug 2];6(6):e2321281–e2321281. Available from: https://jamanetwork.com/journals/jamanetworkopen/fullarticle/2806712 [DOI] [PMC free article] [PubMed] [Google Scholar]
- 2.Foster NC, Beck RW, Miller KM, Clements MA, Rickels MR, Dimeglio LA, et al. State of Type 1 Diabetes Management and Outcomes from the T1D Exchange in 2016–2018. Diabetes Technol Ther [Internet]. 2019. Feb 1 [cited 2024 Jan 13];21(2):66–72. Available from: https://www.liebertpub.com/doi/10.1089/dia.2018.0384 [DOI] [PMC free article] [PubMed] [Google Scholar]
- 3.Goyal A, Peerzada A, Sarteau AC, Praveen PA, Kalaivani M, Tandon N. A multi-center pediatric to adult care transition intervention program to improve clinic visit adherence and clinical outcomes among adolescents and emerging adults with type 1 diabetes mellitus [PATHWAY]: Protocol for a randomized controlled trial. Contemp Clin Trials [Internet]. 2022. Aug 1 [cited 2025 Feb 13];119. Available from: https://pubmed.ncbi.nlm.nih.gov/35724840/ [Google Scholar]
- 4.Garvey KC, Markowitz JT, Laffel LMB. Transition to adult care for youth with type 1 diabetes. Curr Diab Rep [Internet]. 2012. Oct [cited 2025 Feb 13];12(5):533–41. Available from: https://pubmed.ncbi.nlm.nih.gov/22922877/ [DOI] [PMC free article] [PubMed] [Google Scholar]
- 5.Cristello Sarteau A, Peerzada A, Goyal A, Praveen PA, Tandon N. Development and design of the first structured clinic-based program in lower resource settings to transition emerging adults with type 1 diabetes from pediatric to adult care. PLOS global public health [Internet]. 2022. Aug 3 [cited 2025 Feb 13];2(8):e0000665. Available from: https://pubmed.ncbi.nlm.nih.gov/36962558/ [DOI] [PMC free article] [PubMed] [Google Scholar]
- 6.Borel AL, Pépin JL, Nasse L, Baguet JP, Netter S, Benhamou PY. Short Sleep Duration Measured by Wrist Actimetry Is Associated With Deteriorated Glycemic Control in Type 1 Diabetes. Diabetes Care. 2013. Oct 1;36(10):2902–8. [DOI] [PMC free article] [PubMed] [Google Scholar]
- 7.Van Cauter E, Spiegel K, Tasali E, Leproult R. Metabolic consequences of sleep and sleep loss. Sleep Med. 2008. Sep 1;9(SUPPL. 1):S23–8. [DOI] [PMC free article] [PubMed] [Google Scholar]
- 8.Edinger JD, Arnedt JT, Bertisch SM, Carney CE, Harrington JJ, Lichstein KL, et al. Behavioral and psychological treatments for chronic insomnia disorder in adults: an American Academy of Sleep Medicine clinical practice guideline. Journal of Clinical Sleep Medicine [Internet]. 2021. Feb 1 [cited 2024 Aug 29];17(2):255–62. Available from: https://jcsm.aasm.org/doi/10.5664/jcsm.8986 [DOI] [PMC free article] [PubMed] [Google Scholar]
- 9.Harvey AG, Sarfan LD. State of the Science: The Transdiagnostic Intervention for Sleep and Circadian Dysfunction. Behav Ther. 2024. Mar 4; [Google Scholar]
- 10.Inkster BE, Zammitt NN, Ritchie SJ, Deary IJ, Morrison I, Frier BM. Effects of Sleep Deprivation on Hypoglycemia-Induced Cognitive Impairment and Recovery in Adults With Type 1 Diabetes. Diabetes Care [Internet]. 2016. May 1 [cited 2024 Aug 22];39(5):750–6. Available from: 10.2337/dc15-2335 [DOI] [PubMed] [Google Scholar]
- 11.Rossman J Cognitive-Behavioral Therapy for Insomnia: An Effective and Underutilized Treatment for Insomnia. 10.1177/1559827619867677 [Internet]. 2019. Aug 12 [cited 2024 Aug 29];13(6):544–7. Available from: https://journals.sagepub.com/doi/abs/10.1177/1559827619867677 [DOI] [Google Scholar]
- 12.Jaser SS, Hamburger ER, Bergner EM, Williams R, Slaughter JC, Simmons JH, et al. Sleep coach intervention for teens with type 1 diabetes: Randomized pilot study. Pediatr Diabetes. 2020. May 11;21(3):473–8. [DOI] [PMC free article] [PubMed] [Google Scholar]
- 13.Perfect MM, Silva GE, Chin CN, Wheeler MD, Frye SS, Mullins V, et al. Extending sleep to improve glycemia: The Family Routines Enhancing Adolescent Diabetes by Optimizing Management (FREADOM) randomized clinical trial protocol. Contemp Clin Trials. 2023. Jan 1;124:106929. [DOI] [PubMed] [Google Scholar]
- 14.Martyn-Nemeth P, Duffecy J, Quinn L, Steffen A, Baron K, Chapagai S, et al. Sleep-Opt-In: A Randomized Controlled Pilot Study to Improve Sleep and Glycemic Variability in Adults With Type 1 Diabetes. The Science of Diabetes Self-Management and Care. 2023. Feb 1;49(1):11–22. [DOI] [PMC free article] [PubMed] [Google Scholar]
- 15.Monaghan M, Helgeson V, Wiebe D. Type 1 Diabetes in Young Adulthood. Curr Diabetes Rev. 2015. Jul 29;11(4):239–50. [DOI] [PMC free article] [PubMed] [Google Scholar]
- 16.Jaser SS, Bergner EM, Hamburger ER, Bhatia S, Lyttle M, Bell GE, et al. Pilot Trial of a Sleep-Promoting Intervention for Children With Type 1 Diabetes. J Pediatr Psychol. 2021. Mar 18;46(3):304–13. [DOI] [PMC free article] [PubMed] [Google Scholar]
- 17.Hertzog MA. Considerations in determining sample size for pilot studies. Res Nurs Health [Internet]. 2008. Apr 1 [cited 2024 Jul 29];31(2):180–91. Available from: https://onlinelibrary.wiley.com/doi/full/10.1002/nur.20247 [DOI] [PubMed] [Google Scholar]
- 18.Sim J, Lewis M. The size of a pilot study for a clinical trial should be calculated in relation to considerations of precision and efficiency. J Clin Epidemiol. 2012. Mar 1;65(3):301–8. [DOI] [PubMed] [Google Scholar]
- 19.Lancaster GA, Dodd S, Williamson PR. Design and analysis of pilot studies: recommendations for good practice. J Eval Clin Pract [Internet]. 2004. May 1 [cited 2024 Jul 29];10(2):307–12. Available from: https://onlinelibrary.wiley.com/doi/full/10.1111/j..2002.384.doc.x [DOI] [PubMed] [Google Scholar]
- 20.Bronner MB, Peeters MAC, Sattoe JNT, Van Staa AL. The impact of type 1 diabetes on young adults’ health-related quality of life. Health Qual Life Outcomes [Internet]. 2020. May 12 [cited 2024 Jan 12];18(1):1–7. Available from: https://hqlo.biomedcentral.com/articles/10.1186/s12955-020-01370-8 [DOI] [PMC free article] [PubMed] [Google Scholar]
- 21.Garvey K, Wolpert H, Laffel L, Rhodes E, Wolfsdorf J, Finkelstein J. Health care transition in young adults with type 1 diabetes: barriers to timely establishment of adult diabetes care. Endocr Pract [Internet]. 2013. Nov 1 [cited 2024 Jan 12];19(6):946. Available from: /pmc/articles/PMC4034180/ [DOI] [PMC free article] [PubMed] [Google Scholar]
- 22.Monk TH, Reynolds CF, Kupfer DJ, Buysse DJ, Coble PA, Hayes AJ, et al. The Pittsburgh Sleep Diary. J Sleep Res [Internet]. 1994. Jun 1 [cited 2024 Jan 13];3(2):111–20. Available from: https://onlinelibrary.wiley.com/doi/full/10.1111/j.1365-2869.1994.tb00114.x [Google Scholar]
- 23.Comparison of sleep endpoints Actiwatch Spectrum Plus and Actiwatch Spectrum PRO vs. Actiwatch Spectrum.
- 24.Grutsch JF, Wood PA, Du-Quiton J, Reynolds JL, Lis CG, Levin RD, et al. Validation of actigraphy to assess circadian organization and sleep quality in patients with advanced lung cancer. 2011. [cited 2024 Jan 13]; Available from: http://www.jcircadianrhythms.com/content/9/1/4 [Google Scholar]
- 25.Griggs S, Strohl KP, Grey M, Barbato E, Margevicius S, Hickman RL. Circadian characteristics of the rest-activity rhythm, executive function, and glucose fluctuations in young adults with type 1 diabetes. Chronobiol Int. 2021. Oct 3;38(10):1477–87. [DOI] [PMC free article] [PubMed] [Google Scholar]
- 26.Harvey AG, Hein K, Dong L, Smith FL, Lisman M, Yu S, et al. A transdiagnostic sleep and circadian treatment to improve severe mental illness outcomes in a community setting: study protocol for a randomized controlled trial. Trials [Internet]. 2016. Dec 20 [cited 2024 Jan 13];17(1). Available from: https://pubmed.ncbi.nlm.nih.gov/27998295/ [Google Scholar]
- 27.Perfect MM, Silva GE, Chin CN, Wheeler MD, Frye SS, Mullins V, et al. Extending sleep to improve glycemia: The Family Routines Enhancing Adolescent Diabetes by Optimizing Management (FREADOM) randomized clinical trial protocol. Contemp Clin Trials [Internet]. 2023. Jan 1 [cited 2024 Jan 12];124. Available from: https://pubmed.ncbi.nlm.nih.gov/36441106/ [Google Scholar]
- 28.Griggs S, Conley S, Batten J, Grey M. A systematic review and meta-analysis of behavioral sleep interventions for adolescents and emerging adults. Sleep Med Rev. 2020;54. [Google Scholar]
- 29.Bastien CH, Vallières A, Morin CM. Validation of the insomnia severity index as an outcome measure for insomnia research. Sleep Med [Internet]. 2001. [cited 2024 Jul 6];2(4):297–307. Available from: https://pubmed.ncbi.nlm.nih.gov/11438246/ [DOI] [PubMed] [Google Scholar]
- 30.Szymezak J, Leroy N, Lavalard E, Gillery P. Evaluation of the DCA Vantage analyzer for HbA1c assay. Clin Chem Lab Med [Internet]. 2008. Aug 1 [cited 2024 Aug 1];46(8):1195–8. Available from: https://www.degruyter.com/document/doi/10.1515/CCLM.2008.228/html [DOI] [PubMed] [Google Scholar]
- 31.Bergenstal RM, Beck RW, Close KL, Grunberger G, Sacks DB, Kowalski A, et al. Glucose Management Indicator (GMI): A New Term for Estimating A1C From Continuous Glucose Monitoring. Diabetes Care [Internet]. 2018. Nov 1 [cited 2024 Jul 6];41(11):2275–80. Available from: 10.2337/dc18-1581 [DOI] [PMC free article] [PubMed] [Google Scholar]
- 32.Danne T, Nimri R, Battelino T, Bergenstal RM, Close KL, DeVries JH, et al. International consensus on use of continuous glucose monitoring. Diabetes Care [Internet]. 2017. Dec 1 [cited 2024 May 9];40(12):1631–40. Available from: /pmc/articles/PMC6467165/ [DOI] [PMC free article] [PubMed] [Google Scholar]
- 33.Terada T, Loehr S, Guigard E, McCargar LJ, Bell GJ, Senior P, et al. Test-retest reliability of a continuous glucose monitoring system in individuals with type 2 diabetes. Diabetes Technol Ther [Internet]. 2014. Aug 1 [cited 2024 Jul 6];16(8):491–8. Available from: https://pubmed.ncbi.nlm.nih.gov/24815725/ [DOI] [PMC free article] [PubMed] [Google Scholar]
- 34.Wagner J, Tennen H, Wolpert H. Continuous glucose monitoring: A review for behavioral researchers. Psychosom Med [Internet]. 2012. [cited 2024 Jul 6];74(4):356–65. Available from: https://journals.lww.com/psychosomaticmedicine/fulltext/2012/05000/continuous_glucose_monitoring__a_review_for.5.aspx [DOI] [PMC free article] [PubMed] [Google Scholar]
- 35.Polonsky WH, Fisher L, Earles J, Dudl RJ, Lees J, Mullan J, et al. Assessing psychosocial distress in diabetes: development of the diabetes distress scale. Diabetes Care [Internet]. 2005. Mar [cited 2024 Jul 6];28(3):626–31. Available from: https://pubmed.ncbi.nlm.nih.gov/15735199/ [DOI] [PubMed] [Google Scholar]
- 36.Pilkonis PA, Choi SW, Reise SP, Stover AM, Riley WT, Cella D. Item banks for measuring emotional distress from the Patient-Reported Outcomes Measurement Information System (PROMIS®): depression, anxiety, and anger. Assessment [Internet]. 2011. Sep [cited 2024 Jul 6];18(3):263–83. Available from: https://pubmed.ncbi.nlm.nih.gov/21697139/ [DOI] [PMC free article] [PubMed] [Google Scholar]
- 37.Burroughs TE, Desikan R, Waterman BM, Gilin D, McGill J. Development and Validation of the Diabetes Quality of Life Brief Clinical Inventory. Diabetes Spectrum [Internet]. 2004. Jan 1 [cited 2024 Jul 6];17(1):41–9. Available from: 10.2337/diaspect.17.1.41 [DOI] [Google Scholar]
- 38.Assmann SF, Pocock SJ, Enos LE, Kasten LE. Subgroup analysis and other (mis)uses of baseline data in clinical trials. Lancet [Internet]. 2000. Mar 25 [cited 2025 Feb 19];355(9209):1064–9. Available from: https://pubmed.ncbi.nlm.nih.gov/10744093/ [DOI] [PubMed] [Google Scholar]
- 39.Chuang-Stein C, Tong DM. The impact and implication of regression to the mean on the design and analysis of medical investigations. Stat Methods Med Res. 1997. Apr 2;6(2):115–28. [DOI] [PubMed] [Google Scholar]
- 40.Fitzmaurice GM, Laird NM, Ware JH. Applied Longitudinal Analysis [Internet]. Applied Longitudinal Analysis. John Wiley & Sons, Inc., Hoboken, New Jersey; 2011. [cited 2024 Jan 16]. 584–598 p. Available from: https://www.wiley.com/en-us/Applied+Longitudinal+Analysis%2C+2nd+Edition-p-9780470380277 [Google Scholar]
- 41.Goulet-Pelletier JC, Cousineau D. A review of effect sizes and their confidence intervals, Part I: The Cohen’s d family. Quant Method Psychol. 2018. Dec 1;14(4):242–65. [Google Scholar]
- 42.Lakens D Calculating and reporting effect sizes to facilitate cumulative science: A practical primer for t-tests and ANOVAs. Front Psychol [Internet]. 2013. Nov 26 [cited 2024 Aug 8];4(NOV):62627. Available from: www.frontiersin.org [Google Scholar]
- 43.Cowie H Sleep difficulties and interventions: Exploring links between sleep and mental health in adolescents and assessing adherence to Cognitive Behavioural Therapy for Insomnia. 2021;
- 44.Dong N, Wang X, Yang L. The short- and long-term effects of cognitive behavioral therapy on the glycemic control of diabetic patients: a systematic review and meta-analysis. Biopsychosoc Med [Internet]. 2023. Dec 1 [cited 2024 Aug 29];17(1):1–12. Available from: https://link.springer.com/articles/10.1186/s13030-023-00274-5 [DOI] [PMC free article] [PubMed] [Google Scholar]
- 45.Tiwari R, Tam DNH, Shah J, Moriyama M, Varney J, Huy NT. Effects of sleep intervention on glucose control: A narrative review of clinical evidence. Prim Care Diabetes [Internet]. 2021. Aug 1 [cited 2024 Aug 29];15(4):635–41. Available from: https://pubmed.ncbi.nlm.nih.gov/33849816/ [DOI] [PubMed] [Google Scholar]
- 46.García-Serrano C, Salud JP, Aran-Solé L, Sol J, Ortiz-Congost S, Artigues-Barberà E, et al. Enhancing Night and Day Circadian Contrast through Sleep Education in Prediabetes and Type 2 Diabetes Mellitus: A Randomized Controlled Trial. Biology 2022, Vol 11, Page 893 [Internet]. 2022 Jun 10 [cited 2024 Aug 29];11(6):893. Available from: https://www.mdpi.com/2079-7737/11/6/893/htm [DOI] [PMC free article] [PubMed] [Google Scholar]
- 47.Jenkinson E, Knoop I, Hudson JL, Moss-Morris R, Hackett RA. The effectiveness of cognitive behavioural therapy and third-wave cognitive behavioural interventions on diabetes-related distress: A systematic review and meta-analysis. Diabetic Medicine [Internet]. 2022. Nov 1 [cited 2025 Oct 7];39(11):e14948. Available from: https://onlinelibrary.wiley.com/doi/full/10.1111/dme.14948 [DOI] [PMC free article] [PubMed] [Google Scholar]
- 48.Van Der Ven NCW, Hogenelst MHE, Tromp-Wever AME, Twisk JWR, Van Der Ploeg HM, Heine RJ, et al. Short-term effects of cognitive behavioural group training (CBGT) in adult Type 1 diabetes patients in prolonged poor glycaemic control. A randomized controlled trial. Diabetic Medicine [Internet]. 2005. Nov 1 [cited 2024 Aug 29];22(11):1619–23. Available from: https://onlinelibrary.wiley.com/doi/full/10.1111/j.1464-5491.2005.01691.x [DOI] [PubMed] [Google Scholar]