

Abstract
Haploid Saccharomyces cells have the remarkable potential to change mating type as often as every generation, a process accomplished by an intrachromosomal gene conversion between an expressor locus MAT and one of two repositories of mating type information, HML or HMR. The particular locus selected as donor is dictated by the mating type of the cell, a bias that ensures productive mating type interconversion. Here we use green fluorescent protein tagging of the expressor and donor loci on chromo some III to show that this preference for donor locus does not result from a predetermined organization of chromosome III: HML and MAT as well as HMR and MAT remain separated in cells of both mating types. In fact, cells in which the inappropriate donor locus is artificially tethered to MAT still predominantly select the correct donor. We find, though, that initiation of switching leads to a rapid association of the correct donor locus with MAT. Thus, in mating type switching in Saccharomyces, donor preference is imposed at commitment to recombination rather than at physical contact of interacting DNA strands.
Keywords: chromosomal dynamics/donor preference/mating type switching/recombination/Saccharomyces
Introduction
Specific interactions between distant chromosomal loci underlie a variety of developmental programs in eukaryotic cells, including globin gene expression and immunoglobulin class switching (Jung et al., 1993; Zhang et al., 1993). Mating type switching in the yeast Saccharomyces provides a particularly tractable system for analyzing such distant interactions during development (Bi and Broach, 1998; Haber, 1998). The mating type of a haploid cell is dictated by the particular allele, a or α, present at the mating type locus, MAT, located near the center of chromosome III (Herskowitz, 1989; Herskowitz et al., 1992). Formation of a double-strand break in the DNA of the MAT locus, catalyzed by an endonuclease encoded by the HO locus, initiates mating type switching (Strathern et al., 1982; Kostriken and Heffron, 1984). Switching then occurs by a gene conversion event that replaces the mating information at the MAT locus with that present at either of two repository mating loci, HML and HMR, located at the opposite ends of chromosome III (180 and 100 kb, respectively, away from MAT) (Haber, 1998). This results in replacement of one mating type allele at MAT with a copy of the opposite mating type allele taken from either HML or HMR.
Mating type switching follows a precise developmental program dictated by the intricate transcriptional regulation of the HO gene and by a highly regulated interaction between distant regions of chromosome III (Herskowitz et al., 1992; Haber, 1998). Namely, mothers, but not daughters, transcribe the HO gene and do so only during the G1 phase of the cell cycle. Accordingly, only mothers can switch cell type and the switch occurs prior to DNA replication (Nasmyth, 1993; Long et al., 1997; Nasmyth and Jansen, 1997). In addition, cell type dictates which donor locus is selected for participation in the gene conversion event. a cells predominantly use HML as donor, whereas α cells use HMR as donor. Since HML normally contains α mating information and HMR normally contains a mating information, this pattern ensures that most of the switching events result in a change of mating type, rather than a futile replacement of the MAT allele with the same sequence (Klar et al., 1982).
The fact that cells can promote selective interaction between MAT and one of the repository HM loci implies that the two loci possess distinguishable features that are recognized in a cell type-specific manner. The discrimination does not derive from the different alleles resident at the donor loci, from the unique sequences flanking either locus, nor from any of the DNA sequences distal to either locus on chromosome III (Weiler and Broach, 1992). Rather, the left arm of chromosome III exhibits a cell type-dependent difference in recombinogenicity such that a large (>40 kb) region of the left arm of chromosome III containing HML can undergo intragenic recombination with MAT at a frequency at least 20 times higher in a cells than in α cells (Wu and Haber, 1995). This a cell-specific enhancement of recombination of the left arm of chromosome III depends on a small (<2 kb) segment ∼30 kb from the telomere, 16 kb from HML (Wu and Haber, 1996), consisting of a pair of binding sites for the transcriptional activator Mcm1 and the mating type-specific transcriptional repressor α2. Deletion of this segment (referred to as RE for recombinational enhancer) causes a cells to choose HMR (the wrong donor) instead of HML, without altering the donor preference in α cells (HMR is preferred as usual) (Wu and Haber, 1996; Szeto et al., 1997).
These observations provide a working model for donor preference (Figure 1A). In a cells, binding of Mcm1 to the RE activates the intrachromosomal recombination potential of the left arm of chromosome III. Accordingly, HML becomes the preferred donor. In α cells, α2 represses the activity of Mcm1 bound to the RE and thereby prevents activation of the recombination potential of the left arm. As a result, HMR becomes the preferred donor, due to an as yet undefined intrinsic bias for HMR as donor (Wu et al., 1996). While this model accounts for all current observations, it does not address the fundamental question of the basis of the enhanced recombinogenicity of the left arm of chromosome III in a cells. In this report, we probed the mechanistic basis for donor preference by determining the architecture of chromosome III in switching cells. In particular, we determined whether the correct donor locus is located closer to MAT prior to initiation of mating type switching. We find that not only do the donor loci fail to show such pre-organization. but also artificially tethering the wrong donor locus to MAT fails to redirect donor selection. However, following initiation of switching, MAT becomes associated with the proper donor locus in the cell. These results suggest that commitment to recombination, rather than physical proximity, dictates donor preference in yeast.


Fig. 1. (A) Mating type switching in yeast. Schematic of chromo some III, showing the expressor locus, MAT, the transcriptionally silent donor loci HML and HMR, and the recombination enhancer RE. In MATa cells, Mcm1 binds to the RE and activates HML as donor. In MATα cells, α2 represses the activity of Mcm1 bound to the RE, resulting in use of HMR through an as yet undefined mechanism. (B) Models for the role of chromosome III architecture in mating type switching. Two models could account for donor selection in yeast. Either chromosome III is prefolded in a cell type-specific manner to yield juxtaposition of the preferred donor next to MAT or, following double-strand cleavage, the broken end could physically sample both HML and HMR equally but commit to the preferred donor through, for example, enhanced susceptibility of the preferred donor to strand invasion. The first model would predict that the preferred donor would be located closer to MAT than the non-preferred donor, while the second would predict that no cell type-specific organization of the chromosome would be evident. In this latter case, both donor loci would be either equally unassociated with MAT or equally associated.
Results
Two distinct models could account for the ability of yeast cells to select one donor locus over the other during mating type switching (Figure 1B), each positing a different rate-limiting step in the donor selection process. The first model assumes that finding the appropriate donor would be the rate-limiting step and that the RE leads to a cell type-specific pre-organization of chromosome III to position the correct donor locus closer to MAT prior to initiation of switching. That is, HML would be nearer MAT in a cells and HMR would be nearer MAT in α cells. In this model, donor preference results from the fact that MAT would simply be more likely to encounter the preferred donor following initiation of the switching process. Such chromosomal organization probably dictates donor preference during mating type switching in Schizosaccharo myces pombe and some recent data suggest that chromosomal architecture could contribute to donor preference in Saccharomyces (Klar, 1992; Kostriken and Wedeen, 2001). In addition, the HML locus appears to be confined to the nuclear periphery, providing a landmark for potential chromosomal organization (Laroche et al., 2000). The second model postulates that no pre-organization exists and that selection of the donor locus occurs at a stage in the recombination process later than physical encounter. The double-strand break would sample both donor loci equally, but commitment to recombination, perhaps at the strand invasion stage or formation of a replication complex, would be regulated by mating type through the RE so that only the correct locus served to complete the recombination event.
The relative positions of donor and expressor loci are cell type independent
In order to distinguish between the two models presented in Figure 1, we created strains in which we could examine the locations of the MAT and the donor loci in cells as a function of cell type. To do so, we used the method developed by Belmont and colleagues (Robinett et al., 1996; Belmont and Straight, 1998), in which tandem repeats of a repressor binding site are inserted at the chromosomal locus of interest in cells expressing a fusion of green fluorescent protein (GFP) to the binding domain of the repressor that recognizes the binding site. In particular, we inserted an array of lac repressor sites at MAT and an array of tet repressor sites at either HML or HMR in strains expressing both GFP–LacI and GFP–tetR fusions (Robinett et al., 1996; Michaelis et al., 1997). The different arrays at the two loci preclude adventitious pairing of the tagged loci. In addition, we used a 2n – 1 chromosome III monosomic strain to increase the size of the cell while maintaining a single chromosome III within the cell. To assure ourselves that the arrays themselves did not interfere with donor preference, we performed donor preference analysis as previously described on strains containing arrays at MAT and HML or MAT and HMR. As evident from the data presented in Figure 4, strains containing the arrays at MAT and HMR exhibited a donor preference pattern essentially identical to that of a wild-type strain. The strains containing arrays at MAT and HML showed a slightly reduced selection of HML in an a background, perhaps reflecting the increased distance between HML and the RE as a consequence of the insertion of the HML array, but normal selection of HMR in an α background. Thus, the tagged strains maintain appropriate donor preference.

Fig. 4. Tethering donor loci to MAT does not alter donor preference. Donor preference assays were performed as described in Materials and methods on a wild-type strain (upper figure), strains containing LacO arrays at MAT and HML or HMR and expressing a LacI–GFP construct without a tetramerization domain (middle figures) and the same tagged strains but expressing a LacI–GFP construct with a tetramerization domain (lower figures). The numbers adjacent to the arrows in each diagram indicate the frequency that MATa cells (above the line representing chromosome III in each figure) or MATα cells (below the line in each figure) select HML (arrow to left) or HMR (arrow to right). The residual percentage of events represents those colonies that yielded ambiguous donor selection. Approximately 50 colonies were tested for each mating type of each strain.
We would predict quite distinct results for the location of the GFP spots in our test strains depending on the particular model of donor preference invoked. In a pre-organization model, we would expect to see predominantly one spot in a cells tagged at HML and MAT, and two spots in α cells, while the reciprocal case would obtain in cells tagged at HMR and MAT. In model 2, we would expect that we would see predominantly two spots in the cell, regardless of cell type or tag locations. We can envisage a variant of either model in which all three loci are tightly associated in the cell under all circumstances, at least to the level of resolution of the light microscope. In this case, we would expect to see a single spot in all strains.
We collected data by fluorescence microscopy for ∼200 cells of each tag pair in each mating type background. We examined only unbudded cells, i.e. those in the G1 stage of the cell cycle, and for each cell we collected optical slices at 0.2 µm intervals through the entire vertical dimension of the cell. The image from each slice was enhanced by repeated cycles of computational deconvolution until no significant improvement of the image resulted in a successive cycle (usually 15 cycles). We then reconstructed the three-dimensional image of the cell, determined whether the cell presented one or two spots and, in the latter case, measured the distance between the two spots. The resolution afforded by this deconvolution microscopy allowed us to distinguish spots located at least 0.2 µm apart.
The results of our analysis are shown in Figure 2 and summarized in Table I. Figure 2B shows a cumulative plot of distance between the two spots in each strain, in which the number on the y-axis represents the total fraction of cells with spots less than or equal to x µm apart. Figure 2C provides a histogram of the fraction of cells with spots at a given distance apart. Table I gives the percentage of cells exhibiting two spots and the average distance between the spots. Consistent with the shorter linear chromosomal distance between HMR and MAT relative to HML and MAT, the average three-dimensional distance between HMR and MAT in cells is less than that of HML and MAT. However, the three-dimensional distance is not proportional to the linear chromosomal distance. With regard to donor preference, we found that the percentage of cells with two spots and the average distance between those spots for cells tagged at HML and MAT are the same for both cell types. Similarly, for cells tagged at HMR and MAT, the percentage of cells with two spots is essentially the same for both cell types, although we have noted a small but consistent reduction in the average distance between HMR and MAT in α versus a cells. This latter observation is discussed below. In general, though, our data demonstate that the preferred donor locus is not preferentially positioned adjacent to MAT in the cells prior to switching. Accordingly, cell type does not dictate a specific architecture of chromosome III as a means of promoting donor preference.


Fig. 2. Spatial distribution of donor and expressor loci. (A) Decon voluted fluorescent images of representative cells containing LacO arrays at MAT and TetO arrays at HML or HMR and expressing TetR–GFP and LacI–GFP fusion proteins. Each row is a single strain with the tagged loci indicated to the right of the images. (B) Distances between spots in cells tagged at two sites on chromosome III. Plotted is the cumulative fraction of cells with two fluorescent spots separated by a given distance. Data are shown only for those cells exhibiting two spots (cf. Table I). (C) Binned data for all cells, indicating the fraction of cells tagged at the indicated loci with spots located within each 0.3 µm distance interval.
Table I. Organization of mating loci on chromosome III.
| RE | Tagged loci |
|||||
|---|---|---|---|---|---|---|
| MATa-HML | MATα-HML | MATa-HMR | MATα-HMR | ChrIXa | ||
| % with two spots | + | 65 (54/83) | 63 (122/191) | 52 (95/182) | 58 (162/278) | 56 (22/39) |
| Average distance | + | 0.77 ± 0.29 | 0.80 ± 0.30 | 0.65 ± 0.20 | 0.60 ± 0.20 | 0.67 ± 0.33 |
| % with two spots | Δ | 61 (122/191) | 63 (121/192) | 51 (96/186) | 57 (106/187) | NA |
| Average distance | Δ | 0.82 ± 0.31 | 0.85 ± 0.32 | 0.65 ± 0.17 | 0.59 ± 0.17 | NA |
Cells from strains with arrays inserted at the indicated tagged loci and either containing an intact recombination enhancer (RE+) or deleted for the recombination enhancer (REΔ) were examined by deconvolution microscopy and the percentage of cells with two spots (absolute numbers are indicated in parentheses) and the average distance (in µm ± SD) between the two spots are presented. Strains used for this study are listed in Table II.
aArrays were inserted at positions 106 and 225 kb from the left end. NA, not applicable.
We noted that the proportion of cells marked at MAT and HMR showing single spots was substantially larger than that predicted assuming that the two loci behaved as tethered but freely diffusible sites on a chromosome of average compaction. That is, we predicted ∼5–10% of cells with single spots in the MAT- and HMR-tagged strains, and we observed 40–50% of cells with single spots (see Materials and methods for the calculation and assumptions). Similarly, we would anticipate ∼5% of the single spots in the MAT- and HML-tagged strains, and we observed ∼40% of cells with single spots. To test whether this anomolous behavior was a function of either the mating loci or chromosome III, we examined cells in which we inserted the tet and lac arrays 120 kb apart on chromosome IX. The results of the analysis of this strain are also included in Table I. As is evident, the pattern of distances between these two loci was essentially identical to that observed for cells marked at MAT and HMR. Thus, the unexpected pattern obtained with MAT and HMR is not specific to the mating loci or chromosome III and, in sum, our results indicate that the architecture of chromosome III and the position of the donor loci relative to MAT are not significantly influenced by the mating type of the cell.
Despite the absence of evident differences in distances between the donor and expressor mating type loci as a function of mating type, we examined the effect of deleting the RE on the relative positions of donor and expressor loci. These data were collected as above with isogenic strains from which the 2 kb region spanning the RE had been deleted, and are presented in Figure 3. As is evident, the percentage of cells with two spots and the average distances between those spots are unaffected by deletion of the RE. Thus, the RE does not affect the large-scale architecture of chromosome III.


Fig. 3. Spatial distribution of donor and expressor loci in strains deleted for the RE. (A) Distances between spots in cells tagged at two sites on chromosome III from which the RE has been deleted. Plotted is the cumulative fraction of cells with two fluorescent spots separated by a given distance. Data are shown only for those cells exhibiting two spots. (B) Comparison between RE+ and REΔ strains for each combination of cell type and donor locus tag. Data represent separation distances for all cells, indicating the fraction of cells tagged at the indicated loci with spots located within each 0.3 µm distance interval.
Tethering the non-preferred donor locus to MAT does not invert donor preference
Although our results indicate that chromosome III is not arranged in the cell so as to juxtapose the preferred donor with MAT, we asked whether artificially tethering the inappropriate donor next to MAT would reverse the normal donor preference. To test this, we positioned lac arrays at both HML and MAT or HMR and MAT and expressed a GFP–LacI fusion protein that retained the LacI tetramerization domains. In this manner, the GFP–LacI proteins bound to one array could bind to the GFP–LacI proteins bound at the second array and bring the two arrays into close physical proximity. Straight et al. (1996) showed previously that this technique could maintain juxtaposition of sister yeast chromosomes at mitosis in the absence of the normal chromosomal adhesion complex. To confirm that the GFP–LacI complex could in fact maintain association of the marked donor locus with MAT, we examined our test cells by deconvolution microscopy as above. We observed 100% single spots within the cells under conditions of the switching experiment (data not shown), indicating that the LacI fusion protein efficiently tethered the marked donor locus to MAT. We then tested these cells for donor selection following mating type switching initiated by a wild-type HO gene, using the donor preference assay described previously. The data from these experiments are shown in Figure 4. As can be seen, the efficiency of selecting the proper donor increased slightly in strains in which the proper donor was tethered to MAT (>95% selection of HMR in α cells with HMR tethered to MAT versus 92% selection in tagged but untethered α cells, and 75% selection of HML in a cells with HML tethered to MAT versus 65% in tagged but untethered a cells). In addition, tethering the incorrect donor locus to MAT somewhat reduced the selection of the appropriate donor (64% selection of HMR in α cells with HML tethered to MAT versus 92% selection in tagged but untethered α cells, and 68% selection of HML in a cells with HMR tethered to MAT versus 94% in tagged but untethered a cells). However, in no case did tethering the inappropriate donor to MAT reverse or randomize the selection process. Thus, the mechanism that the cell uses to select the appropriate donor operates even when the inappropriate donor is located much closer to MAT than the appropriate donor, indicating that the rate-limiting step in donor selection is probably not physical association.
Initiation of switching induces convergence of the correct donor locus with MAT
Since the donor and MAT loci must physically interact during the process of switching, we asked whether we could observe the confluence of the two loci in our marked strains following initiation of the switching. Accordingly, we introduced the HO gene under the control of the galactose-inducible GAL1 promoter into our tagged strains. We grew the cells to exponential phase in raffinose (non-inducing) medium and then added galactose to induce expression of HO and initiate switching. By examining the MAT locus by Southern analysis in this strain and under these conditions, we confirmed that HO-mediated cleavage of MAT did not occur prior to addition of galactose, but became evident 20 min after induction, reaching a maximum value at 30–40 min (Figure 5). This is consistent with kinetics previously observed for MAT cleavage following induction of a GAL-HO construct (Connolly et al., 1988). We further examined the kinetics and directionality of switching in this strain by withdrawing samples at 30 min, plating on glucose plates containing 5-fluoroanthranilic acid (to repress expression of HO and then select cells lacking the HO plasmid during outgrowth) and testing the mating type of the resulting colonies. We found that 65% of α cells and 85% of a cells had committed to switching to the opposite mating type by 30 min of induction (data not shown). Thus, these strains exhibit normal donor preference.
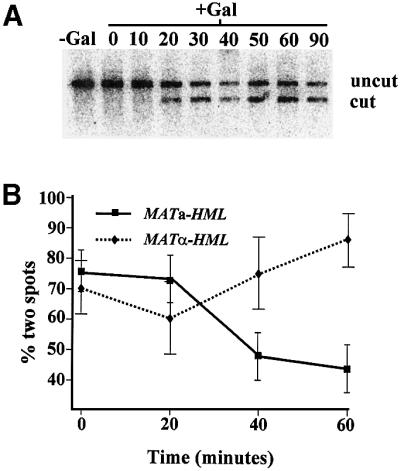
Fig. 5. Convergence of MAT with the correct donor locus following initiation of switching. (A) Strain PJS1392 was transformed with plasmid pPLH222 (CEN GAL-HO) and a transformant was grown at 30°C in SC-Leu media to ∼107 cells/ml. Cells were harvested, transferred to SC-Leu media lacking glucose and containing 2% raffinose, and grown for 3 h at 30°C. Galactose was added to 2% and culture samples were removed either prior to galactose addition or at the indicated time following galactose addition. DNA was prepared from the culture samples, digested with XbaI, fractionated on a 1% agarose gel, transferred to a Zeta-Probe membrane (Bio-Rad) and probed with labeled DNA specific for MAT (the 256 bp HindIII–AluI fragment immediately centromere distal to MAT). The upper band (4178 bp) corresponds to the uncleaved MAT locus and the lower band (3033 bp) to HO cut locus. (B) Strains PJS1392 (MATa::TRP1-LacO256 HML::URA3-TetO112 HMR) and PJS1401 (MATα::TRP1-LacO256 HML::URA3-TetO112 HMR) were transformed with plasmid pPLH222 and grown as above. After growth in 2% raffinose for 3 h, cells were transferred to SC+2% raffinose lacking uracil and histidine and supplemented with 7.5 mM 3-aminotriazole, grown for 30 min, transferred to SC+2% raffinose medium for 15 min, fixed for 5 min in 2% paraformaldehyde (final volume) and subjected to microscopy as above. Samples were removed from the culture and made 2% galactose at the indicated time prior to fixation. All the galactose-containing samples were processed in parallel to the sample lacking galactose. Indicated are the percentages of cells with two spots in each sample as a function of the time of growth in the presence of galactose.
To examine localization of the two loci following initiation of switching, we grew cells as above, removed samples at various times after galactose addition, fixed the cells and examined unbudded cells microscopically for the presence of one or two spots. The results of this analysis are presented in Figure 5, in which we show the percentage of cells with two spots as a function of time following addition of galactose. As is evident from these data, in an a strain with tags at HML and MAT, the proportion of cells in the population with two spots decreased markedly following induction of HO, reaching a minimum at ∼40 min. In contrast, an α strain with the same tags did not show a decrease in the proportion of cells with two spots. Reciprocal results were obtained in strains tagged at HMR and MAT. In this case, the proportion of cells with single spots increased in α strains, but not in a strains, following initiation of switching (data not shown). These results indicate that the MAT locus becomes physically associated with the preferred donor locus, but not the non-preferred donor locus, following initiation of switching.
Discussion
We have explored the role of chromosome III architecture in donor preference during mating type switching and have demonstrated that the preferred donor remains as far from MAT prior to initiation of switching as does the non-preferred donor. Furthermore, the cell preferentially selects the preferred donor upon switching even when the non-preferred donor locus is tethered to MAT. Once switching is initiated, though, MAT becomes associated with the preferred donor locus. These results indicate that the selection process leads to association of MAT with the preferred donor, rather than the other way around. Thus, we conclude that factors other than spatial organization underlie donor selection in yeast.
Using a similar approach, Kostriken and Wedeen (2001) concluded that chromosomal architecture did affect donor preference. In their experiments, Kostriken and Wedeen constructed HO strains in which the mating type alleles at HML and HMR were reversed (a information at HML and α information at HMR). They also rendered the haploid strains non-mating so that cells could continue to switch every generation as the culture grew and thus reach an equilibrium in the culture of the mating type alleles (a or α) resident at MAT. This equilibrium value provided a measure of the relative selection biases of the cell for HML and HMR. Wild-type strains showed a steady-state allele occupancy at MAT of 20% a and 80% α, reflecting the fact that cells are more efficient at correctly selecting HMR than HML (see Figure 4). Tethering HML to MAT by a method similar to that described in this report shifted that equilibrium to 45% a and 55% α, from which the authors concluded that tethering the donor locus to MAT redirects donor preference. We applied a mathematical model of this system to determine the equilibrium allele occupancy at MAT as a function of the absolute selection rates of HML and HMR in a and α cells. Using the values presented above in Figure 4 for the rates that we measured experimentally for HML versus HMR selection in a cells and α cells, we obtained a predicted allele occupancy of the HML-tagged but untethered strain of 10% a and 90% α, and a predicted occupancy in the strain in which HML is tethered to MAT of 56% a and 44% α. This remarkable similarity to the observed values reported by Kostriken and Wedeen suggests that the effects observed by them in their strains are quite similar to those we find in ours. Furthermore, these calculations indicate that only a slight reduction in the efficiency of selection, rather than a reversal in preference, is sufficient to yield the observed shift in the equilibrium values in the experimental design used by Kostriken and Wedeen. Thus, we feel that both sets of observations support the hypothesis that donor preference is not dictated by chromosomal architecture.
While we conclude that chromosomal architecture does not drive donor preference, we acknowledge that location does influence the efficiency of donor locus usage. As noted in our results, tethering a donor locus near MAT does increase the likelihood that it will be selected, whether or not it is the preferred donor. In addition, in the absence of a functional RE (in α cells or in a cells carrying an RE deletion), HMR is the preferred donor through an ill-defined default pathway that is sensitive to position effects. HMR is situated closer to MAT than is HML, not only in the linear distance along the chromosome, but also, as we have found in this study, in the three-dimensional distance within the nucleus. Inserting sequences between HMR and MAT, thereby increasing its distance from MAT, or moving HMR from the right arm to the left arm of chromosome III, diminishes its selection under these default conditions, while moving HMR closer to MAT on the left arm increases its selection (Wu et al., 1996; Szeto et al., 1997). Thus, proximity plays a role in the default pathway. We have consistently found that HMR is somewhat closer to MAT in α strains relative to a strains, thus placing HMR nearer MAT when it is the preferred donor. Whether this contributes to the RE-independent α effects on donor preference noted previously remains to be tested (Wu et al., 1996). Nonetheless, we previously reported and have recently confirmed that moving MAT to a different chromosome does not diminish the cell’s ability to select the appropriate donor preferentially (Weiler and Broach, 1992; P.Simon and J.Broach, unpublished observation). Thus, while position can influence the overall efficiency of the selection process, it does not override the basic selection mechanism.
From these observations, we conclude that at least two steps need to be considered in understanding the process of donor selection. First, the double-strand break needs to come in contact with the appropriate donor locus. Since the relative position of MAT to the donor loci does not strongly influence the process of selection, then finding the correct locus is not normally rate limiting. That is, the double-strand break must sample both loci a number of times before committing to recombination. Consistent with this requirement, our observation of the position of the GFP spots in living yeast cells tagged at both MAT and HML indicated that the chromosomal loci exhibit quite dynamic behavior relative to each other (P.Houston and J.Broach, unpublished observations), consistent with recent reports on the dynamic nature of single loci in yeast nuclei (Heun et al., 2001a,b). Thus, it is not unreasonable to assume that the dynamic activity of the loci would allow multiple sampling opportunities in a single switching event. This is also consistent with analysis of recombination in other systems, in which homology search has been shown to be rapid compared with commitment to recombination (Julin et al., 1986; Camerini-Otero and Hsieh, 1995; Yancey-Wrona and Camerini-Otero, 1995). As a second step in the process of switching, the broken end from MAT must be repaired by replicating the sequence at a donor locus. This involves strand exchange at the donor locus, followed by formation of a replication complex on the newly formed primer template. We would suggest that one of these events is likely to be the rate-limiting step through which donor preference is imposed. For instance, in an a strain, the HML locus, through the action of the RE, would be more susceptible to invasion than would HMR. We would argue that in the absence of the activity of the RE, HMR is intrinsically more susceptible to invasion. The mechanistic basis for such susceptibility to invasion remains to be resolved, but a higher density of helicases, such as Chl1, at the preferred locus could play a role (Weiler et al., 1995). This model does not eliminate the role of position in donor selection. Increasing the frequency with which MAT samples one locus versus the other—by tethering the locus to MAT or by removing the competing locus to a more remote site—could increase the use of that locus. However, we would conclude that, under normal circumstances, commitment to recombination, perhaps through relative susceptibility to strand invasion or maturation of strand exchange intermediates, would dictate donor preference.
We observed in these studies that two loci on a single yeast chromosome do not behave as if they were freely diffusible beads tethered to each other by an inelastic string. First, if the two loci diffused freely, constrained only by the limits of the intervening segment of DNA, then the most common position of the two loci in the nucleus would be at their maximum possible separation. In contrast, we find that the median distance between the two loci was substantially shorter than the maximum distance in all the strains tested. This behavior could be accounted for in part by assuming that the DNA possesses a high degree of elasticity in vivo, inhibiting the separation of the two points on the DNA to the maximum distance. The nature of this elasticity is unknown. Secondly, we observed an unexpectedly large preponderance of cells in which the two loci were contiguous in space, at least at the resolution of the light microscope. This is not a specific property of the mating loci, since loci on chromosome IX located a similar linear distance apart on the chromosome as HMR and MAT show the same distribution of distances in the nucleus as do HMR and MAT. Rather, our data suggest that while segments of chromosomes are quite dynamic in the cell, they display a higher level of organization that renders distant regions of a chromosome adjacent to each other more often than would be expected if they were freely mobile. This is consistent with previous observations indicating that segments of the yeast genome are quite mobile but remain confined to a limited region within the nucleus (Marshall et al., 1997). Additional experiments examining the relative position over time in living cells of two loci on the same chromosome should yield more information on the higher order structure of the yeast chromosomes.
Materials and methods
Strain construction
Strains used in this study are listed in Table II. The LacO and TetO arrays were targeted to chromosome III by cloning ∼2 kb of DNA into plasmids pAFS59 and p306tetO112 (Straight et al., 1996; Michaelis et al., 1997). Sequences spanning CHA1 (15511–17514 bp from the left end of chrIII), BUD5 (198185–200062 bp) and the region telomere proximal to HMR (298947–300934 bp) were used to target arrays to HML, MAT and HMR, respectively. The LEU2 marker of the pAFS59 derived plasmids was replaced with TRP1 by exchanging BglI fragments with pRS404 to allow two LacO arrays to be integrated using distinct markers. Arrays were targeted to chromosome IX using ∼1 kb of DNA for regions around 106 kb (105491–106525 bp) and 225 kb (225185–226409 bp).
Table II. Strains used in this study.
| Strain | Genotypea |
|---|---|
| S150-2B | MATa leu2-3,112 his3Δ1 ura3-52 trp1-289 gal2 ho |
| LS204 | MATa/MATα hmlα1α2Δ-inc/hmlα1α2Δ-inc hmra1Δ101-inc/hmra1Δ101-inc HO/HO leu2-3,112/leu2-3,112 his3Δ1/his3Δ1 ura3-52/ura3-52 trp1-289/trp1-289 |
| PJS1296 | MATa::TRP1-LacO256/MATα hmlα1α2Δ-inc/hmlα1α2Δ-inc hmra1Δ101-inc::LEU2-LacO256/hmra1Δ101-inc leu2-3,112/leu2-3,112 HIS3::TetR-GFP,LacI-GFP/his3Δ1 ura3-52/ura3-52 trp1-289/trp1-289 HO/HO |
| PJS1297 | MATa/MATα::TRP1-LacO256 hmlα1α2Δ-inc/hmlα1α2Δ-inc hmra1Δ101-inc::LEU2-LacO256/hmra1Δ101-inc leu2-3, 112/leu2-3,112 HIS3::TetR-GFP,LacI-GFP/his3Δ1 ura3-52/ura3-52 trp1-289/trp1-289 HO/HO |
| PJS1298 | MATa::TRP1-LacO256/MATα hmlα1α2Δ-inc::LEU2-LacO256/hmlα1α2Δ-inc hmra1Δ101-inc/hmra1Δ101-inc leu2-3, 112/leu2-3,112 HIS3::TetR-GFP,LacI-GFP/his3Δ1 ura3-52/ura3-52 trp1-289/trp1-289 HO/HO |
| PJS1299 | MATa/MATα::TRP1-LacO256 hmlα1α2Δ-inc::LEU2-LacO256/hmlα1α2Δ-inc hmra1Δ101-inc/hmra1Δ101-inc leu2-3, 112/leu2-3,112 HIS3::TetR-GFP,LacI-GFP/his3Δ1 ura3-52/ura3-52 trp1-289/trp1-289 HO/HO |
| PJS1301b | MATa::TRP1-LacO256/MATα hmlα1α2Δ-inc/hmlα1α2Δ-inc hmra1Δ101-inc::LEU2-LacO256/hmra1Δ101-inc leu2-3, 112/leu2-3,112 HIS3::TetR-GFP,LacI(4)-GFP/his3Δ1 ura3-52/ura3-52 trp1-289/trp1-289 HO/HO |
| PJS1302b | MATa/MATα::TRP1-LacO256 hmlα1α2Δ-inc/hmlα1α2Δ-inc hmra1Δ101-inc::LEU2-LacO256/hmra1Δ101-inc leu2-3, 112/leu2-3,112 HIS3::TetR-GFP,LacI(4)-GFP/his3Δ1 ura3-52/ura3-52 trp1-289/trp1-289 HO/HO |
| PJS1303b | MATa::TRP1-LacO256/MATα hmlα1α2Δ-inc::LEU2-LacO256/hmlα1α2Δ-inc hmra1Δ101-inc/hmra1Δ101-inc leu2-3, 112/leu2-3,112 HIS3::TetR-GFP,LacI(4)-GFP/his3Δ1 ura3-52/ura3-52 trp1-289/trp1-289 HO/HO |
| PJS1304b | MATa/MATα::TRP1-LacO256 hmlα1α2Δ-inc::LEU2-LacO256/hmlα1α2Δ-inc hmra1Δ101-inc/hmra1Δ101-inc leu2-3,112/leu2-3,112 HIS3::TetR-GFP,LacI(4)-GFP/his3Δ1 ura3-52/ura3-52 trp1-289/trp1-289 HO/HO |
| PJS1392c | MATa::TRP1-LacO256 HML::URA3-TetO112 HMR leu2-3,112 HIS3::TetR-GFP,LacI-GFP/his3Δ1 ura3-52/ura3-52 trp1-289/trp1-289 gal2/gal2 |
| PJS1401c | MATα::TRP1-LacO256 HML::URA3-TetO112 HMR leu2-3,112 HIS3::TetR-GFP,LacI-GFP/his3Δ1 ura3-52/ura3-52 trp1-289/trp1-289 gal2/gal2 |
| PJS1512c | MATa::TRP1-LacO256 HML HMR::URA3-TetO112 leu2-3,112 HIS3::TetR-GFP,LacI-GFP/his3Δ1 ura3-52/ura3-52 trp1-289/trp1-289 gal2/gal2 ste5::kan/ste5::kan |
| PJS1513c | MATa::TRP1-LacO256 HML::URA3-TetO112 HMR leu2-3,112 HIS3::TetR-GFP,LacI-GFP/his3Δ1 ura3-52/ura3-52 trp1-289/trp1-289 gal2/gal2 ste5::kan/ste5::kan |
| PJS1532c | MATα::TRP1-LacO256 HML HMR::URA3-TetO112 leu2-3,112 HIS3::TetR-GFP,LacI-GFP/his3Δ1 ura3-52/ura3-52 trp1-289/trp1-289 gal2/gal2 ste5::kan/ste5::kan |
| PJS1516c | MATα::TRP1-LacO256 HML::URA3-TetO112 HMR leu2-3,112 HIS3::TetR-GFP,LacI-GFP/his3Δ1 ura3-52/ura3-52 trp1-289/trp1-289 gal2/gal ste5::kan/ste5::kan 2 |
| PJS1521c | MATa::TRP1-LacO256 HML::URA3-TetO112 HMR leu2-3,112 REΔ::LEU2 HIS3::TetR-GFP,LacI-GFP/his3Δ1 ura3-52/ura3-52 trp1-289/trp1-289 gal2/gal2 ste5::kan/ste5::kan |
| PJS1524c | MATα::TRP1-LacO256 HML::URA3-TetO112 HMR leu2-3,112 REΔ::LEU2 HIS3::TetR-GFP,LacI-GFP/his3Δ1 ura3-52/ura3-52 trp1-289/trp1-289 gal2/gal ste5::kan/ste5::kan |
| PJS1520c | MATa::TRP1-LacO256 HML HMR::URA3-TetO112 leu2-3,112 REΔ::LEU2 HIS3::TetR-GFP,LacI-GFP/his3Δ1 ura3-52/ura3-52 trp1-289/trp1-289 gal2/gal2 ste5::kan/ste5::kan |
| PJS1533c | MATα::TRP1-LacO256 HML HMR::URA3-TetO112 leu2-3,112 HIS3::TetR-GFP,LacI-GFP/his3Δ1 ura3-52/ura3-52 trp1-289/trp1-289 gal2/gal2 ste5::kan/ste5::kan |
| PJS1463d | MATa/MATα HML/HML HMR/HMR leu2-3,112/leu2-3,112 HIS3::TetR-GFP,LacI-GFP/his3Δ1 ura3-52/ura3-52 trp1-289/trp1-289 gal2/gal2 ChrIX(106kb)::LEU2-LacO256 ChrIX(225kb)::URA3-TetO112 |
aAll strains are derived from S288C.
bLacI(4) designates the LacI repressor construct containing the tetramerization domain.
cStrains are 2n – 1 chromosome III monosomes.
dStrains are 2n – 1 chromosome IX monosomes.
To generate a set of doubly tagged strains, the LacO array was integrated into the BUD5 locus of a and α versions of the S288C-derived haploid strain S150-2B, and the TetO arrays were then integrated near HML or HMR as described above. In a separate strain construction, the EcoRI–BamHI TetR–GFP fusion from YIp128tetR–GFP (Michaelis et al., 1997) was inserted into the SacI site of pAFS144 (Straight et al., 1996) to yield plasmid pPJS218. Plasmid pPJS218 was integrated into the his3Δ1 locus in a and α cells of strain S150-2B. These strains were then transformed with the NotI fragment of pCEN03-UG (David Stillman, University of Utah), which consists of CENIII into which has been inserted a GAL1 promoter directed toward the centromeric sequence. This allows galactose-inducible inactivation of chromosome III centromere function. These haploids strains were mated with strains containing pairs of LacO and TetO arrays. After selecting for diploids, strains were grown on galactose and surviving cells were confirmed monosomic for chromosome III by Southern blotting and mating assay. Strains PJS1520, PJS1521, PJS1524 and PJS1533 were derived from strains PJS1512, PJS1513, PJS1516 and PJS1532 by transformation to Leu+ with a PCR fragment obtained from plasmid pPJS254, which consists of the 6.3 kb BamHI chromosomal fragment spanning RE from which the BlpI–PmeI region covering the entire RE (DPS1 and DPS2) has been replaced with LEU2. Strain PJS1463 is 2n – 1 for chromosome IX. For analysis of the position of donor loci relative to MAT following activation of HO, doubly tagged strains were transformed with plasmid pPY222 (CEN TRP1 LEU2 GAL-HO, derived from pJH283 from Dr Fred Heffron), and cultures for analysis were inoculated directly from the transformation plate.
Strains for switching analysis were created using LS204 (Weiler et al., 1995) by sequentially integrating the LacI(2)–GFP fusion plasmid pPJS218 at HIS3 and the LacO arrays at MAT and HML or HMR as above. The tetramerization domain of the Lac repressor was restored using a PCR primer containing the sequence of the 11-amino-acid domain. This construct (contained on the URA3 plasmid pPJS231) was used to replace the dimeric Lac repressor in the above strains. All constructions were confirmed by Southern blot analysis.
Visualization of tagged arrays in cells
Cells from an overnight culture in SC medium (Kaiser et al., 1994) were inoculated into fresh SC and grown for 1–2 h at 30°C. Cells were transferred to SC medium lacking uracil and histidine and supplemented with 7.5 mM 3-aminotriazole, and grown for 30 min. Cells were then transferred to SC medium for 15 min and then fixed for 5 min in 2% paraformaldehyde (final volume). Cells were pelleted, resuspended in 1× PBS 20% glycerol, and mounted onto coverslips using 1% Low-Melt agarose in 1× PBS.
Cells were examined using a Nikon Eclipse TE200 microscope with a 100× objective (1.4 aperture) and a planaplochromatic light source. Z-stacks containing 50 slices spaced 0.15 µm apart were deconvolved using SoftWoRx v. 2.5, and GFP spots were localized by finding the pixel(s) with the highest signal intensity.
Donor preference assays
Switching assays were performed as described (Weiler et al., 1995) with minor modifications. Briefly, diploid strains containing the mata1Δ-inc allele at HMR, the matα1α2Δ-inc allele at HML and the indicated operator arrays were sporulated and then dissected on –HIS plates to induce the LacI–GFP fusions. After 2 days of growth at 30°C, segregants were replica plated to drop-out plates to determine genotype, which identifies the initial mating type of the germinated spore. Colony PCR to determine the allele at MAT was performed using 5′-GACTCT ACCCAGATTTGTATTAGACG-3′ and 5′-GATAAGAACAAAGAA TGATGCTAAGAATTGA-3′ as primers. PCR products were run on a 0.7% agarose gel in 1× TAE. Colonies predominantly exhibiting the mata1 allele were scored as selecting HMR as donor, colonies predominantly exhibiting matα1α2 were scored as selecting HML as donor, and colonies that failed to exhibit one predominant allele were scored as ambiguous.
Calculations
The expected percentage of cells with one spot, assuming a random distribution of the MAT and donor loci in the cell, was calculated by positing that the tagged locus could randomly occupy any position within a sphere surrounding MAT whose radius equaled the maximum distance (Distmax) observed between MAT and the donor locus. For simplicity, we assumed that those cells in which the donor locus resided within a vertical column whose X–Y distance from MAT was less than the minimum optically resolvable distance between two points (Distmin) would appear as a single spot. Thus, the expected fraction of cells presenting a single spot would be at most the volume of the column [2 × Distmax × π × (Distmin)2] divided by the volume of the sphere [4 × π × (Distmax)3/3], or 1.5 × (Distmin/Distmax)2. Distmin and Distmax were determined experimentally for each strain, with Distmin taken as the smallest measured distance between two resolvable spots.
The predicted allele occupancy at MAT for a strain configured as described in Kostriken and Wedeen (2001) was calculated using our experimentally measured probability of an a cell selecting HML (PaL) or HMR (PaR) or of an α cell selecting HML (PαL) or HMR (PαR). The percent a cells in a population at generation N, aN, derives from the percent a cells in the population at generation N – 1, aN-1, as follows: aN = (1 – PaR) × aN-1 + PαL × (1 – aN-1) (recall that in this strain a information resides at HML and α information at HMR). Similarly, the percent α cells in the population at generation N, αN, which will be 1 – aN, can be independently calculated by αN = (1 – PαL) × αN-1 + PaR × (1 – αN-1). By iteration, these formulae yield steady-state values (<1% change in each succeeding generation) for the percent a or α cells in the population within 10–15 cycles (generations). The steady-state values are completely independent of the value chosen for the percent a cells in the population at the first generation.
Acknowledgments
Acknowledgements
We would like to thank Drs Andrew Belmont, Kim Nasmyth, Virginia Zakian and David Stillman for generous gifts of plasmids, Drs Waihong Tham and Bahram Houchmandzadeh for advice on yeast microscopy, and Dr Peter F.Davies for providing access to, and Drs Brian Helmke and Makoto Funaki for their training and assistance with, their Deltavision microscope. This work was supported by NIH grant GM48540 to J.R.B.
References
- Belmont A.S. and Straight,A.F. (1998) In vivo visualization of chromosomes using lac operator–repressor binding. Trends Cell Biol., 8, 121–124. [DOI] [PubMed] [Google Scholar]
- Bi X. and Broach,J.R. (1998) Cell type determination in yeast. In Russo,E., Cove,D., Edgar,L., Jaenisch,R. and Salamani,R. (eds), Development—Genetics, Epigenetics and Environmental Regulation. Springer-Verlag, Heidelberg, Germany.
- Camerini-Otero R.D. and Hsieh,P. (1995) Homologous recombination proteins in prokaryotes and eukaryotes. Annu. Rev. Genet., 29, 509–552. [DOI] [PubMed] [Google Scholar]
- Connolly B., White,C.I. and Haber,J.E. (1988) Physical monitoring of mating type switching in Saccharomyces cerevisiae. Mol. Cell. Biol., 8, 2342–2349. [DOI] [PMC free article] [PubMed] [Google Scholar]
- Haber J.E. (1998) Mating-type gene switching in Saccharomyces cerevisiae. Annu. Rev. Genet., 32, 561–599. [DOI] [PubMed] [Google Scholar]
- Herskowitz I. (1989) A regulatory hierarchy for cell specialization in yeast. Nature, 342, 749–757. [DOI] [PubMed] [Google Scholar]
- Herskowitz I., Rine,J. and Strathern,J. (1992) Mating-type determination and mating type interconversion in Saccharomyces cerevisiae. In Jones,E.W., Pringle,J.R. and Broach,J.R. (eds), The Molecular and Cellular Biology of the Yeast Saccharomyces. Vol. 2. Cold Spring Harbor Press, Cold Spring Harbor, NY, pp. 583–656.
- Heun P., Laroche,T., Shimada,K., Furrer,P. and Gasser,S.M. (2001a) Chromosome dynamics in the yeast interphase nucleus. Science, 294, 2181–2186. [DOI] [PubMed] [Google Scholar]
- Heun P., Taddei,A. and Gasser,S.M. (2001b) From snapshots to moving pictures: new perspectives on nuclear organization. Trends Cell Biol., 11, 519–525. [DOI] [PubMed] [Google Scholar]
- Julin D.A., Riddles,P.W. and Lehman,I.R. (1986) On the mechanism of pairing of single- and double-stranded DNA molecules by the recA and single-stranded DNA-binding proteins of Escherichia coli. J. Biol. Chem., 261, 1025–1030. [PubMed] [Google Scholar]
- Jung S., Rajewsky,K. and Radbruch,A. (1993) Shutdown of class switch recombination by deletion of a switch region control element. Science, 259, 984–987. [DOI] [PubMed] [Google Scholar]
- Kaiser C., Michaelis,S. and Mitchell,A. (1994) Methods in Yeast Genetics: A Cold Spring Harbor Laboratory Course Manual. Cold Spring Harbor Laboratory, Cold Spring Harbor, NY.
- Klar A.J. (1992) Developmental choices in mating-type interconversion in fission yeast. Trends Genet., 8, 208–213. [DOI] [PubMed] [Google Scholar]
- Klar A.J., Hicks,J.B. and Strathern,J.N. (1982) Directionality of yeast mating type interconversion. Cell, 28, 551–561. [DOI] [PubMed] [Google Scholar]
- Kostriken R. and Heffron,F. (1984) The product of the HO gene is a nuclease: purification and characterization of the enzyme. Cold Spring Harb. Symp. Quant. Biol., 49, 89–96. [DOI] [PubMed] [Google Scholar]
- Kostriken R. and Wedeen,C.J. (2001) Engineered interphase chromo some loops guide intrachromosomal recombination. EMBO J., 20, 2907–2913. [DOI] [PMC free article] [PubMed] [Google Scholar]
- Laroche T., Martin,S.G., Tsai-Pflugfelder,M. and Gasser,S.M. (2000) The dynamics of yeast telomeres and silencing proteins through the cell cycle. J. Struct. Biol., 129, 159–174. [DOI] [PubMed] [Google Scholar]
- Long R.M., Singer,R.H., Meng,X., Gonzalez,I., Nasmyth,K. and Jansen,R.P. (1997) Mating type switching in yeast controlled by asymmetric localization of ASH1 mRNA. Science, 277, 383–387. [DOI] [PubMed] [Google Scholar]
- Marshall W.F., Straight,A., Marko,J.F., Swedlow,J., Dernburg,A., Belmont,A., Murray,A.W., Agard,D.A. and Sedat,J.W. (1997) Interphase chromosomes undergo constrained diffusional motion in living cells. Curr. Biol., 7, 930–939. [DOI] [PubMed] [Google Scholar]
- Michaelis C., Ciosk,R. and Nasmyth,K. (1997) Cohesins: chromosomal proteins that prevent premature separation of sister chromatids. Cell, 91, 35–45. [DOI] [PubMed] [Google Scholar]
- Nasmyth K. (1993) Regulating the HO endonuclease in yeast. Curr. Opin. Genet. Dev., 3, 286–294. [DOI] [PubMed] [Google Scholar]
- Nasmyth K. and Jansen,R.P. (1997) The cytoskeleton in mRNA localization and cell differentiation. Curr. Opin. Cell Biol., 9, 396–400. [DOI] [PubMed] [Google Scholar]
- Robinett C.C., Straight,A., Li,G., Willhelm,C., Sudlow,G., Murray,A. and Belmont,A.S. (1996) In vivo localization of DNA sequences and visualization of large-scale chromatin organization using lac operator/repressor recognition. J. Cell Biol., 135, 1685–1700. [DOI] [PMC free article] [PubMed] [Google Scholar]
- Straight A.F., Belmont,A.S., Robinett,C.C. and Murray,A.W. (1996) GFP tagging of budding yeast chromosomes reveals that protein– protein interactions can mediate sister chromatid cohesion. Curr. Biol., 6, 1599–1608. [DOI] [PubMed] [Google Scholar]
- Strathern J.N., Klar,A.J.S., Hicks,J.B., Abraham,J.A., Ivy,J.M., Nasmyth, K.A. and McGill,C. (1982) Homothallic switching of yeast mating type cassettes is initiated by a double-stranded cut in the MAT locus. Cell, 31, 183–192. [DOI] [PubMed] [Google Scholar]
- Szeto L., Fafalios,M.K., Zhong,H., Vershon,A.K. and Broach,J.R. (1997) α2p controls donor preference during mating type interconversion by inactivating a recombination enhancer of chromosome III. Genes Dev., 11, 1899–1911. [DOI] [PMC free article] [PubMed] [Google Scholar]
- Weiler K.S. and Broach,J.R. (1992) Donor locus selection during Saccharomyces cerevisiae mating type interconversion responds to distant regulatory signals. Genetics, 132, 929–942. [DOI] [PMC free article] [PubMed] [Google Scholar]
- Weiler K.S., Szeto,L. and Broach,J.R. (1995) Mutations affecting donor preference during mating type interconversion in Saccharomyces cerevisiae. Genetics, 139, 1495–1510. [DOI] [PMC free article] [PubMed] [Google Scholar]
- Wu X. and Haber,J.E. (1995) MATa donor preference in yeast mating type switching: activation of a large chromosomal region for recombination. Genes Dev., 9, 1922–1932. [DOI] [PubMed] [Google Scholar]
- Wu X. and Haber,J.E. (1996) A 700 bp cis-acting region controls mating-type dependent recombination along the entire left arm of yeast chromosome III. Cell, 87, 277–285. [DOI] [PubMed] [Google Scholar]
- Wu X., Moore,J.K. and Haber,J.E. (1996) Mechanism of MATα donor preference during mating-type switching of Saccharomyces. Mol. Cell. Biol., 16, 657–668. [DOI] [PMC free article] [PubMed] [Google Scholar]
- Yancey-Wrona J.E. and Camerini-Otero,R.D. (1995) The search for DNA homology does not limit stable homologous pairing promoted by RecA. Curr. Biol., 5, 1149–1158. [DOI] [PubMed] [Google Scholar]
- Zhang J., Bottaro,A., Li,S., Stewart,V. and Alt,F.W. (1993) A selective defect in IgG2b switching as a result of targeted mutation of the Iγ2b promoter and exon. EMBO J., 12, 3529–3537. [DOI] [PMC free article] [PubMed] [Google Scholar]