

Abstract
E-cadherin is the predominant adhesion molecule of epithelia. The interaction between extracellular segments of E-cadherin in the membrane of opposing cells is homophilic and calcium dependent. Whereas it is widely accepted that the specificity of the adhesive interaction is localized to the N-terminal domain, the kinetics of the recognition process are unknown. We report the first quantitative data describing the dissociation kinetics of individual E-cadherin interactions. Aggregation assays indicate that the two outermost domains of E-cadherin (E/EC1–2) retain biological activity when chemically immobilized on glass beads. Cadherin fragment trans-interaction was analysed using a flow chamber technique. Transient tethers had first-order kinetics, suggesting a unimolecular interaction. The unstressed lifetime of individual E-cadherin interactions was as brief as 2 s. A fast off rate and the low tensile strength of the E-cadherin bond may be necessary to support the high selectivity and plasticity of epithelial cell interactions.
Keywords: cell adhesion/E-cadherin/flow chamber/kinetics/mechanism
Introduction
Cadherins are a superfamily of single-pass transmembrane glycoproteins and signal transducing molecules involved in Ca2+-dependent homophilic cell–cell adhesion (Takeichi, 1995; Nollet et al., 2000). They contribute to various morphogenetic events during development, and to the initiation, maintenance and functioning of tissue architecture (Takeichi, 1995; Gumbiner, 1996). They all have variable numbers of tandem repeats (ECs) of an ∼110 amino acid module in the extracellular segment (Nollet et al., 2000). Classical cadherins (E-, N-, P- and C-cadherin) consist of an extracellular segment typically containing five EC modules (numbered EC1 to EC5 from the outermost domain), a transmembrane region and a highly conserved cytoplasmic domain. Cadherin-initiated intracellular signalling requires association of the intracellular domain with the actin cytoskeleton via cytoplasmic proteins such as catenins, plakoglobin and p-120 (Ozawa et al., 1989; Yap et al., 1997a; Delmas et al., 1999).
The homophilic properties of cadherin-mediated cellular adhesion have been assessed mainly by cell aggregation experiments. Cells expressing cadherins sort out and aggregate only with cells expressing identical cadherins. This is the basis of tissue patterning and architecture in both cell–cell contact and cell migration (Nose et al., 1988). Cadherin expression is cell type or tissue specific, and a cell type may express more than one type of cadherin. How these molecules interact with each other and the mechanisms by which they transfer specific intracellular signals remain poorly understood.
E-cadherin, the epithelial cadherin, is important in embryonic development (Geiger and Ayalon, 1992; Takeichi, 1995). It mediates the compaction process at the morula stage (Hyafil et al., 1980). Later during development and in adult tissues, E-cadherin helps maintain epithelial cell polarization and tissue integrity (Shirayoshi et al., 1986; Larue et al., 1996; Yap et al., 1997b): E-cadherin is concentrated at the adherens junctions in the basolateral membrane of polarized epithelial cells (Boller et al., 1985). The adhesive function of E-cadherin is frequently lost during the development of most, if not all, human epithelial cancers (Birchmeier and Behrens, 1994; Perl et al., 1998). Thus, E-cadherin is central to epithelial biogenesis and stabilization.
The large extracellular segment of cadherins is responsible for the primary events of homophilic interactions between cells. ‘Domain-swapping’ experiments with E-, P- and N-cadherin indicate that the outermost cadherin repeat, EC1, is the site of this specificity (Nose et al., 1990; Shan et al., 1999). Moreover, other lines of evidence support the idea that EC1 mediates the adhesion between cadherin molecules. Deletion of the EC1 domain results in the loss of adhesive activity of N-cadherin (Shan et al., 1999). Minor changes in the amino acid sequence in this part of the molecule have many consequences on adhesion efficiency. Inexact cleavage of the N-terminus, or various point mutations within the EC1 domain of different cadherins, are sufficient to suppress their adhesive function. In particular, mutation of Trp2 to alanine (W2A) abolishes the adhesive capacity of several cadherins (Tamura et al., 1998). The highly conserved residue Trp2 docks into a hydrophobic pocket generated by Ala80, an element of the highly conserved HAV sequence. This docking is the last step for correct folding of EC1 allowing trans-interaction.
The two N-terminal domains of E-cadherin each have an Ig-like structure composed of seven antiparallel β-strands in two opposing sheets (Overduin et al., 1995). In X-ray crystallography, the EC1 domain of N-cadherin appears to dimerize in two different ways, exhibiting parallel and antiparallel orientations (Shapiro et al., 1995). Electron microscopy of a spontaneously oligomerized E-cadherin–COMP (cartilage oligomeric matrix protein) fusion protein (Tomschy et al., 1996) revealed a tip to tip interaction as well as a trans-association mediated only by the N-terminal region. A general model for cadherin-mediated interactions is that cadherin dimers on opposing cells form a zipper-like superstructure (Shapiro et al., 1995). Three calcium ions are bound at the junction between EC1 and EC2. However, the precise nature of the trans-interaction between cadherins has not yet been elucidated and remains controversial. Antiparallel contacts were not observed in the crystal assemblies of the EC1–2 domains of either N- or E-cadherins (Koch et al., 1999), and a multistep interaction has been described for the EC1–5 fragment of C-cadherin (Chappuis-Flament et al., 2001; Sivasankar et al., 2001).
To dissect cadherin-based adhesive interactions, we chose to decrease the number of parameters involved and focused on the first step of the interaction using only the two outermost domains of E-cadherin (E/EC1–2): EC1, responsible for the specificity of the interaction; and EC2, necessary for the formation of the interdomain calcium-binding pocket. We used these fragments to decorate model surfaces allowing us to mimic and study cadherin interactions.
Here we show that the E/EC1–2 fragment displayed intrinsic adhesive properties and was recognized actively and specifically by E-cadherin-expressing cells. We used a flow chamber at a very low shear rate as a powerful molecular approach to study specific trans-interaction dynamics at the single molecule level (Figure 1). This methodology allowed: (i) analysis of the association of surface-attached rather than soluble molecules reproducing a molecular orientation relevant to physiological conditions; (ii) highly sensitive detection of molecular interactions; and (iii) kinetic study of bond formation and dissociation. We used model particles coated with recombinant molecules to study intrinsic receptor properties, thus avoiding the difficulty of defining post-receptor events that are particularly important with cadherins. Our observations support the view that classical cadherins may interact via their EC1 module, and provide novel and detailed insights into the dynamics involved in regulating cadherin specificity and epithelial cell–cell adhesion.

Fig. 1. Diagram of a flow chamber. I, inlet; O, outlet; 1, chamber cavity; 2, mica sheet forming the chamber floor; 3, steel plate; S, screw; G, toric gasket.
Results
Expression and purification of recombinant cadherin fragments
The first objective was to produce sufficient amounts of the E/EC1–2 and E/W2A recombinant proteins. The wild-type (E/EC1–2) and this domain pair including the mutation W2A (E/W2A) as a control (W2A abolishes E-cadherin-mediated cell adhesion; Tamura et al., 1998) can be produced in bacteria as they have no glycosylation motifs (Figure 2A, lanes 1 and 2). These domain pairs include all putative calcium-binding motifs of the interface of domain 1 and 2. These His6-tagged fragments were extracted under partly denaturing conditions from inclusion bodies, affinity purified with nickel–Sepharose resin and refolded (Figure 2A, lanes 3 and 4). Furthermore, we used Coomassie Blue and western blotting to characterize both proteins and assess their purity (see Supplementary data available at The EMBO Journal Online for details). Only one band was detected by western blot using antibodies ECCD2 (Takara) and H-3 (Santa Cruz) specific for an epitope in the EC1 domain (not shown) or the histidine tag (Figure 2B).
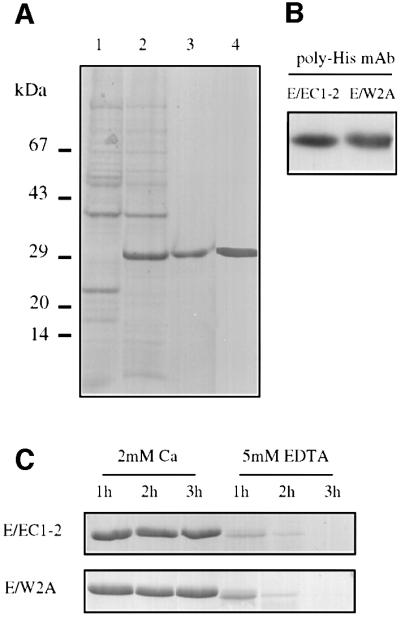
Fig. 2. Characterization of E/EC1–2 and E/W2A fragments. (A) Coomassie Blue stain of a 15% acrylamide gel showing lysates from transformed BL21(DE3) bacteria, with (lane 1) or without (lane 2) IPTG induction, and purified E/EC1–2 (lane 3) and E/W2A (lane 4) fragments. (B) Western blot detection of purified E/EC1–2 and E/W2A fragments using a polyhistidine antibody. (C) To test protein folding, both fragments were trypsin digested in the presence of Ca2+ or EDTA for the indicated times.
One of the hallmark features of cadherins is their resistance to proteolytic degradation in the presence of calcium (Nose et al., 1990). To determine whether the recombinant fragments were folded correctly, they were treated with trypsin in the presence or absence of calcium: trypsin cleavage sites are buried only in the fully folded proteins. In the absence of calcium (5 mM EDTA) or following heat denaturation (not shown), both fragments were degraded by trypsin. There were resistant to trypsin digestion in the presence of 2 mM Ca2+ for up to 3 h (Figure 2C). Thus, the E/EC1–2 and E/W2A preparations were folded correctly.
The two outermost modules of E-cadherin mediate calcium-dependent homophilic adhesion
Glass beads were decorated with E/EC1–2 and examined for their ability to aggregate. Casein- and E/W2A-decorated beads were used as non-adhesive controls.
Cadherin-mediated aggregation of coated beads was determined by measuring the formation of bead clusters with time. E/EC1–2 bead aggregation was observed under phase-contrast microscopy (Figure 3A). With calcium, E/EC1–2 beads aggregated (index 0.25), whereas beads decorated with W2A or casein did not (index 0.03; Figure 3B). In the presence of EDTA, E/EC1–2 and control beads remained dispersed after up to 45 min. To ensure that the difference in aggregation ability was not due to differences in the level of bead coverage, we verified that the density of E/EC1–2 and E/W2A on the beads used was similar by flow cytometry using the anti-EC1 antibody (data not shown).

Fig. 3. Specific E/EC1–2 bead self-aggregation. (A) Representative field of E/EC1–2-coated beads in the presence of CaCl2 or EDTA (bar = 5 µm). (B) Beads were allowed to aggregate in the presence of Ca2+ or EDTA. The aggregation index was high for E/EC1–2 beads, but not for E/W2A or control beads (casein or BSA). E/EC1–2 bead aggregation was Ca2+ dependent. Data are mean values of at least two independent experiments (∼4500 beads counted for each condition).
Specific recognition of cadherin fragments by cells expressing E-cadherin molecules was also investigated. We established a stable rat basophilic leukaemia cell line expressing full-length E-cadherin (E-RBL) as described in the Supplementary data (available at The EMBO Journal Online). Glass beads decorated with E/EC1–2 fragments were incubated with wild-type RBL (WT-RBL) and with E-RBL cells for 45 min and assayed for binding activity (Figure 4A). Seventy percent of E-RBL cells bound E/EC1–2 beads, but binding to E/W2A or casein beads (Figure 4B) was not higher than background whereas WT-RBL cells bound E/EC1–2 beads at the same level as background (not shown). E/EC1–2 beads bound to E-RBL cells both at 37°C and, with a lower efficiency, at room temperature.

Fig. 4. Specific binding of E/EC1–2 beads to E-cadherin-expressing cells. (A) Representative view of E-RBL cells following incubation with E/W2A or E/EC1–2 beads (bar = 5 µm). (B) E-RBL cells were incubated with E/EC1–2- or E/W2A-coated beads or with control beads. The numbers of cells with bound beads were recorded as a percentage of the number of total cells in the field. Data show the result of one experiment (at least 600 cells for each condition). Nearly 70% of E-RBL cells bound E/EC1–2 beads; only 30% of the cells bound E/W2A or control beads.
Flow chamber surfaces: characterization and determination of cadherin site density
We immobilized cadherin fragments on beads and mica sheets as model surfaces to mimic cellular membranes. The aim was to analyse cadherin interactions under flow and test the duration of an antiparallel interaction at the level of a single molecule, as opposed to other cellular events mediated by the complete cadherin–catenin complex during clustering or junctional assembly. Streptavidin beads were coated with biotinylated IgG, and then an anti-histidine IgG layer. Cadherin fragments were then fixed in an oriented manner by their histidine tag. These fragments were thus separated from the bead surface by a flexible spacer of ∼40 nm. When using mica sheets covered by nickel ions, fragments were linked directly via the histidine tag (Figure 5A).

Fig. 5. Characterization of the flow chamber interfaces. (A) Schematic representation. Coated beads under hydrodynamic flow can interact with fragments fixed and oriented on mica (bottom of the chamber) by the histidine tag. (B) Three-dimensional representation of confocal images of mica sheets covered with Alexa Fluor® 488–E/EC1–2 fragments. Fluorescence intensities for two E/EC1–2 densities are reported. For coating solution diluted 1/1000 (leading to a site density of 50–100 E/EC1–2 molecules/µm2) or more, the distribution was homogeneous. The scale represents fluorescence intensity in arbitrary units (au) (bar = 10 µm).
Alexa Fluor® 488-derivatized cadherin fragments were used to characterize the surfaces of the flow chamber and to estimate the surface density of immobilized proteins. Fragment density on beads was determined by flow cytometry using Alexa Fluor® 488–streptavidin beads for the calibration curve. The site density on the beads was 6900 E/EC1–2 fragments/µm2 assuming no intramolecular quenching (see Supplementary data available at The EMBO Journal Online). The bead surface was saturated and kept invariant for all experiments.
Mica coverage was analysed by confocal microscopy. Mica surfaces were incubated with dilutions of a stock of 20 µg/ml E/EC1–2 Alexa Fluor® 488. At high site density (dilution 1/250), the protein coating was heterogeneous (Figure 5B), possibly indicating aggregation. From 1/1000 (Figure 5B), the proteins were arranged in a homogenous layer. The average intensity decreased with increasing dilution. Using Alexa Fluor® 488–streptavidin as a reference for fluorescence (see Materials and methods), we estimated that the 1/1000 coverage corresponded to a site density of 50–100 molecules/µm2. Interaction lifetime measurements were carried out with saturated beads (6900 molecules/µm2) and with a binding site density on mica of 50–100 to 5–10 molecules/µm2.
Specific binding between E/EC1–2-coated beads and E/EC1–2-derivatized surfaces
To measure the lifetime of the homophilic E/EC1–2 interaction, we analysed the motion of E/EC1–2-coated beads on E/EC1–2-coated surfaces under flow. Numerous particle arrests of varying duration (Figure 6) were detected at a time resolution of 20 ms. At high densities of E/EC1–2 fragments on mica sheets (50–100 molecules/µm2), the binding frequency was 0.23 ± 0.21/s, under a relative low shear rate (∼8/s) (Figure 7). The presence of indole-3-acetic-acid (I3A), an inhibitor of these interactions (Tamura et al., 1998), reduced the binding frequency to 0.048 ± 0.009/s under the same conditions of site density and flow rate. This inhibitor molecule docks into a hydrophobic pocket of the EC1 domain and prevents the proper conformation of the adhesive interface. E/W2A fragments exhibited a similarly low binding frequency (0.05 ± 0.01/s). Both I3A and the point mutation on E/W2A act on the same folding step, by blocking the trans-interaction. This binding frequency was comparable to the background level obtained using an irrelevant protein [bovine serum albumin (BSA), 0.037 ± 0.009]. The binding frequency was concentration dependent: it was 0.11 ± 0.01/s for a surface density of E/EC1–2 fragments of 10–20 molecules/µm2 (data not show). These various observations indicated that the measured E/EC1–2 interaction was specific.

Fig. 6. A typical trajectory. The position of an E/EC1–2-coated bead driven along an E/EC1–2-coated surface is shown (top curve). The bead exhibited three arrests of 0.78, 1.24 and 0.38 s, respectively. The bead velocity was 6.84 µm/s before the first arrest, 6.6 µm/s between the first and the second arrest and 6 µm/s between the second and the third arrest. The bottom curve corresponds to the bead area.

Fig. 7. Adhesion specificity of E/EC1–2 fragments in the flow chamber. Mean values ± SDs for at least four independent experiments are reported. The tryptophan side chain analogue I3A inhibits E/EC1–2 interaction to values similar to those for E/W2A-coated beads or using an irrelevant protein.
Particle arrests are mediated mostly by single molecule interactions for surface density of binding sites of 50–100 molecules/µm2 or lower
It is very difficult to prove formally that binding events are representative of single molecule interactions. Nevertheless, three lines of evidence suggest that the arrests were mediated mostly by individual bonds when the surface density of E/EC1–2 fragments was 50–100 molecules/µm2 or lower. (i) At the lowest wall shear rate (7.5/s), the force exerted on tethers restraining a particle was ∼1.3 pN. In view of previously reported evidence (Bongrand, 1999), this is low enough for single bonds to be detectable. (ii) Particle detachment after arrest exhibited first-order kinetics during the first second following a binding event (Figure 8A), consistent with single bond formation (Pierres et al., 1996). (iii) At high site density (dilution 1/250), arrest duration was long (>3 s) (Figure 8B) although mica sheet coverage was heterogeneous. The detachment rate did not increase with decreasing surface density of binding sites on the chamber floor.

Fig. 8. Dissociation kinetics and dependence of dissociation rate on site density. (A) The motion of E/EC1–2-coated spheres along E/EC1–2-coated surfaces, and the duration of binding events were recorded. The number of bound particles was plotted against time after the initial stop. As shown for a representative example, the curve was linear on the time interval (0–1 s), consistent with first-order dissociation kinetics. (B) Mica surfaces were coated with various dilutions of an E/EC1–2 coating solution and used for dynamic study of interaction with E/EC1–2-coated spheres (wall shear rate 8/s). Each data point corresponds to 100–150 trajectory measurements; error bars are within the size of data points. At high protein density on mica (dilution 1/250), long arrest durations were observed (>3 s) corresponding to multiple binding interactions. At dilutions of 1/1000 (a site density of 50–100 E/EC1–2 molecules/µm2) or more, the dissociation rate was constant, indicating measurements of interactions between single E/EC1–2 fragments for binding site densities of 50–100 to 5–10 molecules/µm2.
Effect of a mechanical stress on the cadherin antiparallel interaction
The determination of bond lifetime is generally hampered by two difficulties. First, multiple bonds may yield artefactually low dissociation rates. This effect was minimized by the use of low surface densities of binding sites. Secondly, the dissociation rate of molecular bonds is expected to be increased by hydrodynamic forces (Bell, 1978): it was thus necessary to investigate the dependence of lifetime on force. The detachment rate increases with increasing wall shear rate in accordance with Bell’s law (Bell, 1978). As the force exerted on a tether during particle arrest is proportional to the wall shear rate, the force dependence of the bond dissociation rate koff was studied by varying the shear rate (Figure 9). Parameter koff exhibited exponential dependence on the force, F, applied on tethers following Bell’s law:

Fig. 9. Effect of the wall shear rate on the dissociation kinetics of the E/EC1–2 interaction. The dissociation rate of bead–surface attachments was determined for different values of wall shear rate and for site densities from 5–10 to 50–100 molecules/µm2. The force applied on bonds responsible for particle arrest was calculated as described in Materials and methods. Results are consistent with an exponential dependence of koff on the tension applied on tethers.
![]()
We found that the force coefficient F° was 2.4 pN and koff(0) was 0.45/s. This koff(0) value gives a bond duration of ∼2 s. Thus, the initial antiparallel contact between E-cadherin extracellular modules is highly labile, brief and easily breakable by mechanical stress.
Discussion
The two outermost domains of E-cadherin exhibit an intrinsic adhesive activity
The main purpose of this work was to analyse the initial event in the E-cadherin recognition step. To achieve this goal, we chose to focus on the two outermost modules of E-cadherin as the minimal segment to obtain a direct determination of the lifetime of initial E-cadherin homophilic interactions. Indeed, the multimodular organization of the extracellular segment makes several types of pair-wise interactions possible. For example, all of the domains could participate in adhesion, lining up to give complete antiparallel interdigitation such that EC1 pairs with EC5, EC2 with EC4, etc. (Chappuis-Flament et al., 2001; Sivasankar et al., 2001). However, the two outermost domains are the minimal portion of the protein required to study the trans-recognition step of cadherin interactions. We used a recombinant protein that retains calcium resistance towards trypsin digestion, a characteristic of cadherins. E-cadherin-expressing cells interact efficiently and specifically with E/EC1–2 beads. This interaction was abolished when Trp2 was mutated to alanine (E/W2A), a mutation causing the loss of both cell–cell adhesion in cell aggregation assays (Tamura et al., 1998) and trans-interaction of the full extracellular domain (Pertz et al., 1999).
E/EC1–2 was sufficient for Ca2+-dependent bead aggregation, indicating that the E/EC1–2 fragment retained its intrinsic adhesive properties. Preliminary experiments indicate that E/EC1–2 and E/EC1–5 adhesive behaviour are very similar. The immobilization of this cadherin fragment may mimic the ectodomain presentation when two adjacent cells first come into contact.
The need to measure cadherin interactions at the single bond level
The adhesive properties of cadherins are of central importance in developmental processes, in the structural integrity of tissues as well as in some pathologies. Cell–cell adhesion activities of cadherins have been evaluated mainly by cell aggregation assays. However, this approach gives mostly qualitative data as it is difficult to take into account the number of cadherin molecules involved. Moreover, cadherins are multimodular and involved in complex multimolecular structures, making it difficult to elucidate their biological properties. Recently, several different approaches have been used to study cadherin interactions at the molecular level. A surface force apparatus was used to investigate mechanisms of cadherin binding by measuring force/distance between cadherin ectodomains (Sivasankar et al., 2001). Single molecule atomic force microscopy (AFM) was used to study the mechanical resistance of cadherin interactions (Baumgartner et al., 2000). However, interpretation of the data was not straightforward: the relationship between the unbinding force, as measured by AFM, and the dissociation rate is complex and dependent on the cantilever stiffness and rate of sample displacement (Merkel et al., 1999). Nevertheless, these experiments have yet to give us a comprehensive view of the mechanisms underlying cadherin interactions.
An understanding of the intrinsic kinetic properties of cadherin interactions requires the measurement of parameters at the single molecule level, as it would be a hopeless task to derive molecular properties from the behaviour of multimolecular systems with an incompletely defined geometrical organization. This requires a way to bring into contact two surfaces covered with molecules correctly anchored, and a means of measuring the duration of the interaction. This is what we have accomplished with the flow chamber. The cadherin fragments are immobilized on both surfaces with little freedom for lateral clustering. Thus, our model does not represent cell behaviour as the lateral clustering is required for adhesion plaque formation (Adams et al., 1998). However, the absence of lateral diffusion may provide a unique opportunity to study single molecular bonds.
The E-cadherin recognition step is brief
The major contribution of this work is the determination of the kinetic properties of the single E-cadherin molecule recognition step. We monitored the movement of latex beads covered with E/EC1–2 across mica surfaces covered with the same fragments in the presence of a hydrodynamic force low enough for single bonds to mediate detectable particle arrest. This procedure previously allowed quantitative detection of 0.1 s interactions between the T lymphocyte CD2 receptor and its CD48 ligand with better time resolution than BIAcore™ measurements (Pierres et al., 1996). We were thus able to measure specific interactions in the range of 1 s between EC1–2 moieties. The lifetime of a single bond interaction between two modules of E/EC1–2 was estimated to be 2 s. The monomeric species has little or no activity (Brieher et al., 1996), and we assumed that these interactions involved E/EC1–2 dimers.
The slopes of experimental detachment curves for beads saturated with ligand were similar for cadherin densities on the floor of the chamber from 10 to 100 molecules/µm2. The fact that the duration of these arrests was unaltered when receptor density underwent a 10-fold change strongly supports the single bond hypothesis (Pierres et al., 1995), and the validity of the approach.
A number of arguments support the conclusion that we observed specific interactions between cadherin fragments: (i) binding frequency was dependent on receptor density on the bottom of the flow chamber; (ii) arrest durations were the same when the cadherin fragments were covalently bound to glass surfaces instead of via the histidine tag (not shown); and (iii) the adhesion frequency for the defective fragment (Trp2 mutant, see Figure 7) was substantially lower and similar to those for either an irrelevant protein such as BSA or in the presence of an inhibitor of the interaction, I3A. Our data confirmed that Trp2 is essential for the cadherin trans-interaction
This lifetime of ∼2 s corresponds to the contact lifetime between the adhesive interfaces of two cadherin molecules in an antiparallel orientation. Preliminary experiments indicate that E/EC1–5 exhibits similar kinetics with a detachment rate of the order of 1/s. The cadherin adhesive interface was first visualized by crystallography and was assigned to a large contact area (Shapiro et al., 1995). The buried surface area at the putative adhesive interface is ∼3300 Å2, and the interfacial region involves a number of long-range and water-mediated interactions (Shapiro et al., 1995; Koch et al., 1999). The crystal structure of E/EC1–2 (Nagar et al., 1996) suggested how cis-dimers might form by bridging the calcium-binding regions localized to the hinge region between domains. However, neither the antiparallel dimer interactions nor the putative interface were observed in the structures of the two EC1–2 domains of E- and N-cadherin (Koch et al., 1999). Site-directed mutagenesis and structural studies implicated certain amino acids and calcium ions in the active conformation. The burial of the lateral chain of Trp2 into a conserved hydrophobic cavity appears to be essential for trans-interactions, and other amino acids throughout the sequence are essential for adhesive activity (Nose et al., 1990). Nevertheless, the region involved in cadherin trans-interactions remains unknown.
Comparison with other adhesive molecules
The average lifetime between E/EC1–2 fragments in the presence of very low forces is of the order of 2 s and is similar to the lifetime of selectin–ligand bonds (Kaplanski et al., 1993; Alon et al., 1995). The CD2–CD48 interaction has higher dissociation rates (7.8/s; Pierres et al., 1996); the interaction between collagen-coated surfaces and activated integrins on keratinocytes has 100-fold lower dissociation rates (Masson-Gadais et al., 1999); extreme values of 6 × 10⁻³/s have been obtained for IgG–protein G interactions (Kwong et al., 1996); and the dissociation rate of the streptavidin–biotin interaction is too low to be detected in the absence of a substantial disruptive force (Merkel et al., 1999).
These values are consistent with the functions of the molecules: selectins mediate transient attachments responsible for leukocyte rolling along activated endothelial cells at several millimetres per second in blood vessel (von Andrian et al., 1991); activated integrins mediate much more durable interactions (Lawrence and Springer, 1991). The kinetics of the interaction between E-cadherin molecules is comparable to those for selectins, although E-cadherin establishes long-lasting interactions between epithelial cells.
The trans-interaction is sensitive to mechanical stress
When shear stress is increased above a certain level, the binding of beads to the chamber floor was not detected—presumably the interaction lasted less than a few milliseconds. The dependence of the detachment rate on applied forces followed Bell’s law (Bell, 1978), as observed in other systems (Chen and Springer, 2001). The force coefficient was very low (Fo = 2.4 pN), contrasting with values of 11 pN for the binding of IgG by protein G (Kwong et al., 1996), 32 pN for the CD2–CD48 interaction (Pierres et al., 1996) and 120 pN for P-selectin–ligand association (Alon et al., 1995; for a review see Bongrand, 1999). Fo is related to the distance between the equilibrium position of the ligand in a receptor site and an energy maximum corresponding to a transition state (Bell, 1978; Evans and Ritchie, 1997; Merkel et al., 1999). This distance x is equal to kBT/Fo, where kB is the Boltzmann constant and T is the absolute temperature. The distance corresponding to the experimental value of 2.4 pN for Fo is 1.5 nm, which is much higher than the expected range of ligand–receptor interactions. This might represent a long-range electrostatic interaction between opposite charges on approaching molecules. Such long-range interactions were observed in crystal structures of the N/EC1 domain (Shapiro et al., 1995), and also with the surface force apparatus (Leckband, 1995). They may guide encountering molecules into the appropriate orientation, thus increasing the association rate constant.
Binding frequency was inversely related to wall shear rate. However, modelling the ligand–receptor association as a standard bimolecular reaction with the kinetic constant kon, the binding frequency is independent of the wall shear rate: as confirmed experimentally with the CD2/CD48 interaction (Pierres et al., 1997), doubling the bead velocity would double the number of ligand–receptor encounters but halve the duration of interactions. As a prerequisite for the interaction, our observation is consistent with there being a weak and undetectably short binding state. Improving the time resolution of our apparatus may reveal intermediate binding steps, as reported previously (Pierres et al., 1995; Merkel et al., 1999; Evans et al., 2001). However, the sensitivity of our flow chamber method is limited by Brownian motion rather than the time resolution (Pierres et al., 2001). Thus, the only way to increase the time resolution would be to increase particle velocity, which is not feasible due to the decrease of binding efficiency. Alternatively, particles of much lower diameter could be used, but this would require improvement of the detection device and overcoming limitations due to finite sedimentation velocity and vertical Brownian motion.
Specificity and plasticity of the cadherin homophilic interaction
Our description of the initial cadherin trans-interaction may help elucidate cadherin homophilic interactions. The short lifetime of this interaction is unexpected for a tumour suppressor but may make cadherins very sensitive to subtle modifications of the adhesive interface. Indeed, various point mutations abolish cadherin-mediated cellular adhesion, and the substitution of two amino acid residues in the EC1 sequence is sufficient for E-cadherin to recognize P-cadherin (Nose et al., 1990). This weak trans-interaction could be the molecular basis for cadherin homophilic specificity and intercellular plasticity. A cell may adhere strongly via a few strong or irreversible bonds or many weak bonds. Strong bonds make it difficult for cells to detach. Indeed, cell migration on a surface coated with integrin ligands is impeded if adhesion is too strong (Palecek et al., 1997). In contrast, cadherin-mediated attachment may be slower than that with integrins, but remodelling of the contact area may be easier, with more control of the extent of contact areas through cadherin– cytoskeleton interactions. This may contribute to fine geometric regulation of epithelia.
During the recognition step, the cell membranes are close enough to allow other bonds to form. Trans-interactions form and dissociate asynchronously. Adhesion plaques can then be established following clustering and recruitment of cytoplasmic molecules linked to the actin network. This is consistent with observations of E-cadherin-mediated adhesive junctions (Adams et al., 1998): initial punctate structures are superseded by longer structures, leading to junctional plaque formation. The number of molecules involved, their ability to cluster as a functional zipper (Shapiro et al., 1995) and their stabilization by the cytoskeleton and associated proteins all need to be evaluated in order to gain a better understanding of cellular adhesion mechanisms in vivo. Analysis of longer cadherin fragments and cadherin-expressing cells may reveal how cadherins together with catenins and cytoplasmic signals modulate the formation and strength of adhesive bonds between cells.
Materials and methods
Protein production and purification
Details of the constructions of plasmids can be found in the Supplementary data (available at The EMBO Journal Online). Terrific broth medium containing 50 µg/ml kanamycin was inoculated with transformed colonies picked from agar plates. Expression was induced by the addition of isopropyl-β-d-thiogalactopyranoside (IPTG) for 2 h. Cell pellets were resuspended in lysis buffer (4 M urea, 50 mM Na2HPO4 pH 7.8, 20 mM imidazole and 20 mM β-mercaptoethanol). The lysate was clarified by centrifugation and the supernatant incubated with Ni2+-NTA–agarose resin (Qiagen). The beads were washed extensively with lysis buffer and then subjected to stepwise dialysis against phosphate-buffered saline (PBS).
Bead aggregation and bead–cell adhesion assays
Glass microbeads (2–3 µm diameter) were coated with either E/EC1–2 or E/W2A fragments or β-casein (Merkel et al., 1999; Perret et al., 2002). A total of 106 beads of each type were resuspended in HMF (10 mM HEPES, magnesium-free pH 7.4, 10 mM CaCl2) plus 0.05% casein, or HCMF (10 mM HEPES, calcium and magnesium-free pH 7.4, 1 mM EDTA) plus 0.05% casein in 24-well plastic plates and incubated for 45 min at 37°C in a rotary shaker at 45 r.p.m. The samples were photographed and the degree of bead aggregation was estimated from the decrease in particle number: aggregation index = (NEDTA – NCa)/NEDTA, where NCa and NEDTA are the numbers of bead particles with calcium and EDTA at the end of the incubation. The density of E/EC1–2 and E/W2A proteins on the beads was examined using a FACScan cytometer (Becton Dickinson), a rat monoclonal antibody against E-cadherin (Clone ECCD-2; Takara) and the Alexa Fluor® 488-labelled anti-rat IgG (Molecular Probes).
RBL cells or RBL-E-cadherin cells (clone 4A) grown on glass coverslips were incubated with glass beads coated with E/EC1–2 or E/W2A or casein for 1 h at 37°C in Dulbeco’s modified Eagle’s medium (DMEM), washed with PBS-Ca2+ under a 10 ml pipette outflow and fixed with 4% paraformaldehyde. The cells were photographed and those with at least one bead attached were scored.
Preparation of substrates for the flow chamber
Beads. Streptavidin-coated beads (2.8 µm in diameter and 1.3 g/l density; Dynabeads M280 from Dynal) were incubated (∼8 × 10⁸ beads/ml) for 30 min with 10 µg of biotinylated rat anti-mouse Ig (PharMingen) then 10 µg of mouse anti-histidine monoclonal antibody (clone His-1, Sigma) for 30 min. They were then incubated for 1 h with the histidine-tagged fragments, washed and resuspended in 1 mM PBS–EDTA until use in adhesion experiments.
Surfaces. Freshly cleaved mica surfaces (Muskovite mica, Metafix, Montdidier, France) were incubated with 1 mM NiCl2 (Sigma) for 1 min. Fragments were diluted to the desired coating concentration in PBS, 1 mM EDTA and deposited on each mica surface for 1 h at room temperature. The surfaces were then washed with PBS–EDTA. Control surfaces were prepared using the E/W2A mutant fragments or BSA. For I3A inhibition experiments, proteins fixed on the surfaces were incubated with 15 mM I3A for 15 min prior to the adhesion assays, performed with 15 mM I3A in the incubation medium.
Determination of cadherin site density
Flow cytometry was used to estimate cadherin site densities on the surface of latex and glass beads (see Supplementary data available at The EMBO Journal Online for details).
Mica sheets covered with Ni2+ ions were exposed to Alexa Fluor® 488–cadherin fragments using the same conditions as for the flow experiments. Microscope slides were coated with Alexa Fluor® 488– streptavidin by the same protocol as for the glass beads and used for calibration. The surfaces were then analysed by confocal laser scanning microscopy with a Leica TCS SP2 confocal microscope (Leica Lazer Tecknik, Heidelberg, Germany).
Laminar flow adhesion assays
Flow chamber. Chambers were assembled (Pierres et al., 1998) by applying molecularly smooth mica sheets to a plexiglas block with a cavity of 0.1 × 6 × 20 mm3 (Satim, Evenos, France; see Figure 1). The chamber was set on the stage of an inverted microscope (IX, Olympus, Japan) bearing a long-distance 40× dry objective (n.a. 0.55) and a CCD camera (SPT-M 108CE, Sony, Japan) connected to a videotimer (VTG 33, Mussetta, Marseille, France) and a videotape recorder. Typically, 1 ml of bead suspension (3 × 10⁶/ml) was driven through the chamber with a 5 ml syringe mounted on a syringe holder (Razel, Stamford, CT; supplied by Bioblock, Illkirch, France).
Particle tracking. Videotapes were analysed with a PCVision + digitizer (Imaging Technology, Bedford, MA; supplied by Imasys, Suresnes, France) mounted on an IBM-compatible desk computer. The pixel size was 0.31 µm. Custom software in assembly language allowed the separation of the interlaced fields forming each image, yielding 20 ms resolution. The sphere centre of gravity of each field was determined to 0.040 µm accuracy, and the area calculated to detect artefacts such as sphere collisions or doublet formation (Pierres et al., 1996). In a typical experiment, ∼100 particle trajectories were recorded, amounting to ∼20 000 events, defined as sets of four parameters: x and y coordinates of the projection of the sphere centre on the chamber floor, time and particle area.
Data analysis
Analysis involved three sequential steps: arrests definition, arrest counting (yielding the binding frequency) and measurement of arrest duration (yielding detachment curves).
Arrest definition. Custom software was used to analyse particle trajectories and detect arrests. A sphere was defined as arrested when it moved less than a threshold ξ during the time period τ. Particle arrest may result from binding or a random velocity fluctuation due to Brownian motion (Pierres et al., 2001). Thus, the minimal duration of detectable arrests was set by the wall shear rate. Optimal results for a wall shear rate of the order of 7/s were at 0.62 µm for ξ and 0.24 s for τ. Since the velocity of sphere flow close to the chamber floor was ∼6 µm/s under these conditions, the minimal duration of detectable arrests was ∼0.137 s (i.e. 0.24 – 0.62/6).
Binding frequency. The distance between flowing spheres and the chamber floor might vary due to either Brownian motion or incomplete sedimentation (Pierres et al., 2001). So that the binding frequency reflected the actual binding efficiency, we pooled the trajectory segments where the particle velocity was <0.8 times the product of the wall shear rate and sphere radius, corresponding to a sphere–surface separation lower than ∼1/10th the sphere radius (Goldman et al., 1967). The binding frequency was thus determined by dividing the number of arrests in an experiment by the total duration of motion of particles meeting the velocity limitation.
Detachment curves. The logarithm of the percentage of particles remaining was plotted against time. If arrests were due to single bonds, the plot is expected to be a straight line with a slope equal to the opposite of the off rate koff according to the following formula:
![]()
where N(t) is the number of particles remaining bound at time t after initial arrest.
Statistics. Meaningful determination of binding frequencies and detachment rates required the pooling of the results obtained for many different experiments. Thus, the results presented are based on the analysis of 279 000 particle positions, with 485 arrests, in 100 separate experiments. Standard errors could not be derived as usual by processing several separate results. Experimental error was thus estimated as follows, based on standard results from statistical theory: when n arrests were detected in N elementary displacements of 0.02 s duration (with typical values of 50 and 25 000 for n and N), the statistical standard error was calculated following binomial law as [n(N – n)/N3]1/2 (Snedecor and Cochran, 1980). Similarly, when N1 and N2 arrests lasting less and more than 1 s, respectively, were observed in a given set of experiments, the detachment rate koff could be calculated:
![]()
yielding for koff:
![]()
Using N11/2 and N21/2 for the standard error of N1 and N2, assuming Poisson distribution (Snedecor and Cochran, 1980), the statistical standard error for koff is [N1/N2(N1 + N2)]1/2.
Force exerted on tethers responsible for particle arrest. We wanted to determine the force dependence of the lifetime of cadherin interactions. It was thus necessary to relate the force exerted on a bond maintaining a sphere at rest and the wall shear rate. This can be derived from basic properties of mechanical equilibrium (Pierres et al., 1995). Neglecting particle deformation by hydrodynamic forces, the tension on a bond is given by the following formula:
![]()
where G is the wall shear rate, a is the particle radius, µ the medium viscosity and L the bond length. The force is thus only weakly dependent on the bond length. Using 40 nm for the effective bond length, the tension T (in pN) is 0.17 × G where G is in s–1.
Supplementary data
Supplementary data for this paper are available at The EMBO Journal Online.
Acknowledgments
Acknowledgements
We thank Anne Morel for excellent technical assistance, Dr Jean Salamero for confocal microscopy, and Drs Flavia Castellano and William Hempel for useful comments and suggestions. This work was supported by grants from INSERM/CNRS ‘Adhesion Cellules-Matériaux’, from the CNRS ‘PCV’ and ‘NOI’, the Association pour la Recherche sur le Cancer (ARC Subvention Libre 5147) and the Institut Curie. E.P. is supported by a fellowship from the Ministère de la Recherche et de la Technologie.
References
- Adams C.L., Chen,Y.T., Smith,S.J. and Nelson,W.J. (1998) Mechanisms of epithelial cell-cell adhesion and cell compaction revealed by high-resolution tracking of E-cadherin-green fluorescent protein. J. Cell Biol., 142, 1105–1119. [DOI] [PMC free article] [PubMed] [Google Scholar]
- Alon R., Kassner,P.D., Carr,M.W., Finger,E.B., Hemler,M.E. and Springer,T.A. (1995) The integrin VLA-4 supports tethering and rolling in flow on VCAM-1. J. Cell Biol., 128, 1243–1253. [DOI] [PMC free article] [PubMed] [Google Scholar]
- Baumgartner W., Hinterdorfer,P., Ness,W., Raab,A., Vestweber,D., Schindler,H. and Drenckhahn,D. (2000) Cadherin interaction probed by atomic force microscopy. Proc. Natl Acad. Sci. USA, 97, 4005–4010. [DOI] [PMC free article] [PubMed] [Google Scholar]
- Bell G.I. (1978) Models for the specific adhesion of cells to cells. Science, 200, 618–627. [DOI] [PubMed] [Google Scholar]
- Birchmeier W. and Behrens,J. (1994) Cadherin expression in carcinomas: role in the formation of cell junctions and the prevention of invasiveness. Biochim. Biophys. Acta, 1198, 11–26. [DOI] [PubMed] [Google Scholar]
- Boller K., Vestweber,D. and Kemler,R. (1985) Cell-adhesion molecule uvomorulin is localized in the intermediate junctions of adult intestinal epithelial cells. J. Cell Biol., 100, 327–332. [DOI] [PMC free article] [PubMed] [Google Scholar]
- Bongrand P. (1999) Ligand-receptor interactions. Rep. Prog. Physics, 62, 921–968. [Google Scholar]
- Brieher W.M., Yap,A.S. and Gumbiner,B.M. (1996) Lateral dimerization is required for the homophilic binding activity of C-cadherin. J. Cell Biol., 135, 487–496. [DOI] [PMC free article] [PubMed] [Google Scholar]
- Chappuis-Flament S., Wong,E., Hicks,L.D., Kay,C.M. and Gumbiner,B.M. (2001) Multiple cadherin extracellular repeats mediate homophilic binding and adhesion. J. Cell Biol., 154, 231–243. [DOI] [PMC free article] [PubMed] [Google Scholar]
- Chen S. and Springer,T.A. (2001) Selectin receptor-ligand bonds: Formation limited by shear rate and dissociation governed by the Bell model. Proc. Natl Acad. Sci. USA, 98, 950–955. [DOI] [PMC free article] [PubMed] [Google Scholar]
- Delmas V., Pla,P., Feracci,H., Thiery,J.P., Kemler,R. and Larue,L. (1999) Expression of the cytoplasmic domain of E-cadherin induces precocious mammary epithelial alveolar formation and affects cell polarity and cell-matrix integrity. Dev. Biol., 216, 491–506. [DOI] [PubMed] [Google Scholar]
- Evans E. and Ritchie,K. (1997) Dynamic strength of molecular adhesion bonds. Biophys. J., 72, 1541–1555. [DOI] [PMC free article] [PubMed] [Google Scholar]
- Evans E., Leung,A., Hammer,D. and Simon,S. (2001) Chemically distinct transition states govern rapid dissociation of single L-selectin bonds under force. Proc. Natl Acad. Sci. USA, 98, 3784–3789. [DOI] [PMC free article] [PubMed] [Google Scholar]
- Geiger B. and Ayalon,O. (1992) Cadherins. Annu. Rev. Cell Biol., 8, 307–332. [DOI] [PubMed] [Google Scholar]
- Goldman A., Cox,R. and Brenner,H. (1967) Slow viscous motion of a sphere parallel to a plane wall. II—Couette flow. Chem. Eng. Sci., 22, 653–660. [Google Scholar]
- Gumbiner B.M. (1996) Cell adhesion: the molecular basis of tissue architecture and morphogenesis. Cell, 84, 345–357. [DOI] [PubMed] [Google Scholar]
- Hyafil F., Morello,D., Babinet,C. and Jacob,F. (1980) A cell surface glycoprotein involved in the compaction of embryonal carcinoma cells and cleavage embryos. Cell, 21, 927–934. [DOI] [PubMed] [Google Scholar]
- Kaplanski G., Farnarier,C., Tissot,O., Pierres,A., Benoliel,A.M., Alessi,M.C., Kaplanski,S. and Bongrand,P. (1993) Granulocyte– endothelium initial adhesion. Analysis of transient binding events mediated by E-selectin in a laminar shear flow. Biophys. J., 64, 1922–1933. [DOI] [PMC free article] [PubMed] [Google Scholar]
- Koch A.W., Bozic,D., Pertz,O. and Engel,J. (1999) Homophilic adhesion by cadherins. Curr. Opin. Struct. Biol., 9, 275–281. [DOI] [PubMed] [Google Scholar]
- Kwong D., Tees,D.F. and Goldsmith,H.L. (1996) Kinetics and locus of failure of receptor-ligand-mediated adhesion between latex spheres. II. Protein–protein bond. Biophys. J., 71, 1115–1122. [DOI] [PMC free article] [PubMed] [Google Scholar]
- Larue L., Antos,C., Butz,S., Huber,O., Delmas,V., Dominis,M. and Kemler,R. (1996) A role for cadherins in tissue formation. Development, 122, 3185–3194. [DOI] [PubMed] [Google Scholar]
- Lawrence M.B. and Springer,T.A. (1991) Leukocytes roll on a selectin at physiologic flow rates: distinction from and prerequisite for adhesion through integrins. Cell, 65, 859–873. [DOI] [PubMed] [Google Scholar]
- Leckband D. (1995) The surface apparatus—a tool for probing molecular protein interactions. Nature, 376, 617–618. [DOI] [PubMed] [Google Scholar]
- Masson-Gadais B., Pierres,A., Benoliel,A.M., Bongrand,P. and Lissitzky,J.C. (1999) Integrin α and β subunit contribution to the kinetic properties of α2β1 collagen receptors on human keratinocytes analyzed under hydrodynamic conditions. J. Cell Sci., 112, 2335–2345. [DOI] [PubMed] [Google Scholar]
- Merkel R., Nassoy,P., Leung,A., Ritchie,K. and Evans,E. (1999) Energy landscapes of receptor–ligand bonds explored with dynamic force spectroscopy. Nature, 397, 50–53. [DOI] [PubMed] [Google Scholar]
- Nagar B., Overduin,M., Ikura,M. and Rini,J.M. (1996) Structural basis of calcium-induced E-cadherin rigidification and dimerization. Nature, 380, 360–364. [DOI] [PubMed] [Google Scholar]
- Nollet F., Kools,P. and van Roy,F. (2000) Phylogenetic analysis of the cadherin superfamily allows identification of six major subfamilies besides several solitary members. J. Mol. Biol., 299, 551–572. [DOI] [PubMed] [Google Scholar]
- Nose A., Nagafuchi,A. and Takeichi,M. (1988) Expressed recombinant cadherins mediate cell sorting in model systems. Cell, 54, 993–1001. [DOI] [PubMed] [Google Scholar]
- Nose A., Tsuji,K. and Takeichi,M. (1990) Localization of specificity determining sites in cadherin cell adhesion molecules. Cell, 61, 147–155. [DOI] [PubMed] [Google Scholar]
- Overduin M., Harvey,T.S., Bagby,S., Tong,K.I., Yau,P., Takeichi,M. and Ikura,M. (1995) Solution structure of the epithelial cadherin domain responsible for selective cell adhesion. Science, 267, 386–389. [DOI] [PubMed] [Google Scholar]
- Ozawa M., Baribault,H. and Kemler,R. (1989) The cytoplasmic domain of the cell adhesion molecule uvomorulin associates with three independent proteins structurally related in different species. EMBO J., 8, 1711–1717. [DOI] [PMC free article] [PubMed] [Google Scholar]
- Palecek S.P., Loftus,J.C., Ginsberg,M.H., Lauffenburger,D.A. and Howitz,A.F. (1997) Integrin-ligand binding properties govern cell migration speed through cell–substratum adhesiveness Nature, 385, 537–540. [DOI] [PubMed] [Google Scholar]
- Perl A.K., Wilgenbus,P., Dahl,U., Semb,H. and Christofori,G. (1998) A causal role for E-cadherin in the transition from adenoma to carcinoma. Nature, 392, 190–193. [DOI] [PubMed] [Google Scholar]
- Perret E., Leung,A., Morel,A., Feracci,H. and Nassoy,P. (2002) Versatile decoration of glass surfaces to probe individual protein–protein interactions and cellular adhesion. Langmuir, 18, 846–854. [Google Scholar]
- Pertz O., Bozic,D., Koch,A.W., Fauser,C., Brancaccio,A. and Engel,J. (1999) A new crystal structure, Ca2+ dependence and mutational analysis reveal molecular details of E-cadherin homoassociation. EMBO J., 18, 1738–1747. [DOI] [PMC free article] [PubMed] [Google Scholar]
- Pierres A., Benoliel,A.M. and Bongrand,P. (1995) Measuring the lifetime of bonds made between surface-linked molecules. J. Biol. Chem., 270, 26586–26592. [DOI] [PubMed] [Google Scholar]
- Pierres A., Benoliel,A.M., Bongrand,P. and van der Merwe,P.A. (1996) Determination of the lifetime and force dependence of interactions of single bonds between surface-attached CD2 and CD48 adhesion molecules. Proc. Natl Acad. Sci. USA, 93, 15114–15118. [DOI] [PMC free article] [PubMed] [Google Scholar]
- Pierres A., Benoliel,A.M., Bongrand,P. and van der Merwe,P.A. (1997) The dependence of the association rate of surface-attached adhesion molecules CD2 and CD48 on separation distance. FEBS Lett., 403, 239–244. [DOI] [PubMed] [Google Scholar]
- Pierres A., Feracci,H., Delmas,V., Benoliel,A.M., Thiery,J.P. and Bongrand,P. (1998) Experimental study of the interaction range and association rate of surface-attached cadherin 11. Proc. Natl Acad. Sci. USA, 95, 9256–9261. [DOI] [PMC free article] [PubMed] [Google Scholar]
- Pierres A., Benoliel,A.M., Zhu,C. and Bongrand,P. (2001) Diffusion of microspheres in shear flow near a wall: use to measure binding rates between attached molecules. Biophys. J., 81, 25–42. [DOI] [PMC free article] [PubMed] [Google Scholar]
- Shan W.S., Koch,A., Murray,J., Colman,D.R. and Shapiro,L. (1999) The adhesive binding site of cadherins revisited. Biophys. Chem., 82, 157–163. [DOI] [PubMed] [Google Scholar]
- Shapiro L. et al. (1995) Structural basis of cell–cell adhesion by cadherins. Nature, 374, 327–337. [DOI] [PubMed] [Google Scholar]
- Shirayoshi Y., Hatta,K., Hosoda,M., Tsunasawa,S., Sakiyama,F. and Takeichi,M. (1986) Cadherin cell adhesion molecules with distinct binding specificities share a common structure. EMBO J., 5, 2485–2488. [DOI] [PMC free article] [PubMed] [Google Scholar]
- Sivasankar S., Gumbiner,B. and Leckband,D. (2001) Direct measurements of multiple adhesive alignments and unbinding trajectories between cadherin extracellular domains. Biophys. J., 80, 1758–1768. [DOI] [PMC free article] [PubMed] [Google Scholar]
- Snedecor G. and Cochran,W. (1980) Statistical Methods. The Iowa State University Press, Ames, IA.
- Takeichi M. (1995) Morphogenetic roles of classic cadherins. Curr. Opin. Cell Biol., 7, 619–627. [DOI] [PubMed] [Google Scholar]
- Tamura K., Shan,W.S., Hendrickson,W.A., Colman,D.R. and Shapiro,L. (1998) Structure-function analysis of cell adhesion by neural (N-) cadherin. Neuron, 20, 1153–1163. [DOI] [PubMed] [Google Scholar]
- Tomschy A., Fauser,C., Landwehr,R. and Engel,J. (1996) Homophilic adhesion of E-cadherin occurs by a co-operative two-step interaction of N-terminal domains. EMBO J., 15, 3507–3514. [PMC free article] [PubMed] [Google Scholar]
- von Andrian U.H., Chambers,J.D., McEvoy,L.M., Bargatze,R.F., Arfors,K.E. and Butcher,E.C. (1991) Two-step model of leukocyte–endothelial cell interaction in inflammation: distinct roles for LECAM-1 and the leukocyte β2 integrins in vivo. Proc. Natl Acad. Sci. USA, 88, 7538–7542. [DOI] [PMC free article] [PubMed] [Google Scholar]
- Yap A.S., Brieher,W.M. and Gumbiner,B.M. (1997a) Molecular and functional analysis of cadherin-based adherens junctions. Annu. Rev. Cell. Dev. Biol., 13, 119–146. [DOI] [PubMed] [Google Scholar]
- Yap A.S., Brieher,W.M., Pruschy,M. and Gumbiner,B.M. (1997b) Lateral clustering of the adhesive ectodomain: a fundamental determinant of cadherin function. Curr. Biol., 7, 308–315. [DOI] [PubMed] [Google Scholar]