

Abstract
INTRODUCTION
Lipid regulation is crucial role in Alzheimer's disease (AD) pathogenesis. In AD, microglia show elevated sterol O‐acyltransferase 1/Acyl‐coenzymeA: Choleseterol Acyltransferase 1 (SOAT1) expression, encoding Acyl‐coenzymeA: Cholesterol Acyltransferase 1 (ACAT1), which produces cholesteryl esters (CEs) in lipid droplets. Inhibiting ACAT1 has been shown to reduce amyloid beta (Aβ) pathology, though the mechanism is unclear.
METHODS
We inhibited ACAT1 using avasimibe (AV) in wild‐type, triggering receptor expressed on myeloid cells 2 (TREM2) knockout (KO), and low‐density lipoprotein receptor related protein 1 (LRP1) KO mouse BV2 and human induced pluripotent stem cell‐derived microglia and measured the impact on Aβ uptake to determine the mechanism through which the inhibition of ACAT1 enhances Aβ uptake.
RESULTS
ACAT1 inhibition increased LRP1 levels and soluble TREM2 (sTREM2) release via enhanced TREM2 cleavage by ADAM metallopeptidase domain 10/17 (ADAM10/17). KO of TREM2 or blockade of sTREM2 release prevented AV‐enhanced Aβ uptake. This effect was rescued by recombinant sTREM2, but only when LRP1 was present.
DISCUSSION
ACAT1 inhibition promotes microglial Aβ uptake in a sTREM2‐ and LRP1‐dependent manner, offering insights into novel therapeutic strategies for AD.
Highlights
Inhibition of ACAT1, the major enzyme that catalyzes cholesterol storage via esterification enhances microglia‐mediated Aβ uptake.
Increased Aβ uptake is dependent on the presence of both TREM2 and LRP1.
Inhibition of ACAT1 increases cleavage of TREM2 via ADAM10/17 to release sTREM2.
Treatment of microglial cells with sTREM2 rescues Aβ uptake in TREM2 KO BV2 cells.
Inhibition of ACAT1 promotes Aβ uptake through increased shedding of TREM2, which enhances Aβ uptake through a LRP1‐dependent mechanism.
Keywords: ACAT1/SOAT1, Alzheimer's disease, amyloid beta, lipid droplets, LRP1, microglia, phagocytosis, TREM2
Abbreviations
- ACAT1/SOAT1
Acyl‐CoenzymeA: Cholesterol Acyltransferase 1
- Aβ
amyloid beta
- ADAM10/17
A disintegrin and metalloprotease
- AV
avasimibe
- CE
cholesteryl ester
- LRP1
low‐density lipoprotein receptor‐related protein 1
- TREM2
triggering receptor expressed on myeloid cells 2
1. BACKGROUND
The amyloid beta protein (Aβ) plays a central role in the pathogenesis of Alzheimer's disease (AD). 1 Aβ accumulates as oligomers and plaques, triggering neurodegeneration and cognitive decline. 2 Additionally, Alois Alzheimer originally reported the accumulation of lipid droplets in the glial cells of AD patients (translated in Stelzmann et al. 3 ). Cholesterol storage is predominantly driven by the resident endoplasmic reticulum protein Acyl‐coenzymeA: Cholesterol Acyltransferase 1 (ACAT1), 4 which catalyzes the esterification of cholesterol to produce cholesteryl esters (CEs). 5 , 6
Brain samples from late‐onset AD (LOAD) patients exhibit a 1.8‐fold increase in CE levels versus controls in vulnerable brain regions. 7 Additionally, multiple AD mouse models have shown 3‐ to 11‐fold higher CE levels in the brain compared to controls. 7 , 8 Finally, microglia isolated from vulnerable brain regions in various neurogenerative diseases, including LOAD, contain elevated levels of ACAT1 (sterol O‐acyltransferase 1 [SOAT1)]) mRNA. 9 These data have positioned ACAT1 as an attractive therapeutic target for AD.
ACAT1 inhibitors reduce Aβ‐induced neurotoxicity (reviewed in Shibuya et al. 10 and Chang et al. 11 ). Previous in vivo work from our lab showed that ACAT1 inhibition reduced Aβ production and deposition in AD mouse models. 12 Other studies showed that ACAT1 inhibition reduced AD pathology by promoting microglia‐mediated clearance of Aβ. 13 , 14 , 15 Furthermore, when lipid‐loaded microglia are treated with ACAT1 inhibitors, their ability to phagocytose Aβ improves. 15 While these studies showed a clear value of ACAT1 inhibition in reducing AD pathology, the mechanisms underlying these beneficial effects have remained unclear.
Triggering receptor expressed on myeloid cells 2 (TREM2) promotes phagocytosis of cholesterol‐rich substances 15 with TREM2‐enriched microglia found surrounding amyloid plaques. 16 , 17 Given the importance of TREM2 in microglial phagocytosis, cholesterol metabolism, and AD pathogenesis, we hypothesized that impaired cholesterol storage due to the inhibition of ACAT1 would lead to enhanced TREM2‐mediated uptake of Aβ by microglia.
Here, we demonstrate that TREM2 and low‐density lipoprotein receptor related protein 1 (LRP1) play central roles in the mechanism by which ACAT1 inhibition increases Aβ uptake by microglial cells. We show that enhanced uptake of Aβ by microglia following ACAT1 inhibition occurs via enhanced shedding of TREM2 by ADAM metallopeptidase domain 10/17 (ADAM10/17), leading to increased release of soluble TREM2 (sTREM2). Multiple studies have reported that sTREM2 binds Aβ, preventing its aggregation and increasing clearance. 18 , 19 , 20 We show that the treatment of microglial cells with recombinant sTREM2 enhances Aβ uptake to levels comparable to those observed following ACAT1 inhibition. Furthermore, in TREM2 knockout (KO) BV2 cells or when TREM2 shedding was prevented with ADAM10/17 inhibition, ACAT1 inhibition no longer enhanced Aβ uptake. We also show that ACAT1 inhibition increases protein levels of LRP1. LRP1 is a widely expressed receptor that was previously shown to enhance Aβ uptake, clearance, and degradation. 21 We show that LRP1 is required for microglial sTREM2‐mediated Aβ uptake, strongly suggesting LRP1 is a receptor for the internalization of the sTREM2–Aβ complex. In summary, we show that the inhibition of ACAT1 in microglial cells results in increased uptake of Aβ in a LRP1‐dependent manner via a mechanism in which TREM2 shedding is enhanced by increased ADAM10/17 cleavage. This novel mechanism of Aβ clearance provides a unique opportunity to utilize ACAT1 inhibitors or other therapeutic methods to induce the generation of sTREM2 and promote microglial Aβ uptake via LRP1.
2. METHODS
2.1. Cell culture
RESEARCH IN CONTEXT
Systematic review: Studies performed both in vivo and in vitro have shown inhibition of ACAT1 decreases AD pathology and amyloid induced neurotoxicity through impaired APP processing in neurons and by increased microglial phagocytosis of A). However, the mechanism by which microglial Aβ uptake is increased by ACAT1 inhibition has yet to be elucidated.
Interpretation: This study defines the mechanism by which decreased cholesterol storage via ACAT1 inhibition leads to increased Aβ uptake in microglial cells. Inhibition of cholesterol storage using ACAT1 inhibitors leads to enhanced shedding of TREM2 by ADAM10/17 to increase sTREM2 release, promoting the Aβ clearance via LRP1.
Future directions: Studies of cholesterol storage and the contribution of lipid droplet biology to AD pathogenesis afford new therapeutic avenues for treatment and prevention. These results warrant further research and consideration of repurposing ACAT1 inhibitors as both modulators of cholesterol content and regulators of microglial receptor (TREM2, LRP1) function to reduce amyloid load in AD.
BV2 microglial cells were maintained in Dulbecco's modified Eagle Medium (DMEM) supplemented with 10% fetal bovine serum, 2 mM L‐glutamine, 100 U/mL penicillin, and 100 µg/mL streptomycin (Catalogue No.: 15140122, Life Technologies) at 37°C in a humidified 5% CO2 incubator. The parental human induced pluripotent stem cell (hiPSC) line was obtained from the National Institute of Neurological Disorders and Stroke Human Cell and Data Repository (Cell line ID: ND41865, RUID: NN0003920; male, 64 years old). Cells were maintained in mTeSR Plus medium (STEMCELL Technologies Inc.) supplemented with 100 U/mL penicillin and 100 µg/mL streptomycin (Catalogue No.: 15140122, Life Technologies) on Matrigel‐coated (1%, v/v) tissue culture dishes at 37°C in a humidified 5% CO2 incubator. The medium was replaced daily, and cultures were monitored for spontaneous differentiation. Standard passaging of iPSC lines was performed at 70% to 80% confluency using enzyme‐free dissociation reagent ReLeSR (STEMCELL Technologies) according to the manufacturer's protocol. HiPSCs were differentiated to hiPSC‐derived microglial cells (iMGL) according to the protocol previously published by McQuade et al., with minor adjustments.22,23 The initial differentiation of iPSCs into hematopoietic progenitor cells (HPCs) were achieved using the Stem Cell Technologies STEMdiff Hematopoietic Kit (Catalogue No.: 05310) following the manufacturer's protocol. After day 12, hematopoietic differentiation was completed, and non‐adherent cells were collected by centrifugation at 300 × g for 5 min. On day 0 of the iMGL differentiation, ∼30,000/cm2 HPCs were plated on (1%, v/v) Matrigel‐coated 100‐mm dishes in 6 mL iMGL basal medium (DMEM‐F12, 2× B27, 0.5× N2, 1× Glutamax, 1× NEAA, 400 µM monothioglycerol, 5 µg/mL insulin, 2× insulin‐transferrin‐selenium, 100 U/mL penicillin, 100 µg/mL streptomycin, and 0.05% BSA) supplemented with 100 ng/mL IL‐34, 100 nM IDE1, and 25 ng/mL M‐CSF. On days 2, 4, 6, 8, and 10, 3 mL basal medium plus freshly thawed tri‐cytokine cocktail was added to the cells. On day 12, medium was collected, leaving 3 mL of conditioned medium in the dish, and non‐adherent cells were centrifuged at 300 × g for 5 min. The pelleted cells were returned to the dish and supplemented with fresh basal medium with tri‐cytokine cocktail. On days 14, 16, 18, 20, 22, and 24, 3 mL basal medium plus tri‐cytokine cocktail was added to the cells. On day 25, medium was collected, leaving 3 mL of conditioned medium in the dish, and non‐adherent cells were centrifuged at 300 × g for 5 min. Cells were resuspended in basal media supplemented with 100 ng/mL IL‐34, 100 nM IDE1, 25 ng/mL M‐CSF, 100 ng/mL CD200, and 100 ng/mL CX3CL1 to further mature microglia. On day 27, iMGLs were supplemented with basal medium and the five‐cytokine cocktail, after which they were matured and ready for functional analyses.
2.2. TREM2 knockout generation
The control hiPSC line (NDS00159) was electroporated to generate TREM2 KO clones. Briefly, a chemically modified single guide RNA (sgRNA) (5′‐CACAACACCACAGUGUUCCA‐3′) targeting exon 2 of TREM2 (Transcript ID: ENST00000373113.8, chr6:41,161,583, GRCh38/hg38) was combined with Cas9 protein to form ribonucleoprotein (RNP) complexes. The RNP complexes were delivered to iPSCs via optimized electroporation parameters. As a positive control, cells were also transfected with RELA‐targeting sgRNA. After transfection, cells were recovered for 2 days in mTeSR Plus medium before analysis. All experiments were performed at Synthego.
Editing efficiency was assessed by polymerase chain reaction amplification of the targeted region using forward (5′‐GGTAGAGACCCGCATCATGG‐3′) and reverse (5′‐CCATCCGCTCCCAACTTGTA‐3′) primers, followed by Sanger sequencing. Sequence chromatograms were analyzed using Synthego's Inference of CRISPR Edits (ICE) software to determine indel frequency.
Single cells from the edited pool were isolated by single‐cell dilution for clonal expansion. Wells were imaged every 2 to 3 days to ensure true clonality. No selection agents were used during the clonal isolation process. Expanded clones were genotyped by Sanger sequencing, and two homozygous KO clones (B6 and E3) were selected for further characterization. Both selected clones contained a +1 insertion at the Cas9 cleavage site, creating frameshift mutations that disrupted the TREM2 coding sequence.
The selected clones were expanded to passage 12 for final characterization and quality control. Wild‐type (WT) control cells were generated via mock transfection and processed in parallel through passage 6. All cell lines tested negative for mycoplasma contamination. The final cell lines were cryopreserved at a concentration of 0.5 × 10⁶ cells per vial. A quality control report from Synthego is available.
2.3. Cell treatments
Cells were subcultured and seeded into culture dishes, grown to 80% confluency, and then treated with stated concentrations and times of ACAT1 inhibitor avasimibe (AV) (HY‐13215) and/or ADAM10/17 inhibitor GW280264X (Ai). Aβ42 (Bachem, Catalogue No.: 4014447) was added directly to the media of treated cells at either 300 nM (BV2) or 150 nM (iMGL) and incubated for 3 h (BV2) or 1.5 h (iMGL). When stated, 40 nM sTREM2 recombinant protein (TR2‐M52H3) was added directly to the medium of treated cells immediately before Aβ42. When stated, 250 nM RAP (EMD Millipore, Catalogue No.: 553506) was added directly to the medium of treated cells 30 min prior to the addition of Aβ42. For conditioned medium (CM) experiments, BV2 cells were subcultured into culture dishes and allowed to attach overnight. At 80% confluency, cells were treated with either DMSO (CNT) or 10 µM AV for 24 h. After 24 h, medium was removed and placed on BV2 cells, which were simultaneously treated with either DMSO or 10 µM AV for 24 h. Subsequently, 300 nM Aβ42 was added directly to the CM of treated cells incubated for 3 h. When stated, 250 nM RAP was added directly to the CM of treated cells 30 min prior to the addition of Aβ42.
2.4. Cholesterol analysis
Cells were treated with hexane:isopropanol (3:2, v/v) to extract lipids. Cholesterol levels were measured using Amplex Red Cholesterol Kit (Invitrogen). From the hexane: isopropanol extraction the dried organic layer was reconstituted in the provided 1× reaction buffer containing 0.1% NP‐40. Samples were plated on 96‐well plates, then exposed to either total cholesterol reaction buffer or free cholesterol reaction buffer. Fluorescence was measured using a plate reader at 530:590 nm excitation:emission. A standard curve was prepared using the standard solution included. Total and free cholesterol levels were calculated using the standard curve. Cholesteryl ester levels were calculated by subtracting free cholesterol levels from total cholesterol levels after being normalized to total protein levels determined by BCA analysis.
2.5. ELISA assays
Levels of Αβ42 peptide in cell lysates were determined using Fujifilm Human/Rat Αβ (1‐42) ELISA Kit Wako, high sensitivity. In brief, samples and a standard curve were plated in the antibody‐coated microplate and diluted using the standard diluent provided. The plate was sealed and incubated overnight at 4°C. The solution was then discarded, and the wells were washed five times with the provided wash solution. The HRP‐conjugated antibody solution was added to wells and incubated for 1 h at 4°C. The antibody solution was then removed, and wells were washed five times with the provided wash solution. TMB solution was added to wells to begin the HRP reaction and incubated for 30 min at room temperature in the dark, then the stop solution was added to terminate the reaction. Absorbance was read at 450 nm using a BioTek multimode reader, and Αβ (1‐42) concentration was calculated using the standard curve and normalized to total protein levels determined by BCA analysis.
Levels of extracellular TREM2 were measured using Abcam Mouse TREM2 SimpleStep ELISA Kit–Extracellular (Ab309115). In brief, samples and a standard curve were prepared using the standard diluent, with medium being diluted 1:100. The freshly prepared antibody cocktail was added to the well, and the plate was sealed and incubated for 1 h at room temperature on a plate shaker at 400 rpm. The solution was then discarded, and the wells were washed three times with the provided wash solution. TMB solution was added to wells and incubated on the plate shaker for 5 min. Stop solution was added to terminate the reaction and absorbance was read at 450 nm. Extracellular TREM2 concentration was calculated using the standard curve and normalized to total protein levels determined by BCA analysis. Table S1 shows all raw concentration values for ELISA‐based assays.
2.6. Immunoblotting
Cell lysate samples were separated by 4% to 12% gradient Bis‐Tris gels (Life Technologies) and transferred to PVDF membranes using iBlot2 Transfer Stack and iBlot 2 Gel Transfer Device (Invitrogen). Blots were then incubated with SuperBlock Blocking Buffer (Thermo Fisher Scientific) for 1 h at room temperature with rocking, followed by incubation with primary antibody (Anti‐TREM2 D8I4C [91068S], Anti‐β‐actin [4967S], and Anti‐LRP1 [64099S] from Cell Signaling) (1:1000) overnight at 4°C with gentle rocking. Blots were washed five times before incubation with appropriate HRP‐conjugated secondary antibody at room temperature for 1 h with rocking. After five washes, Pierce ELC Western blotting substrate (Thermo Fisher Scientific) was applied. Images were captured by the Odyssey Platform (LI‐COR) and analyzed by FIJI/ImageJ software (National Institutes of Health). If necessary, blots were then incubated with mild stripping buffer (1.5% glycine, 1% SDS, and 1% Tween‐20, pH 2.2) for 1 h with rocking before reprobing with another primary antibody.
3. RESULTS
3.1. ACAT1 inhibition decreases cholesteryl esters and increases Aβ uptake in mouse BV2 and human microglial cells
Inhibition of ACAT1 prevents the formation of CEs, providing a measurable parameter to assess the efficacy of the ACAT1 inhibitor, AV, in microglial cells. 13 , 24 To optimize AV treatment, we treated WT BV2 microglial cells with increasing concentrations of AV for 24 h, after which CE levels were analyzed. A 24‐h treatment with AV decreased CE levels at nearly all concentrations (Figure 1A) in a dose‐dependent manner, with 2.5 µM and 5 µM AV decreasing CE by roughly 20% and 10 µM and 15 µM leading to an ∼30% decrease in CE levels compared to control treated cells. These findings demonstrate that AV inhibits CE production in BV2 microglia cells.
FIGURE 1.

ACAT1 inhibition decreases cholesteryl ester levels and increases Aβ42 uptake in human and mouse microglial cells. (A and B) Mouse WT BV2 cells were treated with increasing concentrations of AV for 24 h prior to 300 nM Aβ42 incubation for 3 h. (C and D) Human WT iMGL cells were treated with 10 µM AV for 24 h prior to 150 nM Aβ42 incubation for 1.5 h. (A–C) CE levels were calculated by subtracting free cholesterol from total cholesterol, which was measured using a fluorometric assay and normalized to total protein. Histograms show quantification of CE normalized to total cholesterol expressed as mean ± SEM of at least three independent experiments relative to control (CNT) (*p < 0.05, **p < 0.01, ***p < 0.001, ****p < 0.0001). (B–D) Aβ42 uptake was analyzed from cell lysates that were quantified using an ELISA detection method, histograms show quantification as mean ± SEM normalized to total protein of three independent experiments relative to CNT (*p < 0.05 and** p < 0.01). Statistical analysis was performed using a one‐way ANOVA with Tukey's post hoc test (A–B) or unpaired t‐test (C and D). Aβ, amyloid beta; ACAT1, acyl‐coenzymeA: Cholesterol Acyltransferase 1; AV, avasimibe; CE, cholesteryl ester; ELISA, enzyme‐linked immunosorbent assay; iMGL, human induced pluripotent stem cell‐derived microglial cell; WT, wild type.
Next, we assessed the uptake of synthetic Aβ42 following 24 h of AV treatment in WT BV2 microglial cells. Aβ42 was added directly to the medium of AV treated and control treated cells, and the cells were incubated at 37°C, allowing for Aβ42 uptake. Internalized Aβ42 was then measured in cell lysates. Aβ42 uptake significantly increased by 195.8% and 237.9% following treatment with 10 and 15 µM AV, respectively (Figure 1B). In iMGLs, 10 µM AV treatment for 24 h decreased CE levels by 43.1% (Figure 1C) and increased Aβ uptake by 95.5% (Figure 1D). Taken together, these data show AV treatment prevents the formation of CE by ACAT1 in both mouse BV2 and human iMGL cells, leading to increase Aβ uptake in a dose‐dependent manner.
3.2. TREM2 is required for increasing Aβ42 uptake following ACAT1 inhibition in human microglial cells
Next, we asked whether the increase in microglial uptake of Aβ following ACAT1 inhibition was dependent on TREM2, a myeloid‐specific receptor that binds multiple ligands with high affinity, including Aβ. Binding of high‐affinity ligands to TREM2 initiates multiple signaling cascades through the ITAM domain of DAP12, which leads to a diverse set of functional responses, including transcriptional regulation, metabolic changes, and phagocytosis. 25 , 26 To determine whether TREM2 is required for increased Aβ uptake following ACAT1 inhibition, we first tested TREM2 KO iMGLs. Figure 2A shows that KO of TREM2 significantly reduced Aβ42 uptake in iMGLs (by 40.5%) compared to WT iMGLs. To determine whether TREM2 is also required for AV‐mediated increased Aβ42 uptake in hiMGLs, we treated both WT and TREM2 KO iMGLs with DMSO control (CNT) or 10 µM AV for 24 h. Following AV treatment, we added 150 nM synthetic Aβ42. After 1.5 h, the cells were lysed, and internalized Aβ42 was measured. TREM2 KO abrogated the ability of AV to augment microglial Aβ42 uptake as compared to WT cells (Figure 2B). WT iMGLs treated with AV exhibited a 95.5% increase in Aβ42 uptake compared to control treated WT iMGLs and a 122.6% increase compared to control treated TREM2 KO iMGLs. However, no significant change in Aβ42 uptake was observed in TREM2 KO iMGLs treated with AV compared to control treated TREM2 KO iMGLs. When comparing WT versus TREM2 KO iMGLs, both treated with AV, we observed a 130.5% increase in Aβ42 uptake in WT iMGLs versus TREM2 KO iMGLs. Collectively, these data demonstrate that augmented uptake of Aβ42 by human iMGLs treated with ACAT1 inhibitors is dependent on the presence of TREM2.
FIGURE 2.

TREM2 is required for increased Aβ42 uptake in human iMGLs following ACAT1 inhibition. (A) Uptake of 150 nM Aβ42 was measured after a 1.5 h incubation in WT and TREM2 KO iMGLs. (B) WT and TREM2 KO iMGLs were treated with 10 µM AV for 24 h prior to 150 nM Aβ42 incubation for 1.5 h. Aβ42 uptake was assessed using cell lysates, quantifying Aβ42 using an ELISA detection method. Histograms show quantification as mean ± SEM (***p < 0.001, ****p < 0.0001) normalized to total protein of three independent experiments relative to WT (A) or WT control (CNT). (B) Statistical analysis was performed using a two‐way ANOVA with Tukey's post hoc test (B) or unpaired t‐test (A). Aβ, amyloid beta; ACAT1, acyl‐coenzymeA: cholesterol acyltransferase 1; ANOVA, analysis of variance; ELISA, enzyme‐linked immunosorbent assay; iMGL, human induced pluripotent stem cell‐derived microglial cell; KO, knockout; TREM2, triggering receptor expressed on myeloid cells 2; WT, wild type.
3.3. Conditioned medium of ACAT1 inhibitor treated microglia drives increased Aβ42 phagocytosis
Next, we investigated the mechanism by which TREM2 contributes to the enhanced uptake of Aβ42 following ACAT1 inhibition. We initially hypothesized ACAT1 inhibition would lead to increased TREM2 protein levels, resulting in increased phagocytosis of Aβ. However, Western blot analysis revealed that treatment of WT BV2 cells with AV decreased full‐length TREM2 protein levels (47.2%) (Figure 3A,B). While initially surprising, decreasing TREM2 protein levels is a suitable physiological response to protect cells with impaired cholesterol storage from further internalizing cholesterol‐rich substances.
FIGURE 3.
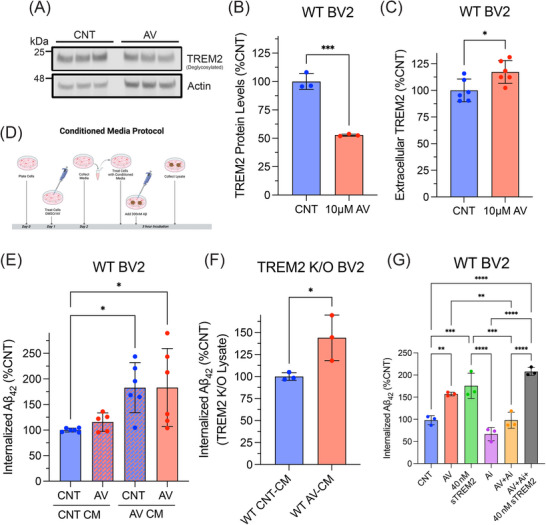
ACAT1 inhibition enhances soluble TREM2 protein levels required for increased microglial uptake of Aβ42. WT BV2 cells treated with 10 µM AV for 24 h. Cell lysate was collected and analyzed using SDS‐PAGE. (A) Western blot image of three experimental replicates measuring TREM2 and actin in WT BV2 cells. (B) Histograms show quantification of TREM2 levels using ImageJ and normalized to actin expressed as mean ± SEM (**p < 0.01). Statistical analysis was performed using an unpaired t‐test. (C) Extracellular TREM2 quantified using a sandwich ELISA. Histograms show quantification of TREM2 in the medium normalized to total protein from cell lysate expressed as mean ± SEM of at least three independent experiments relative to DMSO control treated cells (CNT) (*p < 0.05). Statistical analysis was performed using an unpaired t‐test. (D) Schematic of CM experimental design. Medium was collected from WT BV2 cells treated with 10 µM AV or DMSO (CNT) after 24 h, then placed on different WT BV2 cells previously treated with DMSO (CNT) or 10 µM AV for 24 h, then incubated with 300 nM Aβ42 for 3 h. (E) WT BV2 cells treated with CNT or AV for 24 h then treated with CNT or AV CM immediately before a 3‐h 300 nM Aβ42 incubation. (F) TREM2 KO BV2 cells were treated with WT CNT‐CM or WT AV‐CM immediately before a 3‐h 300 nM Aβ42 incubation. (G) WT BV2 cells treated with DMSO (CNT), 10 µM AV, or 3 µM ADAM10/17 inhibitor (GW280264X) (Ai) for 24 h followed by a 3‐h incubation with 300 nM Aβ42 and 40 nM sTREM2 as stated. (E–G) Aβ42 uptake was measured from cell lysate using an ELISA‐based assay. Histograms show quantification of internalized Aβ42 normalized to total protein expressed as mean ± SEM of at least three independent experiments relative to CNT CNT‐CM (E), WT CNT‐CM (F), CNT (G) (*p < 0.05, **p < 0.01, ***p < 0.001, ****p < 0.0001). Statistical analysis was performed using a one‐way ANOVA with Tukey's post hoc test (E–G) or unpaired t‐test (F). Aβ, amyloid beta; ACAT1, acyl‐coenzymeA: cholesterol acyltransferase 1; ADAM10/17, ADAM metallopeptidase domain 10/17; ANOVA, analysis of variance; AV, avasimibe; CM, conditioned medium; ELISA, enzyme‐linked immunosorbent assay; TREM2, triggering receptor expressed on myeloid cells 2; WT, wild type.
We next explored how a decrease in full‐length TREM2 affected Aβ uptake in AV treated microglial cells with impaired cholesterol storage. Prior studies have shown the extracellular sTREM2 fragment, produced by cleavage and shedding of full‐length membrane TREM2, binds Aβ, prevents fibrilization, and enhances Aβ phagocytosis. 27 Using a sandwich ELISA, we measured extracellular levels of sTREM2 in the cell culture medium following AV treatment. sTREM2 levels were significantly increased (17.3%) compared to control‐treated cells (Figure 3C). Thus, ACAT1 inhibition promotes cleavage of membrane TREM2 and shedding of sTREM2 into the culture medium, leading to the hypothesis that it then binds Aβ and enhances microglial uptake.
To test this hypothesis, we first asked whether CM from AV treated WT BV2 microglia cells was necessary and sufficient to increase microglial Aβ42 uptake. Figure 3D shows a schematic of the experimental design for the CM experiments (also described in the methods section). Briefly, WT BV2 cells were treated with 10 µM AV or DMSO (CNT) for 24 h. CM from these cells was then collected and added to new cells, which had been treated with either 10 µM AV or DMSO (CNT) for 24 h. Immediately following the replacement of medium, 300 nM Aβ42 was added to the cells and incubated for 3 h. This resulted in four treatment conditions, for which we measured Aβ42 uptake in WT BV2 cells: (1) CNT treated cells incubated with CNT‐CM (CNT CNT‐CM), (2) AV treated cells incubated with CNT‐CM (AV CNT‐CM), (3) CNT treated cells incubated with AV‐CM (CNT AV‐CM), and (4) AV treated cells incubated with AV‐CM (AV AV‐CM).
Analysis of Aβ42 uptake revealed AV‐CM significantly increased Aβ42 uptake in CNT treated cells (82.9%) and AV treated cells (83.1%) compared to WT BV2 cells, which were not treated with AV‐CM (CNT CNT‐CM) (Figure 3E). These findings indicate that CM from AV treated cells is sufficient for augmenting Aβ42 uptake in microglia. In WT BV2 cells treated with AV overnight, in which the medium was then removed and replaced with CNT‐CM, Aβ42 uptake was unchanged (Figure 3E). These data indicate that components in the medium following AV treatment are necessary for inducing increased uptake of Aβ42 in microglia. Collectively, these findings demonstrate that factors released into the CM by AV treated microglia are both sufficient and necessary to increase microglial Aβ42 uptake following ACAT1 inhibition. Furthermore, these data suggest that depletion of intracellular CE levels following ACAT1 inhibition with AV is responsible for the elevation in soluble factors that are released by microglia and enhance Aβ42 uptake.
3.4. Increased levels of sTREM2 in CM of ACAT1 inhibitor treated microglia drive enhanced microglial Aβ42 phagocytosis
We next investigated the role of increased levels of sTREM2 in the CM of AV treated microglia in augmented microglial Aβ42 uptake. For this purpose, we first analyzed Aβ42 uptake in TREM2 KO BV2 cells treated with WT CNT‐CM or WT AV‐CM. WT AV‐CM significantly increased (43.9%) Aβ42 uptake in TREM2 KO BV2 cells compared to TREM2 KO cells treated with WT CNT‐CM (Figure 3F). These data prompted us to further test whether sTREM2 was a necessary component in AV‐CM that drives enhanced Aβ42 uptake in microglia. For this purpose, we investigated whether preventing the cleavage of TREM2 by its major sheddases, ADAM10/17, using the ADAM10/17 inhibitor, GW280264X, abrogated ACAT1 inhibitor‐mediated augmentation of microglial Aβ42 uptake. Figure 3G shows that the inhibition of ADAM10/17 with GW280264X alone does not significantly change Aβ42 uptake compared to control treated cells, suggesting that, at this concentration and treatment time, processing of proteins involved in Aβ uptake, for example, RP1, are not impacted in WT BV2 microglia. When GW280264X treatment was combined with AV treatment, Aβ42 uptake was no longer increased compared to control treated cells; AV treatment alone increased uptake by 57.1% (Figure 3G). These results indicate that ADAM10/17 activity alone does not significantly contribute to baseline Aβ42 uptake but is necessary for the enhancement of microglial Aβ42 uptake following inhibition of ACAT1.
Having shown cleavage of TREM2 by ADAM10/17 was necessary for the enhancement of microglial Aβ42 uptake following inhibition of ACAT1, we next asked whether supplementation with recombinant sTREM2 protein could rescue the effects of ADAM10/17 inhibition using GW280264X on AV‐enhanced microglial Aβ42 uptake. The addition of sTREM2 increased Aβ42 uptake in a concentration‐dependent manner, with 40 nM, but not 20 nM sTREM2 significantly increasing Aβ42 uptake compared to control treated cells (Figure S1). Additionally, Figure 3G shows that the addition of 40 nM sTREM2 to WT BV2 cells significantly increased Aβ42 uptake by 75.6% compared to control treated cells; this is comparable to the 57.2% increase in Aβ42 uptake that was observed with AV treatment. Importantly, 40 nM sTREM2 also rescued the effect of ADAM10/17 inhibition in AV treated WT BV2 cells, significantly increasing Aβ42 uptake by 107.9% compared to control treated cells (Figure 3G). Taken together, these data strongly suggest that the release of sTREM2 via ADAM10/17‐mediated cleavage of membrane TREM2 is the major driver of increased Aβ uptake following ACAT1 inhibition in microglia.
3.5. LRP1 is required for enhanced sTREM2‐mediated Aβ42 uptake following ACAT1 inhibition in microglia
sTREM2 has been shown to bind Aβ and prevent its oligomerization and fibrillation, as well as increase Aβ phagocytosis. 27 However, the mechanism by which sTREM2 increases internalization of Aβ has remained unknown. LRP1, a well‐known receptor playing roles in lipid metabolism, 28 protein clearance, 29 and cell signaling, 30 , 31 has also been implicated in AD pathology. 21 , 32 , 33 Since LRP1 regulates intracellular signaling events involved in lipid metabolism, cholesterol storage, and fatty acid synthesis, 28 we next investigated whether LRP1 played a role in sTREM2‐dependent augmentation of microglial Aβ uptake following ACAT1 inhibition.
First, we observed that WT BV2 cells treated with 10 µM AV for 24 h exhibited significantly increased protein levels of LRP1 (102.7%) compared to DMSO CNT treated cells (Figure 4A and B). In Figure 4C, we show that Aβ42 uptake in LRP1 KO BV2 cells was significantly decreased (64.16%) compared to WT BV2. ACAT1 inhibition was unable to increase Aβ42 uptake in LRP1 KO BV2 microglial cells compared to control cells (Figure 4C). Taken together, these data indicate that LRP1 is required for AV‐mediated enhancement of microglial Aβ42 uptake.
FIGURE 4.
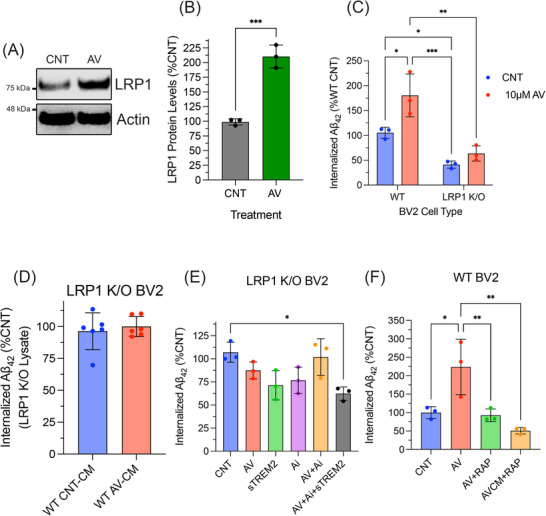
LRP1 is a receptor for sTREM2:Aβ complex and is required for increased microglial Aβ uptake following ACAT1 inhibition. WT BV2 cells treated with 10 µM AV) for 24 h. Cell lysate was collected and analyzed using SDS‐PAGE. (A) Representative Western blot image measuring LRP1 and actin in WT BV2 cells. (B) Histogram shows quantification of at least three independent experiments expressed as mean ± SEM (***p < 0.001). Statistical analysis was performed as an unpaired t‐test. (C) WT and LRP1 KO BV2 cells were treated with DMSO (CNT) or 10 µM AV for 24 h followed by a 3‐h incubation with 300 nM Aβ42. Quantification of internalized Aβ42 was performed on cell lysate using an ELISA‐based assay normalized to total protein levels expressed as mean ± SEM of at least three independent experiments relative to WT CNT (**p < 0.01, ***p < 0.001, ****p < 0.0001). Statistical analysis was performed using a two‐way ANOVA with Tukey's post hoc test. (D) Quantification of internalized Aβ42 from LRP1 KO cells treated with CNT or AV CM from WT BV2 cells of at least three independent experiments as mean ± SEM. Statistical analysis was performed as an unpaired t‐test. (E and F) WT BV2 cells treated under stated conditions were compared to CNT Aβ42 uptake. Histograms show quantification of internalized Aβ42 normalized to total protein expressed as mean ± SEM of at least three independent experiments relative to CNT (*p < 0.05, **p < 0.01, ***p < 0.001, ****p < 0.0001). Statistical analysis was performed using an one‐way ANOVA with Tukey's post hoc test. Aβ, amyloid beta; ANOVA, analysis of variance; AV, avasimibe; CM, conditioned medium; CNT, control; ELISA, enzyme‐linked immunosorbent assay; LRP1, low‐density lipoprotein receptor related protein 1; sTREM2, soluble triggering receptor expressed on myeloid cells 2; WT, wild type.
KO of LRP1 could also impact protein levels of other receptors involved in cholesterol metabolism, for example, TREM2, which would limit the amount of sTREM2 released and AV‐induced Aβ42 uptake. To address this possibility, we measured TREM2 protein levels in LRP1 KO BV2 cells and observed significantly lower levels of total TREM2 compared to WT BV2 cells (Figure S2A and B). However, when LRP1 KO BV2 cells were treated with AV, sTREM2 levels were increased by 16.3% compared to DMSO (CNT) (Figure S2C). This increase was similar to that observed in WT BV2 cells (17.3% in Figure 3C). We also found that AV CM from WT BV2 cells did not increase Aβ42 uptake in LRP1 KO BV2 cells (Figure 4D). Collectively, these data suggest that LRP1 is a crucial receptor for augmented microglial uptake of Aβ42 following ACAT1 inhibition.
Next, we treated LRP1 KO BV2 cells with the same combinations of GW280264X, AV, and recombinant sTREM2 as the WT BV2 cells shown in Figure 4E. LRP1 KO BV2 cells continued to exhibit no change in Aβ42 uptake when treated with 10 µM AV for 24 h. Additionally, we observed no change in Aβ42 uptake in LRP1 KO BV2 cells following treatment with 40 nM recombinant sTREM2. Next, as observed in the WT BV2 cells, LRP1 KO BV2 cells treated with ADAM10/17 inhibitor, GW280264X, alone or combined with AV treatment, revealed no change in Aβ42 uptake. Finally, treatment with recombinant 40 nM sTREM2 led to no change in Aβ42 uptake in LRP1 KO cells treated with both GW280264X and AV, in contrast to the results from WT BV2 cells. Taken together, these data suggest that following ACAT1 inhibition, LRP1 most likely serves as a major receptor for microglial uptake of Aβ42, via internalization of a sTREM2‐Aβ complex.
To further validate the requirement of LRP1 in AV‐enhanced microglial Aβ uptake, we tested the effects of receptor associated protein (RAP), a well‐known LRP1 antagonist that binds LRP1 and reduces its ligand binding capacity. 29 , 34 In WT BV2 cells treated with 250 nM RAP 30 min prior to the addition of Aβ42, we observed a significant decrease in Aβ42 uptake (Figure S3). Figure 4F shows AV‐mediated enhancement of Aβ42 uptake was abrogated in the presence of RAP as compared to control‐treated cells. Additionally, when control WT BV2 cells were treated with WT AV CM together with RAP, AV‐enhanced Aβ42 uptake was abrogated compared to control WT BV2 cells (Figure 4F). Collectively, these findings show that LRP1 is necessary for AV‐induced enhancement of Aβ uptake in microglia and that the observed effects of decreased Aβ uptake in LRP1 KO BV2 cells are not due to decreased TREM2 levels.
Overall, our combined findings support a mechanism for ACAT1 inhibitor‐enhanced microglial uptake of Aβ, wherein altered cholesterol metabolism due to ACAT1 inhibition leads to elevated shedding of sTREM2, via increased ADAM10/ADAM17‐mediated cleavage of membrane TREM2. ACAT1 inhibition simultaneously increases levels of LRP1, which serves to phagocytose Aβ bound to sTREM2 (Figure 5).
FIGURE 5.

Model for how ACAT1 inhibition increases Aβ uptake in microglia via increased shedding of sTREM2 by α‐secretase and expression of LRP1. Diagram of proposed mechanism showing role of TREM2 in ACAT1 inhibition‐enhanced Aβ uptake in microglia. (1) ACAT1 inhibition prevents CE formation leading to decreased CE levels and an accumulation of free cholesterol. (2) TREM2 shedding is increased through α‐secretase (ADAM10/17). (3) Increased levels of sTREM2 in medium bind Aβ. (4) The sTREM2‐Aβ complex binds LRP1, whereupon the complex is internalized resulting in increased Aβ uptake. Aβ, amyloid beta; ACAT1, acyl‐coenzymeA: cholesterol acyltransferase 1; ADAM10/17; ADAM metallopeptidase domain 10/17 CE, cholesteryl ester; LRP1, low‐density lipoprotein receptor related protein 1; sTREM2, soluble triggering receptor expressed on myeloid cells 2.
4. DISCUSSION
ACAT1 inhibition reduces multiple aspects of AD pathology in vivo 12 and in vitro. 13 Here, we demonstrated that ACAT1 inhibition increased Aβ uptake in both human iMGL and mouse BV2 microglial cells. Furthermore, we showed that the absence of TREM2 in iMGLs significantly impaired augmented Aβ uptake following ACAT1 inhibition. TREM2 plays an essential role in maintaining microglial metabolic fitness during stress events 35 and is necessary for microglial cells to fully transition into the disease‐associated microglia (DAM) phenotype, which is sustained in the presence of Aβ‐induced pathology. Furthermore, TREM2 regulates cholesterol transport and metabolism through transcriptional regulation and endocytosis of cholesterol‐rich substances such as myelin and cell debris. 15 For these reasons, we and others have proposed that TREM2 plays a major role in sensing and employing cellular changes necessary to adapt to impaired cholesterol storage, thereby supporting a connection between TREM2 activity and ACAT1 inhibition. 15 , 36
We provide further support for the role of TREM2 in enhanced microglial Aβ uptake following ACAT1 inhibition by showing decreased full‐length TREM2 protein levels in AV treated microglial cells undergoing impaired cholesterol storage (Figure 3). Previous studies showed that cholesterol depletion enhanced the activity of ADAM10/17, leading to increased shedding of substrates such as the interleukin‐6 receptor (IL‐6). 37 Here, we observed that ACAT1 inhibition enhanced ADAM10/17‐mediated cleavage of TREM2, leading to increased shedding of sTREM2 into the media of AV treated microglial cells (Figure 3A). These findings suggest that inhibition of CE formation alters intracellular cholesterol homeostasis, resulting in increased ADAM10/17 activity. This finding led us to propose a novel mechanism for enhanced Aβ uptake following ACAT1 inhibition, wherein sTREM2 serves as a key mediator in this process. In support of this hypothesis, we showed that medium conditioned by WT BV2 microglial cells treated with an ACAT1 inhibitor was sufficient to increase Aβ uptake in WT BV2 cells, which had not been treated with an ACAT1 inhibitor (Figure 3E). Importantly, when we replaced the medium of ACAT1 inhibitor treated WT BV2 microglial cells with CM from control treated WT BV2 cells, Aβ uptake was no longer increased (Figure 3E). In further support of our hypothesis that sTREM2 was the major secreted factor enhancing Aβ uptake, we showed that ADAM10/17 inhibition abrogated ACAT1 inhibitor‐mediated enhancement of Aβ uptake (Figure 3G). Moreover, the effect of ADAM10/17 inhibition on ACAT1 inhibitor‐mediated Aβ uptake could be rescued by the simple addition of recombinant sTREM2 during Aβ incubation. Collectively, these data establish that the shedding of TREM2 is the major driver of enhanced microglial uptake of Aβ following inhibition of ACAT1.
While the role of sTREM2 in AD is complex and not fully understood, sTREM2 has been shown to prevent Aβ aggregation and promote phagocytosis. 20 , 38 , 39 However, the mechanism by which sTREM2 promotes Aβ uptake has remained unclear. Here, we showed that LRP1 was essential for enhanced Aβ uptake mediated by sTREM2 following ACAT1 inhibition. We showed this through multiple experiments demonstrating that (1) ACAT1 inhibition did not increase Aβ uptake in LRP1 KO BV2 cells (Figure 4C), (2) CM from WT BV2 cells treated with ACAT1 inhibitor did not increase Aβ uptake in LRP1 KO cells (Figure 4D), (3) the addition of sTREM2 was unable to increase Aβ in LRP1 KO cells (Figure 4E), and (4) WT BV2 cells treated with the potent LRP1 antagonist RAP no longer displayed enhanced Aβ uptake following ACAT1 inhibitor treatment or with CM from cells treated with an ACAT1 inhibitor (Figure 4F). Additionally, ACAT1 inhibition increased LRP1 protein levels (Figure 4B), which may be a response to altered intracellular lipid content, given that LRP1 regulates lipid homeostasis. 15 Collectively, these data strongly support LRP1 as a necessary and sufficient receptor for sTREM2‐dependent augmentation of Aβ uptake following ACAT1 inhibition in microglial cells. LRP1 binds many ligands and is known to function in a context‐dependent manner. 40 , 41 To our knowledge, the data presented are the first to reveal LRP1 as the receptor for the sTREM2‐Aβ complex.
This body of evidence robustly supports a novel and heretofore unknown mechanism for the manner in which ACAT1 inhibition leads to increased microglial phagocytosis of Aβ (Figure 5) as follows: (1) AV treatment inhibits ACAT1, thereby decreasing CE levels, (2) depletion of cholesterol enhances ADAM10/17 cleavage of membrane TREM2 to promote TREM2 shedding, and (3) elevated levels of sTREM2 in the medium promote Aβ uptake via LRP1‐mediated endocytosis. This novel mechanism suggests the possibility of employing ACAT1 inhibitors as TREM2‐modulating therapies for enhancing microglial clearance of Aβ in a potentially safer and more affordable manner than approved anti‐amyloid immunotherapies. In addition to plaque and tangle pathology, neuroinflammation and vascular pathology also play significant roles in the pathogenesis of AD. 42 ACAT1 inhibitors have been shown to decrease atherosclerotic plaques, 43 , 44 to improve vascular function, and to impact inflammatory responses. 9 , 45 These findings, together with our current data and the known ability of ACAT1 inhibitors to reduce Aβ plaque formation 12 and promote degradation of tau 14 , 46 and Aβ,13 would suggest that ACAT1 inhibitors carry great potential as multimodal, disease‐modifying therapeutics for the treatment and prevention of AD.
AUTHOR CONTRIBUTIONS
Moriah J. Hovde conceptualized the project and methodology and investigation, planned and performed experiments, analyzed data, and wrote the manuscript. Rudolph E. Tanzi conceptualized the project and methodology, planned and supervised the study, wrote the manuscript, and acquired funding. Anna Maaser‐Hecker conceptualized the methodology and edited the manuscript. Jun‐Seok Bae conceptualized the methodology and performed experiments.
CONSENT STATEMENT
Consent was not necessary as human subjects were not used in this study.
CONFLICT OF INTEREST STATEMENT
Rudolph E. Tanzi is listed as an inventor on patents to use ACAT inhibitors to treat AD. No other authors have anything to disclose. Author disclosures are available in the supporting information.
Supporting information
Supporting information
Supporting information
Supporting information
ACKNOWLEDGMENTS
We thank Dr. Doo Yeon Kim and Dr. Joseph Park for providing the iMGL TREM2 knockout cell line. We thank Donna Romano, Ana Griciuc, Dominika Pilat, Raja Bhattacharyya, Luisa Quinti, and other current and former members of the Genetics and Aging Research Unit at Massachusetts General Hospital. This research was supported by grants from the Freedom Together Fund (Rudolph E. Tanzi), Cure Alzheimer's Fund (Rudolph E. Tanzi), and National Institutes of Health (NIH) (T32 AG000222‐31 to Moriah J. Hovde). Research reported in this publication was supported by the National Institute on Aging of the NIH under award T32AG000222. The content is solely the responsibility of the authors and does not necessarily represent the official views of the NIH.
Hovde MJ, Maaser‐Hecker A, Bae JS, Tanzi RE. Inhibition of Acyl‐CoenzymeA: Cholesterol Acyltransferase 1 promotes shedding of soluble triggering receptor on myeloid cells 2 (TREM2) and low‐density lipoprotein receptor 1 (LRP1)‐dependent phagocytosis of amyloid beta protein in microglia. Alzheimer's Dement. 2025;21:e70879. 10.1002/alz.70879
DATA AVAILABILITY STATEMENT
Request for further information and resources should be directed to and will be fulfilled by the lead contact, Rudolph E. Tanzi (rtanzi@mgh.harvard.edu). Plasmids and cell lines generated in this study are available from the lead contact with a completed materials transfer agreement and may require payment. All data reported in this paper will be shared by the lead contact upon request.
REFERENCES
- 1. Tanzi RE, Bertram L. Twenty years of the Alzheimer's disease amyloid hypothesis: a genetic perspective. Cell. 2005;120:545–555. doi:10.1016/j.cell.2005.02.008 [DOI] [PubMed] [Google Scholar]
- 2. Selkoe DJ, Hardy J. The amyloid hypothesis of Alzheimer's disease at 25 years. EMBO Mol Med. 2016;8:595–608. doi:10.15252/emmm.201606210 [DOI] [PMC free article] [PubMed] [Google Scholar]
- 3. Stelzmann RA, Norman Schnitzlein H, Reed Murtagh F. An English translation of Alzheimer's 1907 paper, “über eine eigenartige erkankung der hirnrinde”. Clin Anat. 1995;8:429–431. doi:10.1002/ca.980080612 [DOI] [PubMed] [Google Scholar]
- 4. Chang TY, Li BL, Chang CCY, Urano Y. Acyl‐coenzyme A:cholesterol acyltransferases. Am J Physiol Endocrinol Metab. 2009;297:1–9. doi:10.1152/ajpendo.90926.2008 [DOI] [PMC free article] [PubMed] [Google Scholar]
- 5. Qian H, Zhao X, Yan R, et al. Structural basis for catalysis and substrate specificity of human ACAT1. Nature. 2020;581:333–338. doi:10.1038/s41586‐020‐2290‐0 [DOI] [PubMed] [Google Scholar]
- 6. Chang CCY, Chen J, Thomas MA, et al. Regulation and immunolocalization of acyl‐coenzyme A:cholesterol acyltransferase in mammalian cells as studied with specific antibodies. J Biol Chem. 1995;270:29532–29540. doi:10.1074/jbc.270.49.29532 [DOI] [PubMed] [Google Scholar]
- 7. Chan RB, Oliveira TG, Cortes EP, et al. Comparative lipidomic analysis of mouse and human brain with Alzheimer disease. J Biol Chem. 2012;287:2678–2688. doi:10.1074/jbc.M111.274142 [DOI] [PMC free article] [PubMed] [Google Scholar]
- 8. Tajima Y, Ishikawa M, Maekawa K, et al. Lipidomic analysis of brain tissues and plasma in a mouse model expressing mutated human amyloid precursor protein/tau for Alzheimer's disease. Lipids Health Dis. 2013;12:1–14. doi:10.1186/1476‐511X‐12‐68 [DOI] [PMC free article] [PubMed] [Google Scholar]
- 9. Li H, Huynh TN, Duong MT, Gow JG, Chang CCY, Chang TY. ACAT1/SOAT1 blockade suppresses LPS‐mediated neuroinflammation by modulating the fate of toll‐like receptor 4 in microglia. Int J Mol Sci. 2023;24(6):5616. doi:10.3390/ijms24065616 [DOI] [PMC free article] [PubMed] [Google Scholar]
- 10. Shibuya Y, Chang CCY, Chang T. ACAT1/SOAT1 as a therapeutic target for Alzheimer's disease. Future Med Chem. 2015;7:2451–2467. doi:10.2307/j.ctvnwc0d0.18 [DOI] [PMC free article] [PubMed] [Google Scholar]
- 11. Chang TY, Chang CCY, Harned TC, et al. Blocking cholesterol storage to treat Alzheimer's disease. Explor Neuroprotective Ther. 2021;1:173–184. doi:10.37349/ent.2021.00014 [DOI] [PMC free article] [PubMed] [Google Scholar]
- 12. Hutter‐Paier B, Huttunen HJ, Puglielli L, et al. The ACAT inhibitor CP‐113,818 markedly reduces amyloid pathology in a Mouse Model of Alzheimer's disease. Neuron. 2010;68:1014. doi:10.1016/j.neuron.2010.11.028 [DOI] [PubMed] [Google Scholar]
- 13. Shibuya Y, Chang CCY, Huang LH, Bryleva EY, Chang TY. Inhibiting ACAT1/SOAT1 in microglia stimulates autophagy‐mediated lysosomal proteolysis and increases Aβ1‐42 clearance. J Neurosci. 2014;34:14484–14501. doi:10.1523/JNEUROSCI.2567‐14.2014 [DOI] [PMC free article] [PubMed] [Google Scholar]
- 14. van der Kant R, Langness VF, Herrera CM, et al. Cholesterol metabolism is a druggable axis that independently regulates tau and amyloid‐β in iPSC‐derived Alzheimer's disease neurons. Cell Stem Cell. 2019;24:363–375. e9. doi:10.1016/j.stem.2018.12.013 [DOI] [PMC free article] [PubMed] [Google Scholar]
- 15. Nugent AA, Lin K, van Lengerich B, et al. TREM2 regulates microglial cholesterol metabolism upon chronic phagocytic challenge. Neuron. 2020;105:837–854. e9. doi:10.1016/j.neuron.2019.12.007 [DOI] [PubMed] [Google Scholar]
- 16. Zhao Y, Wu X, Li X, et al. TREM2 is a receptor for β‐amyloid that mediates microglial function. Neuron. 2018;97:1023–1031. doi:10.1016/j.neuron.2018.01.031 [DOI] [PMC free article] [PubMed] [Google Scholar]
- 17. Wang Y, Cella M, Mallinson K, et al. TREM2 lipid sensing sustains the microglial response in an Alzheimer's disease model. Cell. 2015;160:1061–1071. doi:10.1016/j.cell.2015.01.049 [DOI] [PMC free article] [PubMed] [Google Scholar]
- 18. Zhong L, Xu Y, Zhuo R, et al. Soluble TREM2 ameliorates pathological phenotypes by modulating microglial functions in an Alzheimer's disease model. Nat Commun. 2019;10:1–16. doi:10.1038/s41467‐019‐09118‐9 [DOI] [PMC free article] [PubMed] [Google Scholar]
- 19. La Rosa F, Agostini S, Piancone F, et al. TREM2 expression and amyloid‐beta phagocytosis in Alzheimer's disease. Int J Mol Sci. 2023;24(10):8626. doi:10.3390/ijms24108626 [DOI] [PMC free article] [PubMed] [Google Scholar]
- 20. Vilalta A, Zhou Y, Sevalle J, et al. Wild‐type sTREM2 blocks Aβ aggregation and neurotoxicity, but the Alzheimer's R47H mutant increases Aβ aggregation. J Biol Chem. 2021;296:1–13. doi:10.1016/j.jbc.2021.100631 [DOI] [PMC free article] [PubMed] [Google Scholar]
- 21. Liu CC, Hu J, Zhao N, Wang J, Wang N, Cirrito JR, et al. Astrocytic LRP1 mediates brain Aβ clearance and impacts amyloid deposition. J Neurosci. 2017;37:4023–4031. doi:10.1523/JNEUROSCI.3442‐16.2017 [DOI] [PMC free article] [PubMed] [Google Scholar]
- 22. Abud EM, Ramirez RN, Martinez ES, et al. iPSC‐derived human microglia‐like cells to study neurological diseases. Neuron. 2017;94:278–293. e9. doi:10.1016/j.neuron.2017.03.042 [DOI] [PMC free article] [PubMed] [Google Scholar]
- 23. McQuade A, Coburn M, Tu CH, Hasselmann J, Davtyan H, Blurton‐Jones M. Development and validation of a simplified method to generate human microglia from pluripotent stem cells. Mol Neurodegener. 2018;13:1–13. doi:10.1186/s13024‐018‐0297‐x [DOI] [PMC free article] [PubMed] [Google Scholar]
- 24. Llaverías G, Laguna JC, Alegret M. Pharmacology of the ACAT inhibitor avasimibe (CI‐1011). Cardiovasc Drug Rev. 2003;21:33–50. doi:10.1111/j.1527‐3466.2003.tb00104.x [PubMed] [Google Scholar]
- 25. Zhong L, Chen XF, Zhang Z, et al. DAP12 stabilizes the C‐terminal fragment of the triggering receptor expressed on myeloid cells‐2 (TREM2) and protects against LPS‐induced pro‐inflammatory response. J Biol Chem. 2015;290:15866–15877. doi:10.1074/jbc.M115.645986 [DOI] [PMC free article] [PubMed] [Google Scholar]
- 26. Colonna M. The biology of TREM receptors. Nat Rev Immunol. 2023;23(9):580–594. doi:10.1038/s41577‐023‐00837‐1 [DOI] [PMC free article] [PubMed] [Google Scholar]
- 27. Belsare KD, Wu H, Mondal D, et al. Soluble TREM2 inhibits secondary nucleation of Aβ fibrillization and enhances cellular uptake of fibrillar Aβ. Proc Natl Acad Sci U S A. 2022;119(5):e2114486119. doi:10.1073/pnas.2114486119 [DOI] [PMC free article] [PubMed] [Google Scholar]
- 28. Terrand J, Bruban V, Zhou L, et al. LRP1 controls intracellular cholesterol storage and fatty acid synthesis through modulation of wnt signaling. J Biol Chem. 2009;284:381–388. doi:10.1074/jbc.M806538200 [DOI] [PMC free article] [PubMed] [Google Scholar]
- 29. Kounnas MZ, Moir RD, et al. LDL receptor‐related protein, a multifunctional ApoE receptor, binds secreted β‐amyloid precursor protein and mediates its degradation. Cell. 1995;82:331–340. doi:10.1016/0092‐8674(95)90320‐8 [DOI] [PubMed] [Google Scholar]
- 30. Yang L, Liu CC, Zheng H, et al. LRP1 modulates the microglial immune response via regulation of JNK and NF‐ΚB signaling pathways. J Neuroinflammation. 2016;13:1–13. doi:10.1186/s12974‐016‐0772‐7 [DOI] [PMC free article] [PubMed] [Google Scholar]
- 31. Shi Y, Mantuano E, Inoue G, Campana WM, Gonias SL. Ligand binding to LRP1 transactivates Trk receptors by a Src Family Kinase‐dependent Pathway. Sci Signal. 2009;2:1–7. doi:10.1126/scisignal.2000188.Ligand [DOI] [PMC free article] [PubMed] [Google Scholar]
- 32. Shinohara M, Tachibana M, Kanekiyo T, Bu G. Role of LRP1 in the pathogenesis of Alzheimer's disease: evidence from clinical and preclinical studies. J Lipid Res. 2017;58:1267–1281. doi:10.1194/jlr.R075796 [DOI] [PMC free article] [PubMed] [Google Scholar]
- 33. Na H, Yang JB, Zhang Z, et al. Peripheral apolipoprotein E proteins and their binding to LRP1 antagonize Alzheimer's disease pathogenesis in the brain during peripheral chronic inflammation. Neurobiol Aging. 2023;127:54–69. doi:10.1016/j.neurobiolaging.2023.02.013 [DOI] [PMC free article] [PubMed] [Google Scholar]
- 34. Ulery PG, Beers J, Mikhailenko I, et al. Modulation of β‐amyloid precursor protein processing by the low density lipoprotein receptor‐related protein (LRP). J Biol Chem. 2000;275:7410–7415. Evidence that LRP contributes to the pathogenesis of Alzheimer's disease. doi:10.1074/jbc.275.10.7410 [DOI] [PubMed] [Google Scholar]
- 35. Zhou Y, Ulland TK, Colonna M. TREM2‐dependent effects on microglia in Alzheimer's disease. Front Aging Neurosci. 2018;10:1–7. doi:10.3389/fnagi.2018.00202 [DOI] [PMC free article] [PubMed] [Google Scholar]
- 36. Wei W, Zhang L, Xin W, et al. TREM2 regulates microglial lipid droplet formation and represses post‐ischemic brain injury. Biomed Pharmacother. 2024;170:1–19. doi:10.1016/j.biopha.2023.115962 [DOI] [PubMed] [Google Scholar]
- 37. Matthews V, Schuster B, Schütze S, et al. Cellular cholesterol depletion triggers shedding of the human interleukin‐6 receptor by ADAM10 and ADAM17 (TACE). J Biol Chem. 2003;278:38829–38839. doi:10.1074/jbc.M210584200 [DOI] [PubMed] [Google Scholar]
- 38. Brown GC, St George‐Hyslop P. Does soluble TREM2 protect against Alzheimer's disease? Front Aging Neurosci. 2022;13:1–7. doi:10.3389/fnagi.2021.834697 [DOI] [PMC free article] [PubMed] [Google Scholar]
- 39. Filipello F, Goldsbury C, You SF, Locca A, Karch CM, Piccio L. Soluble TREM2: innocent bystander or active player in neurological diseases? Neurobiol Dis. 2022;165:105630. doi:10.1016/j.nbd.2022.105630 [DOI] [PMC free article] [PubMed] [Google Scholar]
- 40. Lillis AP, Van Duyn LB, Murphy‐Ullrich JE, Strickland DK. LDL receptor‐related protein 1: unique tissue‐specific functions revealed by selective gene knockout studies. Physiol Rev. 2008;88:887–918. doi:10.1152/physrev.00033.2007 [DOI] [PMC free article] [PubMed] [Google Scholar]
- 41. Yamamoto K, Scilabra SD, Bonelli S, et al. Novel insights into the multifaceted and tissue‐specific roles of the endocytic receptor LRP1. J Biol Chem. 2024;300:107521. doi:10.1016/j.jbc.2024.107521 [DOI] [PMC free article] [PubMed] [Google Scholar]
- 42. Tini G, Scagliola R, Monacelli F, et al. Alzheimer's disease and cardiovascular disease: a particular association. Cardiol Res Pract. 2020;2020:2617970. doi:10.1155/2020/2617970 [DOI] [PMC free article] [PubMed] [Google Scholar]
- 43. Leon C, Hill JS, Wasan KM. Potential role of Acyl‐coenzyme A:cholesterol transferase (ACAT) inhibitors as hypolipidemic and antiatherosclerosis drugs. Pharm Res. 2005;22:1578–1588. doi:10.1007/s11095‐005‐6306‐0 [DOI] [PubMed] [Google Scholar]
- 44. López‐Farré AJ, Sacristán D, Zamorano‐León JJ, San‐Martín N, Macaya C. Inhibition of acyl‐CoA cholesterol acyltransferase by F12511 (eflucimibe): could it be a new antiatherosclerotic therapeutic? Cardiovasc Ther. 2008;26:65–74. doi:10.1111/j.1527‐3466.2007.00030.x [DOI] [PubMed] [Google Scholar]
- 45. Melton EM, Li H, Benson J, et al. Myeloid Acat1/Soat1 KO attenuates pro‐inflammatory responses in macrophages and protects against atherosclerosis in a model of advanced lesions. J Biol Chem. 2019;294:15836–15849. doi:10.1074/jbc.RA119.010564 [DOI] [PMC free article] [PubMed] [Google Scholar]
- 46. Shibuya Y, Niu Z, Bryieva EY, et al. Acyl‐CoA:cholesterol acyltransferase 1 blockage enhances autophagy in the neurons of triple transgenic Alzheimer's disease mouse and reduces human P301L‐tau content at the pre‐symptomatic stage. Neurobiol Aging. 2015;36:100–106. doi:10.1016/j.neurobiolaging.2015.04.002.Acyl‐CoA [DOI] [PMC free article] [PubMed] [Google Scholar]
Associated Data
This section collects any data citations, data availability statements, or supplementary materials included in this article.
Supplementary Materials
Supporting information
Supporting information
Supporting information
Data Availability Statement
Request for further information and resources should be directed to and will be fulfilled by the lead contact, Rudolph E. Tanzi (rtanzi@mgh.harvard.edu). Plasmids and cell lines generated in this study are available from the lead contact with a completed materials transfer agreement and may require payment. All data reported in this paper will be shared by the lead contact upon request.