

ABSTRACT
Coral reef fishes face unprecedented threats, as extensive habitat degradation compromises their ecological functions by modifying assemblage structure. It remains unknown how resistant reef fishes are to widespread losses in coral cover, and most studies tend to focus on adults, overlooking the important role of recruits. This study employed taxonomic and trait‐based approaches to investigate how live and dead branching corals influence reef fish assemblages across life stages. Over 1 year, we monitored recruitment and the migration of post‐recruits (juveniles and adults) on manually constructed 1 m2 patches of live and dead branching corals in a degraded reef. Recruit assemblages, composed mainly of two trophic groups, exhibited similar abundance and richness in the complex structures of dead and live coral patches, compared to flat control patches. Conversely, post‐recruit fishes were more abundant, species‐rich, and functionally diverse in live coral patches, encompassing several trophic groups and displaying a dominance shift between mobile and sedentary species. Our findings reveal that while dead coral structures can serve as temporary shelters for mobile recruits, live corals are essential for supporting long‐term biodiversity and diverse functional traits. This study underscores the complementary roles of both live and dead corals in promoting reef fish recovery and highlights the value of integrative strategies for reef ecosystem restoration.
Keywords: fish recruits, functionality, habitat loss, recovery, trophic ecology
We assessed the effects of experimental patches of live and dead corals on reef fish assemblages in different live stages. While dead and live corals provided equal shelter for mobile recruits, only live corals supported higher post‐recruit abundance, species richness, and functional diversity. These findings highlight the complementary roles of live and dead corals in fish recovery and stress the importance of integrative reef restoration strategies.

1. Introduction
In recent decades, fish assemblages along coral reefs have suffered extensively from habitat degradation triggered by anthropogenic activities (Bellwood et al. 2019; Garpe et al. 2006). This has led to a global decline in reef fish biodiversity (Munday 2004; Strona et al. 2021), biomass (Christensen et al. 2014), and the associated functions (Ainsworth and Mumby 2015; Bonin et al. 2011; Emslie et al. 2008; Jones et al. 2004; Morais and Bellwood 2020). Conversely, fishes are critical for reef dynamics, and changes in their assemblage structure may further precipitate coral reef decline (Brandl et al. 2020; Morais et al. 2022; Morais and Bellwood 2020; Mouillot et al. 2014), risking a negative loop.
Several key ecosystem processes in coral reef functioning involve fishes (Brandl et al. 2019; Mouillot et al. 2013). Herbivorous and planktivorous fishes play an important role in the transfer of energy from low to high trophic levels, boosting secondary productivity (Bellwood et al. 2018; Morais and Bellwood 2020; Tebbett et al. 2024). Furthermore, sedentary fishes exert a strong local influence by helping with nutrient recycling (Collins et al. 2024; Siqueira et al. 2021), while mobile species impact sediment distribution and nutrient transfer between habitats (Brandl et al. 2019; Tebbett et al. 2025). Additionally, healthy fish assemblages consist of diverse herbivorous fish populations that limit algal growth (Hughes 1994; Jessen and Wild 2013; Lewis and Wainwright 1985) and help maintain stable coral cover (Mumby 2006).
While several studies measured the effect of live colonies and the percentage of live coral cover on reef fishes (Bell and Galzin 1984; Chabanet et al. 1997; Sano et al. 1984), only a few studies have investigated the capacity of coral reef fish to use dead corals, mostly restricted to a single species or family (see Fakan et al. 2025; Streit et al. 2021; Tolimieri 1995; Wilson et al. 2006), with even fewer involving early life stages (e.g., Feary et al. 2007; Ohman 1990; Tolimieri 1995; Wismer et al. 2019). Due to the practical difficulties involved in studying small fishes in the field, many ecological surveys overlook recruits (e.g., Helder et al. 2022; Liu et al. 2025), thus failing to capture their ecological significance as the foundation for future assemblages (Halpern et al. 2005; Jones 1990; Sponaugle 2015). In many species, recruits inhabit distinct habitats (Félix‐Hackradt et al. 2014; Grol et al. 2014; Kimirei et al. 2013) and require different diets (Bellwood 1988; Chan et al. 2019) from adults, gradually adopting mature traits as they grow. The habitat use of recruits varies by taxa and environmental conditions, with some species depending on live corals (obligate live coral dwellers) (Bonin et al. 2009; Feary et al. 2007; Lecchini et al. 2013), while others prefer dead colonies or show no preference (facultative live coral dwellers) (Feary et al. 2007; Lirman 1994). Furthermore, ontogenetic development influences the degree of preference for specific habitats (Komyakova et al. 2019; Lecchini and Galzin 2005; Lirman 1994).
As degraded reef habitats become increasingly prevalent worldwide (see Bruno et al. 2019; Bruno and Selig 2007; De'ath et al. 2012), the capacity of dead corals to support a functionally diverse fish assemblage, compared to live corals, remains unclear. Furthermore, disturbances in coral reefs often lead to habitat fragmentation (Bonin et al. 2011), which accentuates the patchiness in these ecosystems (Bonin et al. 2011; McClanahan 2022), creating a mosaic of variable biomass and productivity rates within the same reef (Agudo‐Adriani et al. 2019; Syms and Jones 2000). Responses to coral mortality and habitat fragmentation depend on a combination of species traits, spatial distribution in reef fish assemblages, and recruitment pulses (Syms and Jones 2000). While some young, site‐attached damselfishes appear relatively resilient to disturbances and coral mortality (see Wismer et al. 2019), the role of dead corals in maintaining functional fish assemblages in patchy reef habitats remains overlooked.
To address these knowledge gaps, we evaluate how live and dead corals impact reef fish assemblages on successive life stages and how habitat variations influence functional traits. We hypothesize that recruit and post‐recruit (juveniles and adults) assemblages will exhibit different richness, abundance, and foraging traits in live and dead coral patches. To test this, we conducted a year‐long field experiment using patches of live and dead branching corals, comparing their associated reef fish assemblages to those observed along flatter degraded reef substrata.
2. Methods
2.1. Study Site
This study was conducted at Xiaoliuqiu Island in southern Taiwan, 22°20′24″N120°22′12″E. This 6.8 km2 island was once home to diverse reefs with high coral and fish richness (Yang et al. 2017). However, intensive anthropogenic activities such as overfishing and coastal development have dramatically reduced biodiversity (Dai et al. 2009), causing severe declines in live coral cover (Lin et al. 2024; Yang et al. 2017). Despite a Marine Protected Area (MPA) established in 2000, with further zoning in 2014 prohibiting fishing activities, coral cover remains in decline, with no sign of recovery for both corals and the associated reef fish assemblage. To the west of the Island (Shanfu Harbor, Figure 1d), shallow‐water reefs extend approximately 500 m along the island's coastline and still host relatively high coral cover compared to other areas around the island (Lin et al. 2024; Mattos et al. 2025). This site has a shallow slope (1–10 m) dominated by turf algae (less than 5% coral cover) on a relatively flat, hard substrate (“turf zone”), while a deeper area (10–17 m) still maintains moderate coral cover (~30%) and a complex structure (“coral zone”). This allowed for a manipulation experiment to test the effect of patches of live and dead corals on shallow reef fish assemblages.
FIGURE 1.

The present study employed four replicate blocks, each including three patches: a live coral treatment (a), a dead coral treatment (b), and a control (c), located near Shanfu harbor in Xiaoliuqiu (d). The 1 m2 patches were placed approximately 5 m from each other (e). The replicate blocks were placed approximately 10 m apart from each other.
2.2. Data Collection
2.2.1. Experiment Setting and Monitoring
Between February 2022 and May 2023, we conducted a field experiment in the turf zone using live and structurally intact dead coral colonies from two different branching species: Pocillopora eydouxi and Pocillopora verrucosa . All colonies were collected from the surrounding reef and transplanted to the experimental area. Colonies of P. eydouxi (~40–60 cm tall and ~40–70 cm wide) and P. verrucosa (~30–40 cm tall and ~40–60 cm wide) were carefully removed from their bases using a crowbar. To ensure that live and dead coral patches held comparable structural complexities, we brushed the macroalgae off the dead corals with steel wire brushes, exposing branches and simulating recently dead corals. The original resident fish and invertebrates were also carefully moved to a new substrate before transplantation. Each coral was then secured to the substrate with a 10 cm bolt and underwater epoxy. Four experimental blocks (i.e., four replicates) were constructed in the turf zone, each containing two experimental treatments (a live coral patch and a dead coral patch) and a flat reef area (control patch) (Figure 1a–c).
Treatment patches consisted of four colonies from each coral species, resulting in eight colonies per patch in a total area of approximately 1 m2. The patches were spaced ~5 m apart, forming a triangular shape in each replicate block (Figure 1e). The control patch was defined as a 1 m2 circle on the flat substrate, and a peg was used to mark its center. Experimental blocks were positioned approximately 10 m apart, parallel to the coastline, at a depth of ~5 m. After set‐up, the live and dead coral patches held a cluster of Pocillopora spp. colonies up to 5 cm apart and displayed higher vertical rugosity and more holes than the surrounding flat substrate (see Figure 1a–c). Control patches were dominated by the turf matrix but also displayed sparse holes and occasional small colonies. To compare patch habitat conditions over time, we measured live coral cover and height range, counted the number of refuge categories, and visually estimated rugosity, assigning ranks from 1 to 5, with 1 indicating the lowest and 5 the highest values. This ranking system captured temporal changes in patch structure, such as colony breakage and algal overgrowth. Detailed definitions of the rank scores are provided in Table A1.
The patches (treatment and control) were monitored monthly for fish composition for the first 6 months starting from February 2022, expecting recruitment pulses and a stabilization of assemblage dynamics within that time. Monitoring in June 2022 was canceled due to adverse weather conditions. From August 2022 onward, patches were monitored quarterly until May 2023 using an Underwater Visual Census (UVC) method adapted from Bohnsack and Bannerot (1986). In this approach, a diver swam around and above each patch for a maximum of 2 min, identifying and counting fish species foraging or sheltering in the patches. A trained researcher with over 10 years of experience in UVC and size estimation recorded the size of the recruits using a ruler for reference. For logistical reasons, a local collaborator conducted the field monitoring in April and July 2022 by recording 2 min Diver‐Operated Videos (DOV) with a ruler as a scale bar to emulate the UVC method. This method has been extensively used and produces abundance counts similar to those of the UVC method (Wilson et al. 2018). To test for differences between methods, we used Dunn's tests with Holm's correction for repeated measures.
Recruits, defined as recently settled individuals that have already transitioned to a demersal lifestyle (Jenkins et al. 2009; Keough and Downes 1982), were identified based on behavior, coloration, and the species‐specific settlement size. Individuals were classified as recruits if their length was up to 2 cm larger than the species' settlement size. This relative threshold was used to exclude older juveniles that had grown substantially post‐settlement. All larger juveniles—i.e., over 2 cm above the species' settlement size—and adults were grouped into one category called “post‐recruits,” as our goal was to focus on the different responses between naive recruits and more experienced fish. Such differences are often linked to ontogenetic changes in diet and mobility (Bellwood 1988; Chan et al. 2019; Chen 2002; Félix‐Hackradt 2013; Giffin et al. 2019), as well as size thresholds in mortality rates (Frederick 1997; Goatley and Bellwood 2016; Kimirei et al. 2013; Lewis 1997; Mccormick and Makey 1997). Thus, we opted to use these ecological differences linked to habitat use to group fish assemblages into either recruits or post‐recruits. Settlement size data were retrieved from the literature (Brothers et al. 1983; Leis 1984; Bellwood and Choat 1989; Wellington and Victor 1989; Thorrold 1993; Chen 2002; Sadovy et al. 2003; Juncker et al. 2006; Leis et al. 2011; Leu et al. 2012, 2022; Baensch 2016, 2025; Grutter et al. 2017) to the nearest taxonomic level (See Table A2). This approach was considered conservative due to the rapid growth rates of recruits (Booth and Hixon 1999; Leahy et al. 2015; Lou 1993). To compare temporal dynamics observed in the experimental patches and control zones to seasonal trends in the local ichthyofauna, we conducted quarterly surveys of fish assemblages in both the turf and the coral zones throughout the study. In each zone, three transect lines were randomly deployed 5–10 m apart, and fish were surveyed using a belt‐transect UVC method (30 m × 2 m) to count and identify the recruits and post‐recruits. All field procedures were approved by the Pingtung County Government (Permit No. 11130157900, issued on January 24, 2022).
2.2.2. Species Traits
For our functional analyses, we selected two key traits: mobility and trophic group. These traits reflect the species' feeding habits and their foraging grounds. For example, ambush carnivores tend to be sedentary, while roving herbivores constantly swim around to forage (Agudo‐Adriani et al. 2019; Ferreira et al. 2015; Suzuki et al. 2018). Mobility mostly determines the species level of association with the substrate and their ability to move between habitats such as dead and live coral patches, therefore influencing habitat selection and use. Sedentary species usually have strong site fidelity and small home ranges (< 5 m), living in close association with the substrate, often with benthic organisms such as macroalgae, seagrass, sponges, or live corals (Waldner and Robertson 1980; Wilson et al. 2008). Mobile species have a wider home range (up to 100 m), exploring a greater number of habitats without being restricted to a particular substrate type (Chapman and Kramer 2000; Ferreira et al. 2015; Francini‐Filho et al. 2010; Tebbett et al. 2025). Mobility categories were based on the definitions from Donati et al. (2019), which simply categorized species into high and low mobility. Low mobility includes sedentary and territorial species, which may exhibit significant vertical movement but have limited horizontal mobility. High mobility includes species with home ranges spanning tens of meters.
Trophic group traits were based on the definitions of Ferreira et al. (2004), with the addition of “cleaners” (for species whose diets are primarily from cleaning other organisms) and “corallivores” (for obligate coral feeders). Cleaners occupy a specialized niche, interacting with different fish species, often choosing coral heads as cleaning stations to maximize their access to clients (Grutter and Poulin 1998). Corallivores differ from other sessile invertebrate feeders as they are generally associated with live corals, avoiding dead corals covered by algae (Brooker et al. 2016; Graham et al. 2009; Pratchett et al. 2006). In contrast, other sessile invertebrate feeders are often less specialized and feed on items available in a wider range of substrate types (Ferreira et al. 2004). Trophic trait data were obtained from FishBase (Froese and Pauly 2025; last accessed September 2025) and other published fish guides (Allen et al. 2015; Lieske and Myers 2001).
Trophic and mobility data were curated, and in cases where source information differed, we cross‐referenced publications on the feeding biology of the species to ensure the accuracy of the data. Trophic and mobility traits were assigned at the species level and were not life‐stage specific, as our goal was to examine potential trait‐based selection when comparing the effects of live and dead colonies on recruit and post‐recruit assemblages. This approach is correlative to recruitment ecology, as the combination of mobility and trophic traits could influence habitat selection and use by recruits and post‐recruits (see Booth and Wellington 1998; Brandl et al. 2015; Farmer and Ault 2011; Félix‐Hackradt et al. 2014; Giffin et al. 2019; Komyakova et al. 2019). For a complete list of species with their respective trophic and mobility traits, refer to Table A2.
2.3. Data Analysis
Differences between live, dead, and control patches were visualized in a PCA based on the rank score from habitat structure variables (Figure A1). To evaluate differences in the total abundance and species richness of recruits and post‐recruits among patches, we fitted generalized linear mixed models (GLMMs) with a negative binomial error distribution (log link). Patch (control, dead, live) was included as a fixed factor and sampling date as a random intercept to account for repeated measures. Model assumptions were evaluated using simulation‐based residual diagnostics. Pairwise comparisons among patches were performed using Tukey‐adjusted estimated marginal means. We then plotted smoothed conditional means for the abundance and richness of the whole assemblage. We treated each patch monitored in a field survey as a sample unit—i.e., 12 sample units per survey.
To compare differences in fish assemblages across patches, we first excluded all samples in which no fish were observed. We applied Hellinger transformation to normalize the data and then computed two Bray–Curtis dissimilarity matrices, one for recruits and one for post‐recruits. Then, two non‐metric multidimensional scaling (nMDS) ordinations were produced to visualize the multivariate dispersion of recruit and post‐recruit assemblages across treatments and controls. For the nMDS, we removed one sample out of 57 from recruit assemblages and three samples out of 83 from the post‐recruit assemblages as these were outliers from the control patcharea, with unusually high dissimilarity values that otherwise distorted the ordination (Figure A2).
To test for multivariate differences in fish assemblage structure between patches, we further performed a stratified permutational analysis of variance (PERMANOVA) with 999 permutations based on the same similarity matrix. We stratified the permutations in the PERMANOVA by month to account for repeated measures, allowing permutations within months but not between months. The experimental patches were used as the explanatory variables. Significant differences between patches were subsequently examined using pairwise comparisons. We could only run PERMANOVA for two out of five trophic groups in recruits and five out of nine groups in post‐recruits, due to low abundances.
To examine patches' effects on the mobility and trophic traits of associated fish assemblages, we modeled recruit and post‐recruit abundances by fitting GLMMs with post hoc pairwise comparisons following the same steps described above. We used patch and functional traits as fixed factors with interactions, and date as a random factor. Later we visualized the results with bar plots to display fish abundance per trophic group and mobility in all sampling months.
All data analyses were conducted using R software version 4.3.3 (R Core Team 2024). Dunn's test was performed using the FSA package version 0.9.6 (Ogle et al. 2025). The package ape version 5.8–1 (Paradis and Schliep 2019) was used to run the PCA. The glmmTMB package version 1.1.12 (McGillycuddy et al. 2025) was utilized to fit the GLMMs, and the emmeans package version 1.11.2–8 (Lenth 2023) for the pairwise comparisons. Simulation‐based residual diagnostics were obtained using the DHARMa package version 0.4.7 (Hartig 2024). We employed vegan version 2.6–2 (Oksanen et al. 2024) for data transformation, nMDS and PERMANOVA analyses, and used ‘pairwiseAdonis2’ for the pairwise PERMANOVAs (Martinez Arbizu 2020).
3. Results
The PCA revealed that both live and dead coral patches were primarily associated with greater height and rugosity, whereas control patches were positioned in the opposite direction along both ordination axes. Differences between live and dead coral patches were mainly driven by the number of refuge categories (Figure A1). No significant differences were found between the abundance and richness of fishes recorded by UVC or DOV methods (Figure A3; Tables A3 and A4). Additionally, the simulation‐based residual diagnostics indicated acceptable model fit in most of our GLMMs (no substantial deviations in dispersion or residual patterns) (see Figures A4, A5, A6).
3.1. Effects of Patches Across Life Stages
Recruit and post‐recruit assemblages varied seasonally (Figure 2) following local dynamics (Figure A7). Recruits were significantly more abundant and species‐rich on live and dead patches compared to control patches (abundance: z = 5.56 and 6.01, p < 0.001; richness: z = 5.89 and 6.10, p < 0.001), whereas live and dead patches did not differ significantly from each other (Tables A5 and A6). The nMDS showed substantial overlap between recruit assemblage composition in live and dead coral patches (Figure 3), while the PERMANOVA indicated marginal differences between these assemblages (R 2 = 0.04, p < 0.05; Tables A7 and A8). In general, recruitment densities per m2 were higher in the experimental treatments than in the adjacent turf and coral zones (see Figure A7).
FIGURE 2.

Abundance and species richness of recruit and post‐recruit reef fish assemblages in live coral, dead coral, and control patches over the one‐year experimental period. Points represent individual samples, and the lines and shaded areas represent the smoothed conditional means with 95% confidence intervals. Ticks at the x‐axis are scaled by date.
FIGURE 3.

nMDS results displaying the similarity of recruit and post‐recruit reef fish assemblages in live coral, dead coral, and control patches, based on Bray‐Curtis distance matrices from Hellinger transformed data. Ellipses represent a 95% confidence interval. Due to high collinearity between recruits' data points in the control patches, the ellipse could not be calculated.
Post‐recruits also showed markedly higher abundance and richness on live and dead patches compared to control patches (abundance: z = 7.38 and 10.75, p < 0.001; richness: z = 8.86 and 12.21, p < 0.001), and were significantly more abundant and species‐rich on live than dead patches (abundance: z = −4.24, p = 0.001; richness: z = −4.94, p < 0.001). Results from PERMANOVA (R 2 = 0.16, p < 0.01; Tables A7 and A8) indicated significant differences in assemblage structure among live, dead, and control patches. Live coral patches differed from dead and control patches to a greater extent (PERMANOVA, R 2 = 0.14 and 0.17, respectively, p = 0.001), whereas weaker differences were observed between dead and control patches (R 2 = 0.05, p = 0.001) (Figure 3 and Table A8).
3.2. Influence of Patches on Species Traits
Throughout the experimental period, live and dead coral patches supported similar abundances of both high‐ and low‐mobility recruit species (Figure 4; Tables A9 and A10). Trophic groups also showed comparable abundances between the two treatments, with no significant differences detected for motile invertebrate feeders or planktivores (Figure 5; Tables A11 and A12). However, distinct patterns emerged in other groups: live coral patches supported significantly more carnivores (z = −2.62, p = 0.02), while dead coral patches harbored higher numbers of roving herbivores (z = 2.81, p = 0.01; Tables A11 and A12).
FIGURE 4.

Mean abundance of recruits per month according to different mobility traits. Error bars indicate the standard deviation.
FIGURE 5.

Mean abundance of recruits and post‐recruits per month according to different trophic groups. Error bars indicate the standard deviation. CAR, carnivore; CLN, cleaner; COR, corallivore; MIF, motile invertebrate feeder; OMN, omnivore; PLK, planktivore; RH, roving herbivore.
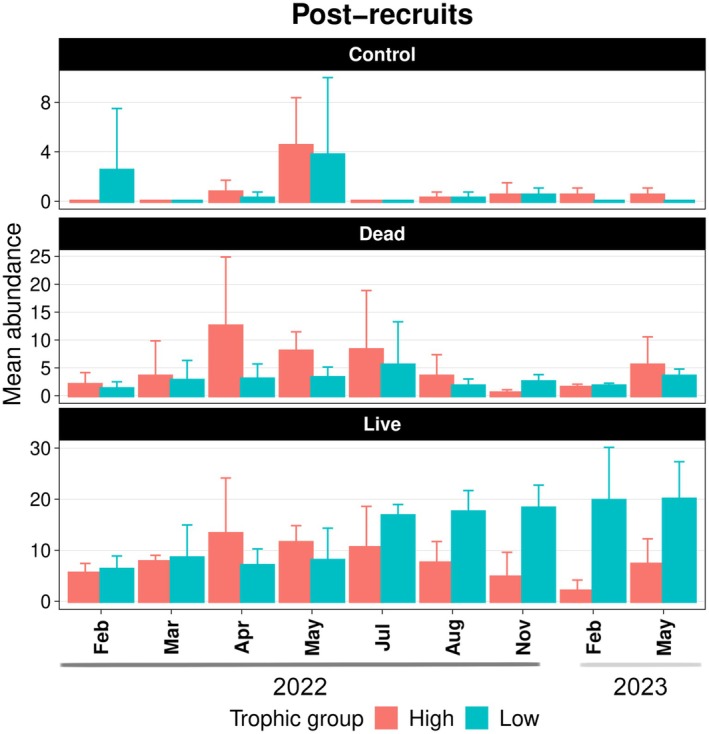
For post‐recruits, live and dead coral patches exhibited similar seasonal patterns in the abundance of high‐mobility species, both following trends of motile invertebrate feeders. In contrast, low‐mobility species in both patches followed the seasonal dynamics of planktivores, with live patches consistently supporting higher abundances (z = −7.11, p < 0.001) (Figures 6 and 7; Tables A9 and A10). Although high‐mobility species showed no significant difference between live and dead patches, planktivores were significantly more abundant in live patches (z = −6.48, p < 0.001). Over time, live patches transitioned from being dominated by mobile species—especially motile invertebrate feeders—to assemblages increasingly composed of low‐mobility planktivores. Additionally, live patches had significantly higher abundances of carnivores (z = −6.29, p < 0.001) and omnivores (z = −3.33, p < 0.001) compared to dead patches (see Tables A13 and A14).
FIGURE 6.
Mean abundance of post‐recruits per month according to different mobility traits. Error bars indicate the standard deviation.
FIGURE 7.

Mean abundance of post‐recruits per month according to different trophic groups. Error bars indicate the standard deviation. CAR, carnivore; CLN, cleaner; COR, corallivore; MIF, motile invertebrate feeder; OMN, omnivore; PLK, planktivore; RH, roving herbivore; SIF, sessile invertebrate feeder; TH, territorial herbivore.
4. Discussion
Recruit assemblages showed similarities between live and dead coral patches, both showing greater abundance and richness than the control patches. The assemblages in live and dead patches were dominated by only two trophic groups and exhibited similar species composition between patches, underscoring the potential of dead corals as temporary shelters in degraded habitats. On the other hand, post‐recruits displayed stronger habitat‐specific responses. Live coral patches supported higher abundance, species richness, and more trophic groups, indicating that mature individuals might benefit from the structural stability and increased resources provided by live corals.
Spatial distribution patterns of recruits are strongly influenced by the availability of shelter, primarily due to predation risk (Almany 2004b; Steele 1999). The low structural complexity characteristic of our control patches offers little protection, leading to lower recruit abundance and richness (Booth and Beretta 1994; Félix‐Hackradt 2013) while both live and dead coral patches support similar recruit assemblages. Conversely, post‐recruit abundances showed marked differences between live and dead habitats. These differences suggest that shelter holds a higher influence on recruit habitat choice in our coral patches than post‐recruit density, a pattern consistent with previous observations (Almany 2004a). The relatively high complexity and structural protection possibly reduced young fish mortality (Almany 2004b; Cabaitan et al. 2008; Cheminée et al. 2016), contributing to increased fish biomass (Beese et al. 2023). This highlights the potential role of live and dead coral patches in the recovery of reef fish assemblages.
The similarity between recruit assemblages in live and dead coral patches was partially driven by highly mobile species of invertebrate feeders. These fishes typically utilize several reef habitats for foraging and shelter (Lecchini and Galzin 2005), including both live and dead corals (Almany 2004a; Ferreira et al. 2015; Giffin et al. 2019; Johansson et al. 2012). While live corals support abundant associated fauna (Patton 1994), dead corals also retain ecological importance, sustaining diverse assemblages of small invertebrates even after coral death (Head et al. 2015). This makes both habitats viable foraging grounds for motile invertebrate feeders (Bellwood 1988; Chen 2002; Choat 1991; Kimirei et al. 2013; Lecchini and Galzin 2005). Thus, for highly mobile species, dead corals could represent an important alternative to live corals (Giffin et al. 2019; Suzuki et al. 2018).
The added habitat complexity created by dead and live corals helps reduce competition, predation risks, and the impact of environmental stressors (Almany 2004b). Migrants from the surrounding area are often attracted to the benefits of complex habitats, leading to an aggregation effect (see Acosta and Robertson 2002; Schroeder 1987), leading to a higher fish density in treatment patches compared to the turf and coral zones, which feature a patchy distribution of complex and flat areas. Over time, this aggregation effect was more pronounced in live coral patches, which constantly supported greater abundance, species richness, and number of trophic groups. This likely reflects the greater structural stability and persistence in live coral patches, which maintain longer‐lasting habitat complexity, while dead coral colonies gradually erode with time (Cheung et al. 2021; Darling et al. 2017).
Beyond structural benefits, live corals provide energetic and ecological resources, attracting both directly and indirectly associated species (Coker et al. 2013; Komyakova 2018; Quimbayo et al. 2019; Yap et al. 1994). This includes mobile species with large home ranges, like the motile invertebrate feeders Stethojulis trilineata and Thalassoma quinquevitatum, which initially dominated live coral patches due to their mobile capacity and attraction toward coral‐associated invertebrates (Chapman and Kramer 2000; Ferreira et al. 2015; Suzuki et al. 2018). Over time, however, live coral patches became increasingly dominated by planktivores such as Dascyllus reticulatus , which usually form large shoals (Floeter et al. 2006; Holbrook et al. 2000; Russ et al. 2020). These sedentary groups benefit from structural stability and are often found in association with live corals (Booth and Beretta 2002; Cabaitan et al. 2008; Coker et al. 2012; Komyakova et al. 2013). Those patches consequently attracted carnivores and omnivores that forage on the associated fauna and surrounding substrate (Kramer et al. 2015; Osuka et al. 2022; Stier and Leray 2014). Hence, while relatively few reef fish species are strongly associated with corals (Siqueira et al. 2023), live corals attract a diverse array of species with varied traits, supporting a larger number of trophic groups than dead corals or turf substrates (see Coker et al. 2013; Mouillot et al. 2014; Munday 2004; Pratchett et al. 2011; Wilson et al. 2008).
The similar spatial and temporal trends observed in recruits and post‐recruits of highly mobile species suggest limited ontogenetic habitat shifts, contrasting with previous findings (Giffin et al. 2019). Conversely, sedentary‐planktivorous species exhibited shifts toward more specialized habitat use in post‐recruit stages. Ontogenetic transitions often reflect changes from generalist recruits to specialized pre‐adults and adults (Feary et al. 2007; Lirman 1994). The varying patterns in ontogenetic shifts across trophic groups found here and the discrepancy with other studies highlight an important gap in our understanding of life‐stage‐specific habitat use. Particularly, more research is needed on the functional traits of early life stages, as most trait‐based studies still focus primarily on adults.
While our study was limited to 1 m2 patches composed of two Pocillopora spp. in a degraded reef zone, the findings provide valuable insights into habitat function across fish life stages. Despite spatial and compositional constraints, our design offers a controlled foundation for future research into habitat‐specific recruitment at broader scales. For instance, fast‐growing branching corals, such as Pocillopora sp., are linked to rapid coral cover recovery in the Indo‐Pacific (Gilmour et al. 2013; Mulla et al. 2024). As shown here, even small patches of these corals support diverse fish assemblages spanning multiple trophic groups. Future studies should further explore how coral diversity, species identity, and patch size interact to shape recruit and post‐recruit assemblages under varying reef conditions.
5. Conclusions
Our findings indicate that dead branching coral patches are not “graveyards”; rather, their retained complexity may serve as transitional shelters, helping to buffer the negative impacts of coral mortality on fish assemblages (Emslie et al. 2014; Morais et al. 2022). However, live corals remain irreplaceable for supporting functionally diverse assemblages across multiple trophic levels, a crucial component of ecosystem health (Graham et al. 2011; MacNeil et al. 2015). The patchy habitat configurations used here—often employed in restoration projects—could be important attractors for recruits and post‐recruits, supporting diverse functional traits, which ensures a link between bottom‐up and top‐down processes (Beese et al. 2023). Future studies at larger spatial and temporal scales could build on these findings to clarify how fish from different life stages and functional groups respond to live, dead, and even coral rubble habitats, a commonly overlooked substrate. Integrating habitat‐specific strategies—safeguarding live corals for their high productivity and functional importance, while also protecting dead corals from further fragmentation—could meaningfully enhance the resilience of coral reef fish assemblages in degraded ecosystems.
Author Contributions
Felipe M. G. Mattos: conceptualization (equal), data curation (lead), formal analysis (lead), investigation (lead), methodology (equal), visualization (lead), writing – original draft (lead), writing – review and editing (lead). Aziz J. Mulla: investigation (supporting), writing – original draft (equal), writing – review and editing (equal). Vianney Denis: formal analysis (supporting), writing – original draft (equal), writing – review and editing (equal). Che‐Hung Lin: investigation (supporting), methodology (supporting), writing – review and editing (supporting). Tzu‐Hao Lin: formal analysis (supporting), supervision (equal), visualization (supporting), writing – original draft (equal), writing – review and editing (equal). Yoko Nozawa: conceptualization (equal), formal analysis (supporting), funding acquisition (lead), investigation (supporting), methodology (equal), project administration (lead), resources (lead), supervision (equal), visualization (supporting), writing – original draft (equal), writing – review and editing (equal).
Conflicts of Interest
The authors declare no conflicts of interest.
Acknowledgments
We thank Chieh‐Hsuan Lee, Chialing Fong, Yuen‐Yi Leung and Ju‐Hsiung Wu for their help in setting up the experiment and data collection; our friend and collaborator Mr. Ho‐Cheng Chen, a local diver and citizen scientist who, besides helping with data collection, also provided crucial logistic help in the Island of Xiao Liuqiu. This research was conducted under permit 111301579000 issued by the Pingtung County Government.
Appendix A.
FIGURE A1.

Biplot from the Principal Component Analysis of the physical structure in live, dead, and control patches. Height, average height of habitat architecture in cm; LCC, Live coral cover; RC, number of refuge categories; Rug, visual rank of the rugosity. See Table A1 for definitions.
FIGURE A2.

nMDS results displaying the original Bray–Curtis similarity from raw abundance‐count data for recruit and post‐recruit reef fish assemblages in the live dead, and control patches. This figure shows the over‐dispersion caused by one sample in recruit and three samples in post‐recruit assemblages. Ellipses indicate the 95% confidence interval. Stress < 0.001.
FIGURE A3.

nMDS results comparing the results from DOV vs. UVC methods in the live coral dead coral, and control patches control area based on Bray‐Curtis distance matrices from the count data. Ellipses indicate a 95% confidence interval.
FIGURE A4.

Residual diagnostics for GLMMs for the comparison of fish assemblages between patches. Residual diagnostics of (a) recruit abundance, (b) recruit richness, (c) post‐recruit abundance and (d) post‐recruit richness. Overdispersion was detected in post‐recruit richness. Significant heterogeneity of variances was detected in post‐recruit abundance and richness. Each dot represents a sampling unit from a single patch.
FIGURE A5.

Residual diagnostics for GLMMs for the comparison of fish assemblages between patches according to high and low mobility traits. Residual diagnostics of (a) recruit assemblages, and (b) post‐recruit assemblages. Residuals followed a normal distribution with no overdispersion and outliers. Significant heterogeneity of variances was detected in post‐recruit assemblages. Each dot represents a sampling unit from a single patch.
FIGURE A6.

Residual diagnostics for GLMMs for the comparison of fish assemblages between patches according to trophic group. Trophic groups: (CAR, carnivore; CLN, cleaner; COR, corallivore; MIF, motile invertebrate feeder; OMN, omnivore; PLK, planktivore; RH, roving herbivore; SIF, sessile invertebrate feeder; TH, territorial herbivore). Residual diagnostics of (a) recruit assemblages, and (b) post‐recruit assemblages. Residuals followed a normal distribution with no overdispersion and outliers. No significant heterogeneity of variances was detected. Each dot represents a sampling unit from a single patch.
FIGURE A7.

Abundance and richness of recruits and post‐recruits per transect in the turf and the coral zones of Shanfu reef. Points represent individual samples, lines and the shaded areas represent the smoothed conditional means with the respective 95% confidence intervals.
TABLE A1.
Definitions and explanations of the factors and ranks used to measure the physical structure of the patches.
| Rank 1 | Rank 2 | Rank 3 | Rank 4 | Rank 5 | |
|---|---|---|---|---|---|
| Rugosity (visual topographic estimate of the substratum in each patch) | Mostly flat (e.g., sandy matrix) | Flat with bumps but no holes | Shallow holes and peaks | Mostly vertical but shallow holes, gaps and short peaks | Vertical and horizontal holes, gaps, peaks and a maze‐like structure |
| Height (average height of habitat architecture in cm) | 0–9 | 10–19 | 20–39 | 40–79 | > 80 |
| Refuge size categories (i.e., how many different sizes the available refuges have). Categories: 1–5, 6–15, 16–30, 31–50 and > 50 cm. | 0–1 | 2 | 3 | 4 | 5 |
| Live coral cover (%) | 0–19 | 20–39 | 40–59 | 60–79 | 80–100 |
TABLE A2.
List of reef fish species recorded in experimental patches (Control, Dead coral, and Live coral). For each species we indicate whether it was observed as a recruit (Rec), post‐recruit (PR), or both in each patch. Trophic groups: (CAR, carnivore; CLN, cleaner; COR, corallivore; MIF, motile invertebrate feeder; OMN, omnivore; PLK, planktivore; RH, roving herbivore; SIF, sessile invertebrate feeder; TH, territorial herbivore). Mobility (High or Low). Mean settlement size is reported in millimeters (mm) only for species seen as recruits. Sources of the settlement sizes were cited in subsection 2.2.1 and can be obtained in the supporting dataset.
| Species | Control | Dead | Live | Trophic group | Mobility | Settlement size (mm) |
|---|---|---|---|---|---|---|
| Acanthurus japonicus | PR | RH | High | — | ||
| Acanthurus leucocheilus | PR | RH | High | — | ||
| Anampses caeruleopunctatus | PR | MIF | High | — | ||
| Anampses geographicus | PR | Rec PR | PR | MIF | High | 9 |
| Anampses melanurus | Rec | Rec | MIF | High | 9 | |
| Anampses twistii | PR | MIF | High | — | ||
| Calotomus carolinus | Rec PR | PR | RH | High | 12 | |
| Canthigaster valentini | PR | PR | SIF | Low | — | |
| Centropyge vrolikii | PR | PR | TH | Low | — | |
| Cephalopholis urodeta | PR | PR | CAR | Low | — | |
| Chaetodon argentatus | PR | OMN | High | — | ||
| Chaetodon citrinellus | PR | OMN | High | — | ||
| Chaetodon kleinii | PR | OMN | High | — | ||
| Chaetodon lunulatus | PR | COR | High | — | ||
| Chaetodon rafflesi | PR | PR | SIF | High | — | |
| Chaetodon trifascialis | PR | PR | COR | High | — | |
| Cheilinus oxycephalus | PR | CAR | Low | — | ||
| Cheilinus trilobatus | PR | PR | CAR | High | — | |
| Chlorurus japanensis | PR | PR | RH | High | — | |
| Chlorurus microrhinos | Rec PR | Rec PR | RH | High | 10 | |
| Chlorurus spilurus | Rec PR | Rec PR | Rec PR | RH | High | 10 |
| Chromis weberi | PR | PLK | Low | — | ||
| Cirrhilabrus cyanopleura | PR | PR | PLK | Low | — | |
| Cirrhilabrus exquisitus | PR | Rec PR | PLK | Low | 7.8 | |
| Cirrhilabrus melanomarginatus | Rec PR | Rec PR | PLK | Low | 7.8 | |
| Cirrhitichthys aprinus | PR | CAR | Low | — | ||
| Cirrhitichthys falco | PR | PR | CAR | Low | — | |
| Cirrhitichthys oxycephalus | PR | PR | CAR | Low | — | |
| Coris aygula | PR | MIF | High | — | ||
| Coris caudimacula | PR | MIF | High | — | ||
| Coris gaimard | Rec | Rec | Rec PR | MIF | High | 11 |
| Ctenochaetus binotatus | PR | RH | High | — | ||
| Ctenochaetus striatus | PR | PR | RH | High | — | |
| Dascyllus reticulatus | Rec PR | PLK | Low | 11.1 | ||
| Dascyllus trimaculatus | PR | Rec PR | PLK | Low | 11.1 | |
| Dendrochirus zebra | PR | PR | CAR | Low | — | |
| Gomphosus varius | Rec PR | Rec PR | CAR | High | 15 | |
| Grammistes sexlineatus | PR | CAR | High | — | ||
| Gymnothorax meleagris | PR | CAR | High | — | ||
| Halichoeres biocellatus | Rec PR | PR | MIF | High | 10 | |
| Halichoeres chrysus | PR | PR | MIF | High | — | |
| Halichoeres hortulanus | Rec PR | Rec PR | MIF | High | 10 | |
| Halichoeres margaritaceus | PR | PR | MIF | High | — | |
| Halichoeres nebulosus | PR | PR | PR | MIF | High | — |
| Hemigymnus fasciatus | PR | PR | MIF | High | — | |
| Hologymnosus doliatus | PR | MIF | High | — | ||
| Labroides bicolor | PR | CLN | High | — | ||
| Labroides dimidiatus | Rec PR | Rec PR | Rec PR | CLN | High | 12.6 |
| Macropharyngodon meleagris | Rec PR | Rec PR | Rec PR | MIF | High | 9 |
| Macropharyngodon negrosensis | Rec PR | PR | MIF | High | 9 | |
| Meiacanthus grammistes | PR | PR | PLK | Low | — | |
| Ostracion meleagris | PR | OMN | High | — | ||
| Oxycheilinus bimaculatus | PR | PR | MIF | High | — | |
| Oxycheilinus rhodochrous | Rec | MIF | High | 10 | ||
| Oxycheilinus unifasciatus | Rec PR | PR | MIF | High | 10 | |
| Paracirrhites arcatus | PR | PR | CAR | Low | — | |
| Paracirrhites forsteri | PR | CAR | Low | — | ||
| Parapercis clathrata | PR | PR | CAR | High | — | |
| Parapercis hexophthalma | PR | CAR | High | — | ||
| Parupeneus barberinus | Rec PR | MIF | High | 37 | ||
| Parupeneus multifasciatus | Rec | MIF | High | 12.6 | ||
| Plectorhinchus picus | PR | CAR | High | — | ||
| Plectorhinchus vittatus | Rec | PR | PR | CAR | High | 9.6 |
| Plectroglyphidodon dickii | Rec PR | OMN | Low | 11.3 | ||
| Plectroglyphidodon lacrymatus | PR | PR | OMN | Low | — | |
| Pomacentrus bankanensis | Rec PR | PR | OMN | Low | 14.4 | |
| Pomacentrus chrysurus | Rec PR | OMN | Low | 13.3 | ||
| Pomacentrus coelestis | PR | PR | PR | OMN | Low | — |
| Pomacentrus vaiuli | PR | PR | OMN | Low | — | |
| Pseudanthias squamipinnis | Rec | Rec | PLK | Low | 1 | |
| Pseudocheilinus evanidus | PR | MIF | Low | — | ||
| Pseudocheilinus hexataenia | Rec PR | Rec PR | MIF | Low | 5 | |
| Pterois antennata | PR | MIF | Low | — | ||
| Pterois radiata | PR | MIF | Low | — | ||
| Pterois volitans | PR | CAR | Low | — | ||
| Pycnochromis margaritifer | Rec PR | Rec PR | Rec PR | PLK | Low | 14.5 |
| Pycnochromis vanderbilti | Rec PR | Rec | PLK | Low | 14.5 | |
| Scarus forsteni | Rec | Rec PR | RH | High | 15 | |
| Scarus globiceps | PR | RH | High | — | ||
| Scarus hypselopterus | PR | RH | High | — | ||
| Scarus psittacus | Rec PR | PR | RH | High | 12 | |
| Scorpaenopsis papuensis | PR | CAR | Low | — | ||
| Sebastapistes cyanostigma | PR | PR | CAR | Low | — | |
| Stegastes nigricans | PR | TH | Low | — | ||
| Stethojulis bandanensis | PR | PR | PR | MIF | High | — |
| Stethojulis trilineata | Rec PR | Rec PR | MIF | High | 7 | |
| Thalassoma amblycephalum | Rec PR | Rec PR | MIF | High | 14 | |
| Thalassoma hardwicke | PR | Rec PR | Rec PR | MIF | High | 14 |
| Thalassoma jansenii | PR | PR | MIF | High | — | |
| Thalassoma lunare | Rec | MIF | High | 11 | ||
| Thalassoma lutecens | PR | Rec PR | PR | MIF | High | 12.5 |
| Thalassoma purpureum | PR | MIF | High | — | ||
| Thalassoma quinquevittatum | PR | Rec PR | Rec PR | MIF | High | 14 |
| Zanclus cornutus | PR | PR | MIF | High | — |
TABLE A3.
Results of the pairwise Dunn's test for the abundance and richness of recruits between months according to DOV and UVC methods. Stars indicate months when DOV was the collection method.
| Month pair | Z | p.adj | |
|---|---|---|---|
| Recruit abundance | |||
| 2022‐03‐18 | *2022‐04‐15 | −1.74 | 0.20 |
| 2022‐03‐18 | 2022‐05‐30 | −2.37 | 0.07 |
| *2022‐04‐15 | 2022‐05‐30 | −0.62 | 0.66 |
| 2022‐03‐18 | *2022‐07‐20 | −0.53 | 0.67 |
| *2022‐04‐15 | *2022‐07‐20 | 1.21 | 0.39 |
| 2022‐05‐30 | *2022‐07‐20 | 1.83 | 0.19 |
| 2022‐03‐18 | 2022‐08‐09 | −1.15 | 0.41 |
| 2022‐04‐15 | 2022‐08‐09 | 0.59 | 0.65 |
| 2022‐05‐30 | 2022‐08‐09 | 1.21 | 0.43 |
| *2022‐07‐20 | 2022‐08‐09 | −0.62 | 0.64 |
| Recruit richness | |||
| 2022‐03‐18 | *2022‐04‐15 | −2.03 | 0.14 |
| 2022‐03‐18 | 2022‐05‐30 | −2.39 | 0.06 |
| *2022‐04‐15 | 2022‐05‐30 | −0.36 | 0.76 |
| 2022‐03‐18 | *2022‐07‐20 | −0.58 | 0.67 |
| *2022‐04‐15 | *2022‐07‐20 | 1.45 | 0.29 |
| 2022‐05‐30 | *2022‐07‐20 | 1.81 | 0.18 |
| 2022‐03‐18 | 2022‐08‐09 | −1.3 | 0.37 |
| *2022‐04‐15 | 2022‐08‐09 | 0.73 | 0.62 |
| 2022‐05‐30 | 2022‐08‐09 | 1.09 | 0.47 |
| *2022‐07‐20 | 2022‐08‐09 | −0.72 | 0.61 |
TABLE A4.
Results of the pairwise Dunn's test for the abundance and richness of post‐recruits between months according to DOV and UVC methods. Stars indicate months when DOV was the collection method.
| Month pair | Z | p.adj | |
|---|---|---|---|
| Post‐recruit abundance | |||
| 2022‐03‐18 | *2022‐04‐15 | −1.48 | 0.62 |
| 2022‐03‐18 | 2022‐05‐30 | −2.23 | 0.92 |
| *2022‐04‐15 | 2022‐05‐30 | −0.75 | 0.86 |
| 2022‐03‐18 | *2022‐07‐20 | −0.82 | 0.83 |
| *2022‐04‐15 | *2022‐07‐20 | 0.67 | 0.91 |
| 2022‐05‐30 | *2022‐07‐20 | 1.42 | 0.51 |
| 2022‐03‐18 | 2022‐08‐09 | −0.65 | 0.84 |
| *2022‐04‐15 | 2022‐08‐09 | 0.83 | 0.86 |
| 2022‐05‐30 | 2022‐08‐09 | 1.58 | 0.58 |
| *2022‐07‐20 | 2022‐08‐09 | 0.16 | 0.92 |
| Post‐recruit richness | |||
| 2022‐03‐18 | *2022‐04‐15 | −1.81 | 0.36 |
| 2022‐03‐18 | 2022‐05‐30 | −2.12 | 0.41 |
| *2022‐04‐15 | 2022‐05‐30 | −0.31 | 0.94 |
| 2022‐03‐18 | *2022‐07‐20 | −0.55 | 0.88 |
| *2022‐04‐15 | *2022‐07‐20 | 1.26 | 0.53 |
| 2022‐05‐30 | *2022‐07‐20 | 1.57 | 0.42 |
| 2022‐03‐18 | 2022‐08‐09 | −0.36 | 0.96 |
| *2022‐04‐15 | 2022‐08‐09 | 1.45 | 0.48 |
| 2022‐05‐30 | 2022‐08‐09 | 1.76 | 0.31 |
| *2022‐07‐20 | 2022‐08‐09 | 0.19 | 0.96 |
TABLE A5.
GLMM outputs for the comparison of recruit and post‐recruit abundances and richness among patch types. The estimated coefficients (log scale), standard errors, 95% confidence intervals, z‐values, and p‐values of fixed effects are presented. Significant differences (p < 0.05) are highlighted in bold.
| Estimate | SE | Lower limit | Upper limit | z | Pr (>|z|) | |
|---|---|---|---|---|---|---|
| Recruit abundance | ||||||
| Control (Intercept) | −1.52 | 0.52 | −2.53 | −0.5 | −2.92 | < 0.001 |
| Dead | 2.36 | 0.42 | 1.53 | 3.19 | 5.56 | < 0.001 |
| Live | 2.56 | 0.43 | 1.73 | 3.4 | 6.01 | < 0.001 |
| Recruit richness | ||||||
| Control (Intercept) | −1.8 | 0.45 | −2.69 | −0.91 | −3.97 | < 0.001 |
| Dead | 2.24 | 0.38 | 1.49 | 2.99 | 5.89 | < 0.001 |
| Live | 2.31 | 0.38 | 1.57 | 3.06 | 6.1 | < 0.001 |
| Post‐recruit abundance | ||||||
| Control (Intercept) | 0.41 | 0.26 | −0.1 | 0.91 | 1.58 | 0.11 |
| Dead | 1.94 | 0.26 | 1.42 | 2.45 | 7.38 | < 0.001 |
| Live | 2.85 | 0.27 | 2.33 | 3.37 | 10.75 | < 0.001 |
| Post‐recruit richness | ||||||
| Control (Intercept) | −0.05 | 0.21 | −0.46 | 0.36 | −0.24 | 0.81 |
| Dead | 1.81 | 0.2 | 1.41 | 2.21 | 8.86 | < 0.001 |
| Live | 2.45 | 0.2 | 2.06 | 2.84 | 12.21 | < 0.001 |
TABLE A6.
Post hoc pairwise comparisons of recruit and post‐recruit abundances and richness among patches. Estimated marginal means contrasts are presented with log‐scale estimates, standard error, z‐ratio, and Tukey‐adjusted p‐values. Significant differences (p < 0.05) are highlighted in bold. Tests are based on Wald z‐statistics with asymptotic standard errors (df = ∞).
| Estimate | SE | z.ratio | p | |
|---|---|---|---|---|
| Recruit abundance | ||||
| Control‐Dead | −2.36 | 0.42 | −5.56 | < 0.001 |
| Control‐Live | −2.56 | 0.43 | −6.01 | < 0.001 |
| Dead‐Live | −0.21 | 0.29 | −0.72 | 0.75 |
| Recruit richness | ||||
| Control‐Dead | −2.24 | 0.38 | −5.89 | < 0.001 |
| Control‐Live | −2.31 | 0.38 | −6.1 | < 0.001 |
| Dead‐Live | −0.07 | 0.18 | −0.42 | 0.91 |
| Post‐recruit abundance | ||||
| Control‐Dead | −1.94 | 0.26 | −7.38 | < 0.001 |
| Control‐Live | −2.85 | 0.27 | −10.75 | < 0.001 |
| Dead‐Live | −0.91 | 0.21 | −4.24 | < 0.001 |
| Post‐recruit richness | ||||
| Control‐Dead | −1.81 | 0.2 | −8.86 | < 0.001 |
| Control‐Live | −2.45 | 0.2 | −12.21 | < 0.001 |
| Dead‐Live | −0.64 | 0.13 | −4.94 | < 0.001 |
TABLE A7.
Results of PERMANOVA for the Hellinger‐transformed abundance data of recruit and post‐recruit assemblages. Bold p‐values indicate significant effects (p < 0.05). Permutations were stratified within months and constrained by block (each block contained one live, one dead, and one control patch). Patch represents the three habitat conditions (live, dead, control).
| Stage | Factor | Df | Sum of Sqs | R 2 | F | Pr (> F) |
|---|---|---|---|---|---|---|
| Recruits | Patch | 2 | 1.22 | 0.05 | 1.48 | 0.006 |
| Block | 1 | 0.43 | 0.02 | 1.05 | 0.294 | |
| Residual | 53 | 21.8 | 0.93 | |||
| Total | 56 | 23.45 | 1 | |||
| Post‐recruit | Patch | 2 | 5.38 | 0.16 | 7.86 | 0.001 |
| Block | 1 | 0.68 | 0.02 | 1.98 | 0.010 | |
| Residual | 79 | 27.05 | 0.82 | |||
| Total | 82 | 33.11 | 1 |
TABLE A8.
Results of pairwise PERMANOVA for the Hellinger transformed abundance count data matrix of recruit and post‐recruit assemblages comparing pairs of conditions in the live coral, dead coral, and control patches. Bold letters in the p‐value column indicate statistical significance (p < 0.05). We stratified permutations within months.
| Stage | Pair | Df | Sum of Sqs | R 2 | F | Pr (> F) | |
|---|---|---|---|---|---|---|---|
| Recruits | Live × Dead | 1 | 0.77 | 0.04 | 1.88 | 0.033 | |
| Residual | 51 | 20.87 | 0.96 | ||||
| Total | 52 | 21.64 | 1 | ||||
| Live × Control | 1 | 0.52 | 0.04 | 1.29 | 0.178 | ||
| Residual | 29 | 11.61 | 0.96 | ||||
| Total | 30 | 12.12 | 1 | ||||
| Dead × Control | 1 | 0.42 | 0.03 | 0.97 | 0.506 | ||
| Residual | 28 | 12 | 0.97 | ||||
| Total | 29 | 12.42 | 1 | ||||
| Post‐recruits | Live × Dead | 1 | 3.65 | 0.14 | 11.04 | 0.001 | |
| Residual | 67 | 22.13 | 0.86 | ||||
| Total | 68 | 25.78 | 1 | ||||
| Live × Control | 1 | 2.89 | 0.17 | 9.52 | 0.001 | ||
| Residual | 48 | 14.57 | 0.83 | ||||
| Total | 49 | 17.46 | 1 | ||||
| Dead × Control | 1 | 1.08 | 0.05 | 2.59 | 0.001 | ||
| Residual | 45 | 18.75 | 0.95 | ||||
| Total | 46 | 19.82 | 1 |
TABLE A9.
GLMM outputs for the comparison of recruit and post‐recruit abundances by mobility habit. The estimated coefficients (log scale), standard errors, 95% confidence intervals, z‐values, and p‐values of fixed effects are presented. Significant differences (p < 0.05) are highlighted in bold.
| Estimate | SE | Lower limit | Upper limit | z | Pr (>|z|) | |
|---|---|---|---|---|---|---|
| Recruit/high mobility | ||||||
| Control (Intercept) | −1.59 | 0.51 | −2.59 | −0.59 | −3.12 | < 0.01 |
| Dead | 2.11 | 0.44 | 1.25 | 2.98 | 4.79 | < 0.001 |
| Live | 2.13 | 0.44 | 1.27 | 2.99 | 4.85 | < 0.001 |
| Recruit/low mobility | ||||||
| Control (Intercept) | −1.79 | 0.83 | −3.42 | −0.17 | −2.16 | 0.031 |
| Dead | 1 | 0.9 | −0.77 | 2.77 | 1.11 | 0.267 |
| Live | 1.04 | 0.9 | −0.72 | 2.81 | 1.16 | 0.247 |
| Post‐recruit/high mobility | ||||||
| Control (Intercept) | −0.41 | 0.27 | −0.95 | 0.12 | −1.52 | 0.129 |
| Dead | 1.93 | 0.3 | 1.35 | 2.51 | 6.53 | < 0.001 |
| Live | 2.42 | 0.29 | 1.85 | 3 | 8.25 | < 0.001 |
| Post‐recruit/low mobility | ||||||
| Control (Intercept) | 0.09 | 0.34 | −0.58 | 0.76 | 0.27 | 0.791 |
| Dead | −0.6 | 0.42 | −1.42 | 0.21 | −1.45 | 0.148 |
| Live | 0.58 | 0.41 | −0.22 | 1.38 | 1.43 | 0.154 |
TABLE A10.
Post hoc pairwise comparisons of recruit and post‐recruit abundances by mobility habit. Estimated marginal means contrasts are presented with log‐scale estimates, standard error, z‐ratio, and Tukey‐adjusted p‐values. Significant differences (p < 0.05) are highlighted in bold. Tests are based on Wald z‐statistics with asymptotic standard errors (df = ∞).
| Estimate | SE | z.ratio | p | |
|---|---|---|---|---|
| Recruits/high mobility | ||||
| Control—Dead | −2.11 | 0.44 | −4.79 | < 0.001 |
| Control—Live | −2.13 | 0.44 | −4.85 | < 0.001 |
| Dead—Live | −0.02 | 0.32 | −0.06 | 1 |
| Recruits/low mobility | ||||
| Control—Dead | −3.11 | 0.8 | −3.91 | < 0.001 |
| Control—Live | −3.17 | 0.8 | −3.98 | < 0.001 |
| Dead—Live | −0.06 | 0.37 | −0.16 | 0.99 |
| Post‐recruits/high mobility | ||||
| Control—Dead | −1.93 | 0.3 | −6.53 | < 0.001 |
| Control—Live | −2.42 | 0.29 | −8.25 | < 0.001 |
| Dead—Live | −0.49 | 0.23 | −2.16 | 0.08 |
| Post‐recruits/low mobility | ||||
| Control—Dead | −1.33 | 0.3 | −4.41 | < 0.001 |
| Control—Live | −3 | 0.29 | −10.25 | < 0.001 |
| Dead—Live | −1.67 | 0.24 | −7.11 | < 0.001 |
TABLE A11.
GLMM outputs for the comparison of recruit abundance by trophic group. The estimated coefficients (log scale), standard errors, 95% confidence intervals, z‐values, and p‐values of fixed effects are presented. Significant differences (p < 0.05) are highlighted in bold. Standard errors and confidence intervals exceeding ±100 were truncated for readability.
| Recruits | Trophic group | Estimate | SE | Lower limit | Upper limit | z | Pr (>|z|) |
|---|---|---|---|---|---|---|---|
| Control (Intercept) | CAR | −4.01 | 1.1 | −6.17 | −1.85 | −3.64 | < 0.001 |
| Dead | CAR | 0.64 | 1.29 | −1.88 | 3.16 | 0.5 | 0.62 |
| Live | CAR | 2.82 | 1.09 | 0.67 | 4.96 | 2.58 | 0.01 |
| Control (Intercept) | CLN | −0.08 | 1.47 | −2.95 | 2.8 | −0.05 | 0.96 |
| Dead | CLN | 0.14 | 1.82 | −3.42 | 3.7 | 0.08 | 0.94 |
| Live | CLN | −1.51 | 1.61 | −4.67 | 1.64 | −0.94 | 0.35 |
| Control (Intercept) | MIF | 1.26 | 1.18 | −1.06 | 3.58 | 1.06 | 0.29 |
| Dead | MIF | 2.27 | 1.43 | −0.54 | 5.07 | 1.58 | 0.11 |
| Live | MIF | 0.28 | 1.26 | −2.19 | 2.75 | 0.22 | 0.83 |
| Control (Intercept) | OMN | −16.84 | > 100 | < −100 | > 100 | 0 | 1 |
| Dead | OMN | 17.35 | > 100 | < −100 | > 100 | 0 | 1 |
| Live | MON | 15.66 | > 100 | < −100 | > 100 | 0 | 1 |
| Control (Intercept) | PLK | 0.6 | 1.28 | −1.91 | 3.12 | 0.47 | 0.64 |
| Dead | PLK | 2.02 | 1.52 | −0.97 | 5 | 1.32 | 0.19 |
| Live | PLK | −0.1 | 1.37 | −2.78 | 2.58 | −0.07 | 0.94 |
| Control (Intercept) | RH | 1.8 | 1.14 | −0.43 | 4.03 | 1.58 | 0.11 |
| Dead | RH | 1.09 | 1.4 | −1.64 | 3.83 | 0.78 | 0.43 |
| Live | RH | −2.61 | 1.28 | −5.11 | −0.11 | −2.05 | 0.04 |
Abbreviations: CAR, carnivore; CLN, cleaner; COR, corallivore; MIF, motile invertebrate feeder; OMN, omnivore; PLK, planktivore; RH, roving herbivore; SIF, sessile invertebrate feeder; TH, territorial herbivore.
TABLE A12.
Post hoc pairwise comparisons of recruit abundance by trophic group. Estimated marginal means contrasts are presented with log‐scale estimates, standard error, z‐ratio, and Tukey‐adjusted p‐values. Significant differences (p < 0.05) are highlighted in bold. Tests are based on Wald z‐statistics with asymptotic standard errors (df = ∞). Standard errors exceeding ±100 were truncated for readability.
| Recruits | Trophic group | Estimate | SE | z.ratio | p |
|---|---|---|---|---|---|
| Control—Dead | CAR | −0.64 | 1.29 | −0.5 | 0.87 |
| Control—Live | CAR | −2.82 | 1.09 | −2.58 | 0.03 |
| Dead—Live | CAR | −2.18 | 0.83 | −2.62 | 0.02 |
| Control—Dead | CLN | −0.77 | 1.28 | −0.6 | 0.82 |
| Control—Live | CLN | −1.3 | 1.18 | −1.1 | 0.51 |
| Dead—Live | CLN | −0.53 | 0.95 | −0.56 | 0.84 |
| Control—Dead | MIF | −2.9 | 0.63 | −4.59 | < 0.001 |
| Control—Live | MIF | −3.09 | 0.63 | −4.92 | < 0.001 |
| Dead—Live | MIF | −0.19 | 0.37 | −0.51 | 0.87 |
| Control—Dead | OMN | −17.99 | < 100 | 0 | 1 |
| Control—Live | OMN | −18.48 | < 100 | 0 | 1 |
| Dead—Live | OMN | −0.49 | 0.8 | −0.61 | 0.82 |
| Control—Dead | PLK | −2.65 | 0.82 | −3.25 | < 0.001 |
| Control—Live | PLK | −2.72 | 0.82 | −3.31 | < 0.001 |
| Dead—Live | PLK | −0.06 | 0.43 | −0.15 | 0.99 |
| Control—Dead | RH | −1.73 | 0.55 | −3.16 | < 0.001 |
| Control—Live | RH | −0.21 | 0.65 | −0.32 | 0.95 |
| Dead—Live | RH | 1.52 | 0.54 | 2.81 | 0.01 |
Abbreviations: CAR, carnivore; CLN, cleaner; COR, corallivore; MIF, motile invertebrate feeder; OMN, omnivore; PLK, planktivore; RH, roving herbivore; SIF, sessile invertebrate feeder; TH, territorial herbivore.
TABLE A13.
GLMM outputs for the comparison of post‐recruit abundance by trophic group. The estimated coefficients (log scale), standard errors, 95% confidence intervals, z‐values, and p‐values of fixed effects are presented. Significant differences (p < 0.05) are highlighted in bold. Standard errors and confidence intervals exceeding ±100 were truncated for readability.
| Post‐recruit | Trophic group | Estimate | SE | Lower limit | Upper limit | z | Pr (>|z|) |
|---|---|---|---|---|---|---|---|
| Control (Intercept) | CAR | −2.54 | 0.61 | −3.74 | −1.34 | −4.16 | < 0.001 |
| Dead | CAR | 1.91 | 0.66 | 0.62 | 3.21 | 2.89 | < 0.001 |
| Live | CAR | 4.01 | 0.63 | 2.78 | 5.25 | 6.38 | < 0.001 |
| Control (Intercept) | CLN | −1.11 | 1.18 | −3.42 | 1.2 | −0.94 | 0.35 |
| Dead | CLN | −0.84 | 1.35 | −3.49 | 1.81 | −0.62 | 0.54 |
| Live | CLN | −1.21 | 1.23 | −3.62 | 1.2 | −0.98 | 0.33 |
| Control (Intercept) | COR | −17.39 | > 100 | < −100 | > 100 | −0.01 | 1 |
| Dead | COR | −14.87 | > 100 | < −100 | > 100 | 0 | 1 |
| Live | COR | 12.3 | > 100 | < −100 | > 100 | 0 | 1 |
| Control (Intercept) | MIF | 1.94 | 0.66 | 0.65 | 3.24 | 2.95 | < 0.001 |
| Dead | MIF | −0.02 | 0.74 | −1.47 | 1.42 | −0.03 | 0.98 |
| Live | MIF | −1.69 | 0.71 | −3.07 | −0.31 | −2.4 | < 0.001 |
| Control (Intercept) | OMN | 2.05 | 0.66 | 0.76 | 3.34 | 3.12 | < 0.001 |
| Dead | OMN | −1.28 | 0.75 | −2.75 | 0.19 | −1.71 | 0.09 |
| Live | OMN | −2.4 | 0.71 | −3.79 | −1.01 | −3.38 | < 0.001 |
| Control (Intercept) | PLK | 0.47 | 0.77 | −1.04 | 1.97 | 0.61 | 0.54 |
| Dead | PLK | 0.19 | 0.85 | −1.48 | 1.85 | 0.22 | 0.83 |
| Live | PLK | −0.04 | 0.81 | −1.62 | 1.55 | −0.05 | 0.96 |
| Control (Intercept) | RH | −0.43 | 0.94 | −2.28 | 1.42 | −0.45 | 0.65 |
| Dead | RH | 0.66 | 1.02 | −1.33 | 2.66 | 0.65 | 0.51 |
| Live | RH | −1.28 | 0.99 | −3.22 | 0.67 | −1.29 | 0.2 |
| Control (Intercept) | SIF | −19.2 | > 100 | < −100 | > 100 | 0 | 1 |
| Dead | SIF | 16.88 | > 100 | < −100 | > 100 | 0 | 1 |
| Live | SIF | 16.85 | > 100 | < −100 | > 100 | 0 | 1 |
| Control (Intercept) | TH | −18.41 | > 100 | < −100 | > 100 | 0 | 1 |
| Dead | TH | 16.81 | > 100 | < −100 | > 100 | 0 | 1 |
| Live | TH | 14.67 | > 100 | < −100 | > 100 | 0 | 1 |
Abbreviations: CAR, carnivore; CLN, cleaner; COR, corallivore; MIF, motile invertebrate feeder; OMN, omnivore; PLK, planktivore; RH, roving herbivore; SIF, sessile invertebrate feeder; TH, territorial herbivore.
TABLE A14.
Post hoc pairwise comparisons of post‐recruit abundance by trophic group. Estimated marginal means contrasts are presented with log‐scale estimates, standard error, z‐ratio, and Tukey‐adjusted p‐values. Significant differences (p < 0.05) are highlighted in bold. Tests are based on Wald z‐statistics with asymptotic standard errors (df = ∞). Standard errors exceeding ±100 were truncated for readability.
| Post‐recruit | Trophic group | Estimate | SE | z.ratio | p |
|---|---|---|---|---|---|
| Control—Dead | CAR | −1.91 | 0.66 | −2.89 | 0.01 |
| Control—Live | CAR | −4.01 | 0.63 | −6.38 | < 0.001 |
| Dead—Live | CAR | −2.1 | 0.33 | −6.29 | < 0.001 |
| Control—Dead | CLN | −1.08 | 1.18 | −0.91 | 0.63 |
| Control—Live | CLN | −2.8 | 1.06 | −2.65 | 0.02 |
| Dead—Live | CLN | −1.73 | 0.67 | −2.58 | 0.03 |
| Control—Dead | COR | 12.95 | < 100 | 0 | 1 |
| Control—Live | COR | −16.31 | < 100 | 0 | 1 |
| Dead—Live | COR | −29.26 | < 100 | 0 | 1 |
| Control—Dead | MIF | −1.89 | 0.33 | −5.81 | < 0.001 |
| Control—Live | MIF | −2.32 | 0.32 | −7.18 | < 0.001 |
| Dead—Live | MIF | −0.43 | 0.25 | −1.69 | 0.21 |
| Control—Dead | OMN | −0.63 | 0.35 | −1.79 | 0.17 |
| Control—Live | OMN | −1.62 | 0.33 | −4.89 | < 0.001 |
| Dead—Live | OMN | −0.99 | 0.3 | −3.33 | < 0.001 |
| Control—Dead | PLK | −2.1 | 0.53 | −3.97 | < 0.001 |
| Control—Live | PLK | −3.97 | 0.51 | −7.77 | < 0.001 |
| Dead—Live | PLK | −1.87 | 0.29 | −6.48 | < 0.001 |
| Control—Dead | RH | −2.58 | 0.77 | −3.34 | < 0.001 |
| Control—Live | RH | −2.74 | 0.77 | −3.57 | < 0.001 |
| Dead—Live | RH | −0.16 | 0.35 | −0.45 | 0.9 |
| Control—Dead | SIF | −18.8 | < 100 | 0 | 1 |
| Control—Live | SIF | −20.86 | < 100 | 0 | 1 |
| Dead—Live | SIF | −2.07 | 0.79 | −2.62 | 0.02 |
| Control—Dead | TH | −18.72 | < 100 | 0 | 1 |
| Control—Live | TH | −18.68 | < 100 | 0 | 1 |
| Dead—Live | TH | 0.04 | 0.75 | 0.06 | 1 |
Abbreviations: CAR, carnivore; CLN, cleaner; COR, corallivore; MIF, motile invertebrate feeder; OMN, omnivore; PLK, planktivore; RH, roving herbivore; SIF, sessile invertebrate feeder; TH, territorial herbivore.
Mattos, F. M. G. , Mulla A. J., Denis V., Lin C.‐H., Lin T.‐H., and Nozawa Y.. 2025. “The Role of Live and Dead Corals in Shaping Fish Assemblages Across Life Stages.” Ecology and Evolution 15, no. 11: e72443. 10.1002/ece3.72443.
Funding: This research was funded by an internal research grant from the BRC AS to Y.N. and T.H.L.
Contributor Information
Felipe M. G. Mattos, Email: felipemgmattos@hotmail.com.
Tzu‐Hao Lin, Email: lintzuhao@gate.sinica.edu.tw.
Yoko Nozawa, Email: nozaway@lab.u-ryukyu.ac.jp.
Data Availability Statement
The data supporting the findings of this study are openly available in the depositar repository (https://pid.depositar.io/ark:37281/k5f4j959b).
References
- Acosta, C. , and Robertson D.. 2002. “Diversity in Coral Reef Fish Communities: The Effects of Habitat Patchiness Revisited.” Marine Ecology Progress Series 227: 87–96. 10.3354/meps227087. [DOI] [Google Scholar]
- Agudo‐Adriani, E. A. , Cappelletto J., Cavada‐Blanco F., and Cróquer A.. 2019. “Structural Complexity and Benthic Cover Explain Reef‐Scale Variability of Fish Assemblages in Los Roques National Park, Venezuela.” Frontiers in Marine Science 6: 690. 10.3389/fmars.2019.00690. [DOI] [Google Scholar]
- Ainsworth, C. H. , and Mumby P. J.. 2015. “Coral–Algal Phase Shifts Alter Fish Communities and Reduce Fisheries Production.” Global Change Biology 21, no. 1: 165–172. 10.1111/gcb.12667. [DOI] [PMC free article] [PubMed] [Google Scholar]
- Allen, G. , Steene R., Humann P., and DeLoach N.. 2015. Reef Fish Identification: Tropical Pacific. 2nd ed. New World Publications. [Google Scholar]
- Almany, G. R. 2004a. “Differential Effects of Habitat Complexity, Predators and Competitors on Abundance of Juvenile and Adult Coral Reef Fishes.” Oecologia 141, no. 1: 105–113. 10.1007/s00442-004-1617-0. [DOI] [PubMed] [Google Scholar]
- Almany, G. R. 2004b. “Does Increased Habitat Complexity Reduce Predation and Competition in Coral Reef Fish Assemblages?” Oikos 106, no. 2: 275–284. 10.1111/j.0030-1299.2004.13193.x. [DOI] [Google Scholar]
- Baensch, F. 2016. “Exploring Aquarium Wrasse Aquaculture and Breeding Success With the Ornate Wrasse.” CORAL 13, no. 6: 38–50. [Google Scholar]
- Baensch, F. 2025. “Shortnose Wrasse Culture.” Zenodo. 10.5281/ZENODO.15778564. [DOI]
- Beese, C. M. , Mumby P. J., and Rogers A.. 2023. “Small‐Scale Habitat Complexity Preserves Ecosystem Services on Coral Reefs.” Journal of Applied Ecology 60, no. 9: 1854–1867. 10.1111/1365-2664.14458. [DOI] [Google Scholar]
- Bell, J. , and Galzin R.. 1984. “Influence of Live Coral Cover on Coral‐Reef Fish Communities.” Marine Ecology Progress Series 15: 265–274. 10.3354/meps015265. [DOI] [Google Scholar]
- Bellwood, D. R. 1988. “Ontogenetic Changes in the Diet of Early Post‐Settlement Scarus Species (Pisces: Scaridae).” Journal of Fish Biology 33, no. 2: 213–219. 10.1111/j.1095-8649.1988.tb05464.x. [DOI] [Google Scholar]
- Bellwood, D. R. , and Choat J. H.. 1989. “A Description of the Juvenile Phase Colour Patterns of 24 Parrotfish Species (Family Scaridae) From the Great Barrier Reef, Australia.” Records of the Australian Museum 41: 1–41. 10.3853/j.0067-1975.41.1989.134. [DOI] [Google Scholar]
- Bellwood, D. R. , Pratchett M. S., Morrison T. H., et al. 2019. “Coral Reef Conservation in the Anthropocene: Confronting Spatial Mismatches and Prioritizing Functions.” Biological Conservation 236: 604–615. 10.1016/j.biocon.2019.05.056. [DOI] [Google Scholar]
- Bellwood, D. R. , Tebbett S. B., Bellwood O., et al. 2018. “The Role of the Reef Flat in Coral Reef Trophodynamics: Past, Present, and Future.” Ecology and Evolution 8, no. 8: 4108–4119. 10.1002/ece3.3967. [DOI] [PMC free article] [PubMed] [Google Scholar]
- Bohnsack, J. A. , and Bannerot S. P.. 1986. A Stationary Visual Census Technique for Quantitatively Assessing Community Structure of Coral Reef Fishes. Vol. 41, 1–15. NOAA Technical Report NMFS. http://aquaticcommons.org/2781/. [Google Scholar]
- Bonin, M. C. , Almany G. R., and Jones G. P.. 2011. “Contrasting Effects of Habitat Loss and Fragmentation on Coral‐Associated Reef Fishes.” Ecology 92, no. 7: 1503–1512. 10.1890/10-0627.1. [DOI] [PubMed] [Google Scholar]
- Bonin, M. C. , Munday P. L., McCormick M. I., Srinivasan M., and Jones G. P.. 2009. “Coral‐Dwelling Fishes Resistant to Bleaching but Not to Mortality of Host Corals.” Marine Ecology Progress Series 394: 215–222. 10.3354/meps08294. [DOI] [Google Scholar]
- Booth, D. J. , and Beretta G. A.. 1994. “Seasonal Recruitment, Habitat Associations and Survival of Pomacentrid Reef Fish in the US Virgin Islands.” Coral Reefs 13, no. 2: 81–89. 10.1007/BF00300765. [DOI] [Google Scholar]
- Booth, D. J. , and Beretta G. A.. 2002. “Changes in a Fish Assemblage After a Coral Bleaching Event.” Marine Ecology Progress Series 245: 205–212. 10.3354/meps245205. [DOI] [Google Scholar]
- Booth, D. J. , and Hixon M. A.. 1999. “Food Ration and Condition Affect Early Survival of the Coral Reef Damselfish, Stegastes partitus .” Oecologia 121, no. 3: 364–368. 10.1007/s004420050940. [DOI] [PubMed] [Google Scholar]
- Booth, D. J. , and Wellington G.. 1998. “Settlement Preferences in Coral‐Reef Fishes: Effects on Patterns of Adult and Juvenile Distributions, Individual Fitness and Population Structure.” Australian Journal of Ecology 23, no. 3: 274–279. 10.1111/j.1442-9993.1998.tb00731.x. [DOI] [Google Scholar]
- Brandl, S. J. , Johansen J. L., Casey J. M., Tornabene L., Morais R. A., and Burt J. A.. 2020. “Extreme Environmental Conditions Reduce Coral Reef Fish Biodiversity and Productivity.” Nature Communications 11, no. 1: 3832. 10.1038/s41467-020-17731-2. [DOI] [PMC free article] [PubMed] [Google Scholar]
- Brandl, S. J. , Rasher D. B., Côté I. M., et al. 2019. “Coral Reef Ecosystem Functioning: Eight Core Processes and the Role of Biodiversity.” Frontiers in Ecology and the Environment 17, no. 8: 445–454. 10.1002/fee.2088. [DOI] [Google Scholar]
- Brandl, S. J. , Robbins W. D., and Bellwood D. R.. 2015. “Exploring the Nature of Ecological Specialization in a Coral Reef Fish Community: Morphology, Diet and Foraging Microhabitat Use.” Proceedings of the Royal Society B: Biological Sciences 282, no. 1815: 20151147. 10.1098/rspb.2015.1147. [DOI] [PMC free article] [PubMed] [Google Scholar]
- Brooker, R. M. , Brandl S. J., and Dixson D. L.. 2016. “Cryptic Effects of Habitat Declines: Coral‐Associated Fishes Avoid Coral‐Seaweed Interactions due to Visual and Chemical Cues.” Scientific Reports 6: 18842. 10.1038/srep18842. [DOI] [PMC free article] [PubMed] [Google Scholar]
- Brothers, E. B. , Williams D. M. B., and Sale P. F.. 1983. “Length of Larval Life in Twelve Families of Fishes at “One Tree Lagoon”, Great Barrier Reef, Australia.” Marine Biology 76, no. 3: 319–324. 10.1007/BF00393035. [DOI] [Google Scholar]
- Bruno, J. F. , Côté I. M., and Toth L. T.. 2019. “Climate Change, Coral Loss, and the Curious Case of the Parrotfish Paradigm: Why Don't Marine Protected Areas Improve Reef Resilience?” Annual Review of Marine Science 11, no. 1: 307–334. 10.1146/annurev-marine-010318-095300. [DOI] [PubMed] [Google Scholar]
- Bruno, J. F. , and Selig E. R.. 2007. “Regional Decline of Coral Cover in the Indo‐Pacific: Timing, Extent, and Subregional Comparisons.” PLoS One 2, no. 8: e711. 10.1371/journal.pone.0000711. [DOI] [PMC free article] [PubMed] [Google Scholar]
- Cabaitan, P. C. , Gomez E. D., and Aliño P. M.. 2008. “Effects of Coral Transplantation and Giant Clam Restocking on the Structure of Fish Communities on Degraded Patch Reefs.” Journal of Experimental Marine Biology and Ecology 357, no. 1: 85–98. 10.1016/j.jembe.2008.01.001. [DOI] [Google Scholar]
- Chabanet, P. , Ralambondrainy H., Amanieu M., Faure G., and Galzin R.. 1997. “Relationships Between Coral Reef Substrata and Fish.” Coral Reefs 16, no. 2: 93–102. 10.1007/s003380050063. [DOI] [Google Scholar]
- Chan, Y. , Lo S., Quan A., and Blumstein D. T.. 2019. “Ontogenetic Shifts in Perceptions of Safety Along Structural Complexity Gradients in a Territorial Damselfish.” Current Zoology 65, no. 2: 183–188. 10.1093/cz/zoy091. [DOI] [PMC free article] [PubMed] [Google Scholar]
- Chapman, M. R. , and Kramer D. L.. 2000. “Movements of Fishes Within and Among Fringing Coral Reefs in Barbados.” Environmental Biology of Fishes 57, no. 1: 11–24. 10.1023/A:1004545724503. [DOI] [Google Scholar]
- Cheminée, A. , Merigot B., Vanderklift M. A., and Francour P.. 2016. “Does Habitat Complexity Influence Fish Recruitment?” Mediterranean Marine Science 17, no. 1: 138–146. 10.12681/mms.1231. [DOI] [Google Scholar]
- Chen, L.‐S. 2002. “Post‐Settlement Diet Shift of Chlorurus Sordidus and Scarus schlegeli (Pisces: Scaridae).” Zoological Studies 41, no. 1: 47–58. [Google Scholar]
- Cheung, P.‐Y. , Nozawa Y., and Miki T.. 2021. “Ecosystem Engineering Structures Facilitate Ecological Resilience: A Coral Reef Model.” Ecological Research 36, no. 4: 673–685. 10.1111/1440-1703.12230. [DOI] [Google Scholar]
- Choat, J. H. 1991. “The Biology of Herbivorous Fishes on Coral Reefs.” In The Ecology of Fishes on Coral Reefs, edited by Sale P. F., 120–155. Academic Press. [Google Scholar]
- Christensen, V. , Coll M., Piroddi C., Steenbeek J., Buszowski J., and Pauly D.. 2014. “A Century of Fish Biomass Decline in the Ocean.” Marine Ecology Progress Series 512: 155–166. 10.3354/meps10946. [DOI] [Google Scholar]
- Coker, D. J. , Graham N. A. J., and Pratchett M. S.. 2012. “Interactive Effects of Live Coral and Structural Complexity on the Recruitment of Reef Fishes.” Coral Reefs 31, no. 4: 919–927. 10.1007/s00338-012-0920-1. [DOI] [Google Scholar]
- Coker, D. J. , Wilson S. K., and Pratchett M. S.. 2013. “Importance of Live Coral Habitat for Reef Fishes.” Reviews in Fish Biology and Fisheries 24, no. 1: 89–126. 10.1007/s11160-013-9319-5. [DOI] [Google Scholar]
- Collins, W. P. , Bellwood D. R., and Morais R. A.. 2024. “Small Coral Reef Fishes With Large Ecological Footprints.” Coral Reefs 43, no. 2: 233–242. 10.1007/s00338-023-02384-6. [DOI] [Google Scholar]
- Dai, C.‐F. , Soong K., Chen C. A., et al. 2009. “The Status of Coral Reefs in Taiwan and the Conservation Problems.” In Proceedings of the Fourth International Conference on Environmental Problems in East Asia, 265–276. IUCN/WCPA‐EA4. [Google Scholar]
- Darling, E. S. , Graham N. A. J., Januchowski‐Hartley F. A., Nash K. L., Pratchett M. S., and Wilson S. K.. 2017. “Relationships Between Structural Complexity, Coral Traits, and Reef Fish Assemblages.” Coral Reefs 36, no. 2: 561–575. 10.1007/s00338-017-1539-z. [DOI] [Google Scholar]
- De'ath, G. , Fabricius K. E., Sweatman H., and Puotinen M.. 2012. “The 27–Year Decline of Coral Cover on the Great Barrier Reef and Its Causes.” Proceedings of the National Academy of Sciences of the United States of America 109, no. 44: 17995–17999. 10.1073/pnas.1208909109. [DOI] [PMC free article] [PubMed] [Google Scholar]
- Donati, G. , Parravicini V., Leprieur F., et al. 2019. “A Process‐Based Model Supports an Association Between Dispersal and the Prevalence of Species Traits in Tropical Reef Fish Assemblages.” Ecography 42, no. 12: 2099–2110. 10.1111/ecog.04537. [DOI] [Google Scholar]
- Emslie, M. J. , Cheal A. J., and Johns K. A.. 2014. “Retention of Habitat Complexity Minimizes Disassembly of Reef Fish Communities Following Disturbance: A Large‐Scale Natural Experiment.” PLoS One 9, no. 8: e105384. 10.1371/journal.pone.0105384. [DOI] [PMC free article] [PubMed] [Google Scholar]
- Emslie, M. J. , Cheal A. J., Sweatman H., and Delean S.. 2008. “Recovery From Disturbance of Coral and Reef Fish Communities on the Great Barrier Reef, Australia.” Marine Ecology Progress Series 371: 177–190. 10.3354/meps07657. [DOI] [Google Scholar]
- Fakan, E. P. , Dubuc A., Hemingson C. R., McCormick M. I., and Hoey A. S.. 2025. “Habitat Degradation Has Species‐Specific Effects on the Stress Response of Coral Reef Fishes.” Journal of Experimental Marine Biology and Ecology 582: 152070. 10.1016/j.jembe.2024.152070. [DOI] [Google Scholar]
- Farmer, N. , and Ault J.. 2011. “Grouper and Snapper Movements and Habitat Use in Dry Tortugas, Florida.” Marine Ecology Progress Series 433: 169–184. 10.3354/meps09198. [DOI] [Google Scholar]
- Feary, D. A. , Almany G. R., McCormick M. I., and Jones G. P.. 2007. “Habitat Choice, Recruitment and the Response of Coral Reef Fishes to Coral Degradation.” Oecologia 153, no. 3: 727–737. 10.1007/s00442-007-0773-4. [DOI] [PubMed] [Google Scholar]
- Félix‐Hackradt, F. C. 2013. “Temporal Patterns of Settlement, Recruitment and Post‐Settlement Losses in a Rocky Reef Fish Assemblage in the South‐Western Mediterranean Sea.” Marine Biology 160, no. 9: 2337–2347. 10.1007/s00227-013-2236-1. [DOI] [Google Scholar]
- Félix‐Hackradt, F. C. , Hackradt C. W., Treviño‐Otón J., Pérez‐Ruzafa A., and García‐Charton J. A.. 2014. “Habitat Use and Ontogenetic Shifts of Fish Life Stages at Rocky Reefs in South‐Western Mediterranean Sea.” Journal of Sea Research 88: 67–77. 10.1016/j.seares.2013.12.018. [DOI] [Google Scholar]
- Ferreira, C. E. L. , Floeter S. R., Gasparini J. L., Ferreira B. P., and Joyeux J. C.. 2004. “Trophic Structure Patterns of Brazilian Reef Fishes: A Latitudinal Comparison.” Journal of Biogeography 31, no. 7: 1093–1106. 10.1111/j.1365-2699.2004.01044.x. [DOI] [Google Scholar]
- Ferreira, C. M. , Coni E. O. C., Medeiros D. V., et al. 2015. “Community Structure of Shallow Rocky Shore Fish in a Tropical Bay of the Southwestern Atlantic.” Brazilian Journal of Oceanography 63, no. 4: 379–396. 10.1590/S1679-87592015074706304. [DOI] [Google Scholar]
- Floeter, S. R. , Krohling W., Gasparini J. L., Ferreira C. E. L., and Zalmon I. R.. 2006. “Reef Fish Community Structure on Coastal Islands of Southeastern Brazil: The Influence of Exposure and Benthic Cover.” Environmental Biology of Fishes 76, no. 2‐4: 195–206. 10.1007/s10641-006-9084-6. [DOI] [Google Scholar]
- Francini‐Filho, R. B. , Ferreira C. M., Coni E. O. C., de Moura R. L., and Kaufman L.. 2010. “Foraging Activity of Roving Herbivorous Reef Fish (Acanthuridae and Scaridae) in Eastern Brazil: Influence of Resource Availability and Interference Competition.” Journal of the Marine Biological Association of the United Kingdom 90, no. 3: 481–492. 10.1017/S0025315409991147. [DOI] [Google Scholar]
- Frederick, J. 1997. “Post‐Settlement Movement of Coral Reef Fishes and Bias in Survival Estimates.” Marine Ecology Progress Series 150: 65–74. 10.3354/meps150065. [DOI] [Google Scholar]
- Froese, R. , and Pauly D., eds. 2025. “FishBase.” World Wide Web Electronic Publication. www.fishbase.org, version (04/2025).
- Garpe, K. C. , Yahya S. A. S., Lindahl U., and Öhman M. C.. 2006. “Long‐Term Effects of the 1998 Coral Bleaching Event on Reef Fish Assemblages.” Marine Ecology Progress Series 315: 237–247. 10.3354/meps315237. [DOI] [Google Scholar]
- Giffin, A. L. , Rueger T., and Jones G. P.. 2019. “Ontogenetic Shifts in Microhabitat Use and Coral Selectivity in Three Coral Reef Fishes.” Environmental Biology of Fishes 102, no. 1: 55–67. 10.1007/s10641-019-0842-7. [DOI] [Google Scholar]
- Gilmour, J. P. , Smith L. D., Heyward A. J., Baird A. H., and Pratchett M. S.. 2013. “Recovery of an Isolated Coral Reef System Following Severe Disturbance.” Science 340, no. 6128: 69–71. 10.1126/science.1232310. [DOI] [PubMed] [Google Scholar]
- Goatley, C. H. R. , and Bellwood D. R.. 2016. “Body Size and Mortality Rates in Coral Reef Fishes: A Three‐Phase Relationship.” Proceedings of the Royal Society B: Biological Sciences 283, no. 1841: 20161858. 10.1098/rspb.2016.1858. [DOI] [PMC free article] [PubMed] [Google Scholar]
- Graham, N. A. J. , Nash K. L., and Kool J. T.. 2011. “Coral Reef Recovery Dynamics in a Changing World.” Coral Reefs 30, no. 2: 283–294. 10.1007/s00338-010-0717-z. [DOI] [Google Scholar]
- Graham, N. A. J. , Wilson S. K., Pratchett M. S., Polunin N. V. C., and Spalding M. D.. 2009. “Coral Mortality Versus Structural Collapse as Drivers of Corallivorous Butterflyfish Decline.” Biodiversity and Conservation 18, no. 12: 3325–3336. 10.1007/s10531-009-9633-3. [DOI] [Google Scholar]
- Grol, M. , Rypel A., and Nagelkerken I.. 2014. “Growth Potential and Predation Risk Drive Ontogenetic Shifts Among Nursery Habitats in a Coral Reef Fish.” Marine Ecology Progress Series 502: 229–244. 10.3354/meps10682. [DOI] [Google Scholar]
- Grutter, A. S. , Blomberg S. P., Fargher B., Kuris A. M., McCormick M. I., and Warner R. R.. 2017. “Size‐Related Mortality due to Gnathiid Isopod Micropredation Correlates With Settlement Size in Coral Reef Fishes.” Coral Reefs 36, no. 2: 549–559. 10.1007/s00338-016-1537-6. [DOI] [Google Scholar]
- Grutter, A. S. , and Poulin R.. 1998. “Cleaning of Coral Reef Fishes by the Wrasse Labroides dimidiatus: Influence of Client Body Size and Phylogeny.” Copeia 1998, no. 1: 120–127. 10.2307/1447707. [DOI] [Google Scholar]
- Halpern, B. S. , Gaines S. D., and Warner R. R.. 2005. “Habitat Size, Recruitment, and Longevity as Factors Limiting Population Size in Stage‐Structured Species.” American Naturalist 165, no. 1: 82–94. 10.1086/426672. [DOI] [PubMed] [Google Scholar]
- Hartig, F. 2024. DHARMa: Residual Diagnostics for Hierarchical (Multi‐Level/Mixed) Regression Models_R Package Version 0.4.7. https://CRAN.R‐project.org/package=DHARMa.
- Head, C. E. I. , Bonsall M. B., Koldewey H., Pratchett M. S., Speight M., and Rogers A. D.. 2015. “High Prevalence of Obligate Coral‐Dwelling Decapods on Dead Corals in the Chagos Archipelago, Central Indian Ocean.” Coral Reefs 34, no. 3: 905–915. 10.1007/s00338-015-1307-x. [DOI] [Google Scholar]
- Helder, N. K. , Burns J. H. R., and Green S. J.. 2022. “Intra‐Habitat Structural Complexity Drives the Distribution of Fish Trait Groups on Coral Reefs.” Ecological Indicators 142: 109266. 10.1016/j.ecolind.2022.109266. [DOI] [Google Scholar]
- Holbrook, S. J. , Schmitt R. J., and Brooks A. J.. 2000. “Spatial and Temporal Patterns in Abundance of a Damselfish Reflect Availability of Suitable Habitat.” Oecologia 122, no. 1: 109–120. 10.1007/PL00008829. [DOI] [PubMed] [Google Scholar]
- Hughes, T. P. 1994. “Catastrophes, Phase Shifts, and Large‐Scale Degradation of a Caribbean Coral Reef.” Science 265, no. 5178: 1547–1551. [DOI] [PubMed] [Google Scholar]
- Jenkins, S. R. , Marshall D., and Fraschetti S.. 2009. “Settlement and Recruitment.” In Marine Hard Bottom Communities: Patterns, Dynamics, Diversity, and Change, edited by Wahl M., 177–190. Springer. 10.1007/b76710_12. [DOI] [Google Scholar]
- Jessen, C. , and Wild C.. 2013. “Herbivory Effects on Benthic Algal Composition and Growth on a Coral Reef Flat in the Egyptian Red Sea.” Marine Ecology Progress Series 476: 9–21. 10.3354/meps10157. [DOI] [Google Scholar]
- Johansson, C. L. , Bellwood D. R., and Depczynski M.. 2012. “The Importance of Live Coral for Small‐Sized Herbivorous Reef Fishes in Physically Challenging Environments.” Marine and Freshwater Research 63, no. 8: 672–679. 10.1071/MF12011. [DOI] [Google Scholar]
- Jones, G. 1990. “The Importance of Recruitment to the Dynamics of a Coral Reef Fish Population.” Ecology 71: 1691–1698. 10.2307/1937578. [DOI] [Google Scholar]
- Jones, G. P. , McCormick M. I., Srinivasan M., and Eagle J. V.. 2004. “Coral Decline Threatens Fish Biodiversity in Marine Reserves.” Proceedings of the National Academy of Sciences 101, no. 21: 8251–8253. 10.1073/pnas.0401277101. [DOI] [PMC free article] [PubMed] [Google Scholar]
- Juncker, M. , Wantiez L., and Ponton D.. 2006. “Flexibility in Size and Age at Settlement of Coral Reef Fish: Spatial and Temporal Variations in Wallis Islands (South Central Pacific).” Aquatic Living Resources 19: 339–348. 10.1051/alr:2007004. [DOI] [Google Scholar]
- Keough, M. J. , and Downes B. J.. 1982. “Recruitment of Marine Invertebrates: The Role of Active Larval Choices and Early Mortality.” Oecologia 54, no. 3: 348–352. 10.1007/BF00380003. [DOI] [PubMed] [Google Scholar]
- Kimirei, I. A. , Nagelkerken I., Trommelen M., et al. 2013. “What Drives Ontogenetic Niche Shifts of Fishes in Coral Reef Ecosystems?” Ecosystems 16, no. 5: 783–796. 10.1007/s10021-013-9645-4. [DOI] [Google Scholar]
- Komyakova, V. 2018. “Strong Effects of Coral Species on the Diversity and Structure of Reef Fish Communities: A Multi‐Scale Analysis.” PLoS One 13, no. 8: e0202206. 10.1371/journal.pone.0202206. [DOI] [PMC free article] [PubMed] [Google Scholar]
- Komyakova, V. , Munday P. L., and Jones G. P.. 2013. “Relative Importance of Coral Cover, Habitat Complexity and Diversity in Determining the Structure of Reef Fish Communities.” PLoS One 8, no. 12: e83178. 10.1371/journal.pone.0083178. [DOI] [PMC free article] [PubMed] [Google Scholar]
- Komyakova, V. , Munday P. L., and Jones G. P.. 2019. “Comparative Analysis of Habitat Use and Ontogenetic Habitat‐Shifts Among Coral Reef Damselfishes.” Environmental Biology of Fishes 102, no. 9: 1201–1218. 10.1007/s10641-019-00903-5. [DOI] [Google Scholar]
- Kramer, M. J. , Bellwood O., Fulton C. J., and Bellwood D. R.. 2015. “Refining the Invertivore: Diversity and Specialisation in Fish Predation on Coral Reef Crustaceans.” Marine Biology 162, no. 9: 1779–1786. 10.1007/s00227-015-2710-0. [DOI] [Google Scholar]
- Leahy, S. M. , Russ G. R., and Abesamis R. A.. 2015. “Pelagic Larval Duration and Settlement Size of a Reef Fish Are Spatially Consistent, but Post‐Settlement Growth Varies at the Reef Scale.” Coral Reefs 34, no. 4: 1283–1296. 10.1007/s00338-015-1330-y. [DOI] [Google Scholar]
- Lecchini, D. , and Galzin R.. 2005. “Spatial Repartition and Ontogenetic Shifts in Habitat Use by Coral Reef Fishes (Moorea, French Polynesia).” Marine Biology 147, no. 1: 47–58. 10.1007/s00227-004-1543-z. [DOI] [Google Scholar]
- Lecchini, D. , Waqalevu V., Parmentier E., Radford C., and Banaigs B.. 2013. “Fish Larvae Prefer Coral Over Algal Water Cues: Implications of Coral Reef Degradation.” Marine Ecology Progress Series 475: 303–307. 10.3354/meps10094. [DOI] [Google Scholar]
- Leis, J. M. 1984. “Larval Fish Dispersal and the East Pacific Barrier.” Oceanographie Tropicale 19: 181–192. [Google Scholar]
- Leis, J. M. , Hay A. C., and Gaither M. R.. 2011. “Swimming Ability and Its Rapid Decrease at Settlement in Wrasse Larvae (Teleostei: Labridae).” Marine Biology 158: 1239–1246. 10.1007/s00227-011-1644-4. [DOI] [Google Scholar]
- Lenth, R. V. 2023. Emmeans: Estimated Marginal Means, Aka Least‐Squares Means. R Package Version 1.10.4. https://CRAN.R‐project.org/package=emmeans.
- Leu, M.‐Y. , Hsu Y.‐C., Tu Y.‐H., et al. 2022. “Natural Spawning, Early Development and First Successful Hatchery Production of the Bluestreak Cleaner Wrasse, Labroides dimidiatus (Valenciennes, 1839), With Application of an Inorganic Fertilization Method in Larviculture.” Aquaculture 553: 738056. 10.1016/j.aquaculture.2022.738056. [DOI] [Google Scholar]
- Leu, M.‐Y. , Meng P.‐J., Siong Tew K., Kuo J., and Hung C. C.. 2012. “Spawning and Development of Larvae and Juveniles of the Indian Ocean Oriental Sweetlips, Plectorhinchus vittatus (Linnaeus, 1758), in the Aquarium.” Journal of the World Aquaculture Society 43: 595–606. 10.1111/j.1749-7345.2012.00594.x. [DOI] [Google Scholar]
- Lewis, A. R. 1997. “Recruitment and Post‐Recruit Immigration Affect the Local Population Size of Coral Reef Fishes.” Coral Reefs 16, no. 3: 139–149. 10.1007/s003380050068. [DOI] [Google Scholar]
- Lewis, S. M. , and Wainwright P. C.. 1985. “Herbivore Abundance and Grazing Intensity on a Caribbean Coral Reef.” Journal of Experimental Marine Biology and Ecology 87, no. 3: 215–228. 10.1016/0022-0981(85)90206-0. [DOI] [Google Scholar]
- Lieske, E. , and Myers R.. 2001. Reef Fishes of the World Indo‐Pacific and Caribbean (Revised Edition). Periplus. [Google Scholar]
- Lin, Y. V. , Chen Y. L., de Palmas S., et al. 2024. “Rapid Shift in Benthic Assemblages Following Coral Bleaching at an Upper Mesophotic Habitat in Taiwan.” Marine Biodiversity 54, no. 3: 53. 10.1007/s12526-024-01445-5. [DOI] [Google Scholar]
- Lirman, D. 1994. “Ontogenetic Shifts in Habitat Preferences in the Three‐Spot Damselfish, Stegastes planifrons (Cuvier), in Roatan Island, Honduras.” Journal of Experimental Marine Biology and Ecology 180, no. 1: 71–81. 10.1016/0022-0981(94)90080-9. [DOI] [Google Scholar]
- Liu, C.‐H. E. , Ribas‐Deulofeu L., Wu M.‐H. M., Chang Y.‐J., and Denis V.. 2025. “Patterns of Reef Fish Energy Flow in a Transitional Zone.” Coral Reefs 44: 1573–1586. 10.1007/s00338-025-02725-7. [DOI] [Google Scholar]
- Lou, D. C. 1993. “Growth in Juvenile Scarus Rivulatus and Ctenochaetus binotatus: A Comparison of Families Scaridae and Acanthuridae.” Journal of Fish Biology 42, no. 1: 15–23. 10.1111/j.1095-8649.1993.tb00302.x. [DOI] [Google Scholar]
- MacNeil, M. A. , Graham N. A. J., Cinner J. E., et al. 2015. “Recovery Potential of the World's Coral Reef Fishes.” Nature 520, no. 7547: 341–344. 10.1038/nature14358. [DOI] [PubMed] [Google Scholar]
- Martinez Arbizu, P. 2020. pairwiseAdonis: Pairwise Multilevel Comparison Using Adonis (Version 0.4) [R]. https://github.com/pmartinezarbizu/pairwiseAdonis.
- Mattos, F. M. G. , Mulla A. J., Fong C.‐L., Lee C.‐H., Nozawa Y., and Lin T.‐H.. 2025. “Environmental and Acoustic Drivers of Fish Recruitment Along Degraded Coral Reefs.” Marine Environmental Research 211: 107461. 10.1016/j.marenvres.2025.107461. [DOI] [PubMed] [Google Scholar]
- McClanahan, T. R. 2022. “Coral Responses to Climate Change Exposure.” Environmental Research Letters 17, no. 7: 073001. 10.1088/1748-9326/ac7478. [DOI] [Google Scholar]
- Mccormick, M. , and Makey L.. 1997. “Post‐Settlement Transition in Coral Reef Fishes: Overlooked Complexity in Niche Shifts.” Marine Ecology Progress Series 153: 247–257. 10.3354/meps153247. [DOI] [Google Scholar]
- McGillycuddy, M. , Popovic G., Bolker B. M., and Warton D. I.. 2025. “Parsimoniously Fitting Large Multivariate Random Effects in glmmTMB.” Journal of Statistical Software 112: 1–19. 10.18637/jss.v112.i01. [DOI] [Google Scholar]
- Morais, J. , Morais R., Tebbett S. B., and Bellwood D. R.. 2022. “On the Fate of Dead Coral Colonies.” Functional Ecology 36, no. 12: 3148–3160. 10.1111/1365-2435.14182. [DOI] [Google Scholar]
- Morais, R. , and Bellwood D.. 2020. “Principles for Estimating Fish Productivity on Coral Reefs.” Coral Reefs 39: 1221–1231. 10.1007/s00338-020-01969-9. [DOI] [Google Scholar]
- Mouillot, D. , Bellwood D. R., Baraloto C., et al. 2013. “Rare Species Support Vulnerable Functions in High‐Diversity Ecosystems.” PLoS Biology 11, no. 5: e1001569. 10.1371/journal.pbio.1001569. [DOI] [PMC free article] [PubMed] [Google Scholar]
- Mouillot, D. , Villeger S., Parravicini V., et al. 2014. “Functional Over‐Redundancy and High Functional Vulnerability in Global Fish Faunas on Tropical Reefs.” Proceedings of the National Academy of Sciences 111, no. 38: 13757–13762. 10.1073/pnas.1317625111. [DOI] [PMC free article] [PubMed] [Google Scholar]
- Mulla, A. J. , Denis V., Lin C.‐H., Fong C.‐L., Shiu J.‐H., and Nozawa Y.. 2024. “Natural Coral Recovery Despite Negative Population Growth.” Ecology 105, no. 9: e4368. 10.1002/ecy.4368. [DOI] [PubMed] [Google Scholar]
- Mumby, P. J. 2006. “The Impact of Exploiting Grazers (scaridae) on the Dynamics of Caribbean Coral Reefs.” Ecological Applications 16, no. 2: 747–769. 10.1890/1051-0761(2006)016[0747:TIOEGS]2.0.CO;2. [DOI] [PubMed] [Google Scholar]
- Munday, P. L. 2004. “Competitive Coexistence of Coral‐Dwelling Fishes: The Lottery Hypothesis Revisited.” Ecology 85, no. 3: 623–628. 10.1890/03-3100. [DOI] [Google Scholar]
- Ogle, D. H. , Doll J. C., Wheeler A. P., and Dinno A.. 2025. FSA: Simple Fisheries Stock Assessment Methods (Version 0.9.6) R Package Version 0.9.6. https://CRAN.R‐project.org/package=FSA.
- Ohman, M. D. 1990. “The Demographic Benefits of Diel Vertical Migration by Zooplankton.” Ecological Monographs 60, no. 3: 257–281. 10.2307/1943058. [DOI] [Google Scholar]
- Oksanen, J. , Simpson G., Blanchet F., et al. 2024. Vegan: Community Ecology Package. R Package Version 2.6–8. https://CRAN.R‐project.org/package=vegan.
- Osuka, K. E. , Stewart B. D., Samoilys M., et al. 2022. “Depth and Habitat Are Important Drivers of Abundance for Predatory Reef Fish Off Pemba Island, Tanzania.” Marine Environmental Research 175: 105587. 10.1016/j.marenvres.2022.105587. [DOI] [PubMed] [Google Scholar]
- Paradis, E. , and Schliep K.. 2019. “Ape 5.0: An Environment for Modern Phylogenetics and Evolutionary Analyses in R.” Bioinformatics 35: 526–528. 10.1093/bioinformatics/bty633. [DOI] [PubMed] [Google Scholar]
- Patton, W. 1994. “Distribution and Ecology of Animals Associated With Branching Corals (Acropora Spp.) From the Great Barrier Reef, Australia.” Bulletin of Marine Science 55: 193–211. [Google Scholar]
- Pratchett, M. S. , Hoey A. S., Wilson S. K., Messmer V., and Graham N. A. J.. 2011. “Changes in Biodiversity and Functioning of Reef Fish Assemblages Following Coral Bleaching and Coral Loss.” Diversity 3, no. 3: 424–452. 10.3390/d3030424. [DOI] [Google Scholar]
- Pratchett, M. S. , Wilson S. K., and Baird A. H.. 2006. “Declines in the Abundance of Chaetodon Butterflyfishes Following Extensive Coral Depletion.” Journal of Fish Biology 69, no. 5: 1269–1280. 10.1111/j.1095-8649.2006.01161.x. [DOI] [Google Scholar]
- Quimbayo, J. P. , Dias M. S., Kulbicki M., et al. 2019. “Determinants of Reef Fish Assemblages in Tropical Oceanic Islands.” Ecography 42, no. 1: 77–87. 10.1111/ecog.03506. [DOI] [Google Scholar]
- R Core Team . 2024. _R: A Language and Environment for Statistical Computing. R Foundation for Statistical Computing. https://www.R‐project.org/. [Google Scholar]
- Russ, G. R. , Rizzari J. R., Abesamis R. A., and Alcala A. C.. 2020. “Coral Cover a Stronger Driver of Reef Fish Trophic Biomass Than Fishing.” Ecological Applications 31, no. 1: e02224. 10.1002/eap.2224. [DOI] [PMC free article] [PubMed] [Google Scholar]
- Sadovy, Y. , Kulbicki M., Labrosse P., Letourneur Y., Lokani P., and Donaldson T. J.. 2003. “The Humphead Wrasse, Cheilinus undulatus: Synopsis of a Threatened and Poorly Known Giant Coral Reef Fish.” Reviews in Fish Biology and Fisheries 13, no. 3: 327–364. 10.1023/b:rfbf.0000033122.90679.97. [DOI] [Google Scholar]
- Sano, M. , Shimizu M., and Nose Y.. 1984. “Changes in Structure of Coral Reef Fish Communities by Destruction of Hermatypic Corals: Observational and Experimental Views.” Pacific Science 38, no. 1: 51–79. http://hdl.handle.net/10125/755. [Google Scholar]
- Schroeder, R. E. 1987. “Effects of Patch Reef Size and Isolation on Coral Reef Fish Recruitment.” Bulletin of Marine Science 41, no. 2: 441–451. [Google Scholar]
- Siqueira, A. C. , Morais R. A., Bellwood D. R., and Cowman P. F.. 2021. “Planktivores as Trophic Drivers of Global Coral Reef Fish Diversity Patterns.” Proceedings of the National Academy of Sciences of the United States of America 118, no. 9: e2019404118. 10.1073/pnas.2019404118. [DOI] [PMC free article] [PubMed] [Google Scholar]
- Siqueira, A. C. , Muruga P., and Bellwood D. R.. 2023. “On the Evolution of Fish–Coral Interactions.” Ecology Letters 26, no. 8: 1348–1358. 10.1111/ele.14245. [DOI] [PubMed] [Google Scholar]
- Sponaugle, S. 2015. “Recruitment of Coral Reef Fishes: Linkages Across Stages.” In Ecology of Fishes on Coral Reefs, edited by Mora C., 28–33. Cambridge University Press. 10.1017/CBO9781316105412.005. [DOI] [Google Scholar]
- Steele, M. A. 1999. “Effects of Shelter and Predators on Reef Fishes.” Journal of Experimental Marine Biology and Ecology 233, no. 1: 65–79. 10.1016/S0022-0981(98)00127-0. [DOI] [Google Scholar]
- Stier, A. C. , and Leray M.. 2014. “Predators Alter Community Organization of Coral Reef Cryptofauna and Reduce Abundance of Coral Mutualists.” Coral Reefs 33, no. 1: 181–191. 10.1007/s00338-013-1077-2. [DOI] [Google Scholar]
- Streit, R. P. , Hemingson C. R., Cumming G. S., and Bellwood D. R.. 2021. “How Flexible Are Habitat Specialists? Short‐Term Space Use in Obligate Coral‐Dwelling Damselfishes.” Reviews in Fish Biology and Fisheries 31, no. 2: 381–398. 10.1007/s11160-021-09646-y. [DOI] [Google Scholar]
- Strona, G. , Lafferty K. D., Fattorini S., et al. 2021. “Global Tropical Reef Fish Richness Could Decline by Around Half if Corals Are Lost.” Proceedings of the Royal Society B: Biological Sciences 288, no. 1953: 20210274. 10.1098/rspb.2021.0274. [DOI] [PMC free article] [PubMed] [Google Scholar]
- Suzuki, S. , Kawai T., and Sakamaki T.. 2018. “Combination of Trophic Group Habitat Preferences Determines Coral Reef Fish Assemblages.” Marine Ecology Progress Series 586: 141–154. 10.3354/meps12378. [DOI] [Google Scholar]
- Syms, C. , and Jones G. P.. 2000. “Disturbance, Habitat Structure, and the Dynamics of a Coral‐Reef Fish Community.” Ecology 81, no. 10: 2714–2729. 10.1890/0012-9658(2000)081[2714:DHSATD]2.0.CO;2. [DOI] [Google Scholar]
- Tebbett, S. B. , Bellwood D. R., Gahan J., Ng I., and Siqueira A. C.. 2025. “Cross‐Habitat Patterns of Sediment Transport and Release by Surgeonfishes.” Coral Reefs 44, no. 1: 63–75. 10.1007/s00338-024-02586-6. [DOI] [Google Scholar]
- Tebbett, S. B. , Yan H. F., Lutzenkirchen L. L., Siqueira A. C., and Bellwood D. R.. 2024. “Global Patterns of Herbivorous Reef Fish Productivity: The Role of Prionurus laticlavius in the Galápagos.” Coral Reefs 43, no. 2: 299–305. 10.1007/s00338-024-02473-0. [DOI] [Google Scholar]
- Thorrold, S. R. 1993. “Meso‐Scale Patterns in the Distribution of Larval Fishes Across the Central Great Barrier Reef Lagoon and Relationships With Environmental Variability.” Ph.D. Thesis, James Cook University. http://eprints.jcu.edu.au/27240.
- Tolimieri, N. 1995. “Effects of Microhabitat Characteristics on the Settlement and Recruitment of a Coral Reef Fish at Two Spatial Scales.” Oecologia 102, no. 1: 52–63. 10.1007/BF00333310. [DOI] [PubMed] [Google Scholar]
- Waldner, R. E. , and Robertson D. R.. 1980. “Patterns of Habitat Partitioning by Eight Species of Territorial Caribbean Damselfishes (Pisces: Pomacentridae).” Bulletin of Marine Science 30, no. 1: 171–186. [Google Scholar]
- Wellington, G. M. , and Victor B. C.. 1989. “Planktonic Larval Duration of One Hundred Species of Pacific and Atlantic Damselfishes (Pomacentridae).” Marine Biology 101, no. 4: 557–567. 10.1007/BF00541659. [DOI] [Google Scholar]
- Wilson, S. K. , Burgess S. C., Cheal A. J., et al. 2008. “Habitat Utilization by Coral Reef Fish: Implications for Specialists vs. Generalists in a Changing Environment.” Journal of Animal Ecology 77, no. 2: 220–228. 10.1111/j.1365-2656.2007.01341.x. [DOI] [PubMed] [Google Scholar]
- Wilson, S. K. , Graham N. A. J., Holmes T. H., MacNeil M. A., and Ryan N. M.. 2018. “Visual Versus Video Methods for Estimating Reef Fish Biomass.” Ecological Indicators 85: 146–152. 10.1016/j.ecolind.2017.10.038. [DOI] [Google Scholar]
- Wilson, S. K. , Graham N. A. J., Pratchett M. S., Jones G. P., and Polunin N. V. C.. 2006. “Multiple Disturbances and the Global Degradation of Coral Reefs: Are Reef Fishes at Risk or Resilient?” Global Change Biology 12, no. 11: 2220–2234. 10.1111/j.1365-2486.2006.01252.x. [DOI] [Google Scholar]
- Wismer, S. , Tebbett S. B., Streit R. P., and Bellwood D. R.. 2019. “Young Fishes Persist Despite Coral Loss on the Great Barrier Reef.” Communications Biology 2: 456. 10.1038/s42003-019-0703-0. [DOI] [PMC free article] [PubMed] [Google Scholar]
- Yang, T.‐L. , Lee S., Tsai P.‐Y., Tan C.‐J., and Fan T.‐Y.. 2017. “Spatial Variation in the Benthic Community Structure of Coral Reefs of Hsiaoliuchiu, Taiwan.” Platax 14: 62–81. [Google Scholar]
- Yap, H. T. , Montebon A. R. F., and Dizon R. M.. 1994. “Energy Flow and Seasonality in a Tropical Coral Reef Flat.” Marine Ecology Progress Series 103, no. 1/2: 35–43. [Google Scholar]
Associated Data
This section collects any data citations, data availability statements, or supplementary materials included in this article.
Data Availability Statement
The data supporting the findings of this study are openly available in the depositar repository (https://pid.depositar.io/ark:37281/k5f4j959b).