

Abstract
The quorum sensing system allows bacteria to sense their cell density and initiate an altered pattern of gene expression after a sufficient quorum of cells has accumulated. In Agrobacterium tumefaciens, quorum sensing controls conjugal transfer of the tumour- inducing plasmid, responsible for plant crown gall disease. The core components of this system are the transcriptional regulator TraR and its inducing ligand N-(3-oxo-octanoyl)-l-homoserine lactone. This complex binds DNA and activates gene expression. We have determined the crystal structure of TraR in complex with its autoinducer and target DNA (PDB code 1h0m). The protein is dimeric, with each monomer composed of an N-terminal domain, which binds the ligand in an enclosed cavity far from the dimerization region, and a C-terminal domain, which binds DNA via a helix–turn–helix motif. The structure reveals an asymmetric homodimer, with one monomer longer than the other. The N-terminal domain resembles GAF/PAS domains, normally fused to catalytic signalling domains. In TraR, the gene fusion is between a GAF/PAS domain and a DNA-binding domain, resulting in a specific transcriptional regulator involved in quorum sensing.
Keywords: DNA binding protein/GAF-PAS domains/homoserine lactone/quorum sensing/TraR
Introduction
Quorum sensing is a cell density-dependent process that enables bacterial cells to regulate the expression of specific genes in response to local changes in cell-population density and allows bacteria the means to coordinate their activities in order to function as a multicellular unit (Miller and Bassler, 2001). To facilitate this process, bacteria constitutively produce and release small signal molecules called autoinducers, which increase in concentration as a function of cell density. As the density of cells producing a specific autoinducer increases, so will the concentration of the autoinducer, and at a minimal threshold stimulatory concentration, the autoinducer activates a transcriptional activator which leads to an alteration in gene expression. This mechanism is used by both Gram-negative and Gram-positive bacteria to regulate a variety of physiological functions, including bioluminescence, virulence factor expression, antibiotic production and biofilm development (Miller and Bassler, 2001). Among Gram-negative bacteria, quorum sensing is mediated by an acyl-homoserine lactone signal molecule, whereas Gram-positive bacteria use peptides that mimic the actions of acyl-homoserine lactones (Bassler, 2002).
The first ‘quorum sensor’ to be described fully, that of the marine bacterium Vibrio fischeri, regulates bioluminescence (lux) gene expression in the light organs of marine fish and cephalopods (Nelson and Hastings, 1979; Choi and Greenberg, 1992). This regulatory system is composed of the activator LuxR, a cis-acting DNA inverted repeat called the lux box, and the signal molecule N-(3-oxo-hexanoyl)-l-homoserine lactone. The signal, which is synthesized by the bacterial LuxI protein, diffuses freely between the cellular and external environment, and complexes with LuxR protein only at high population density (Fuqua et al., 1994). The signal–LuxR complex then binds to an operator sequence in the lux operon to stimulate transcription of the luciferase structural genes in a positive feedback loop. Quorum sensing circuits, which resemble the canonical LuxI/LuxR-type system, have been identified in >25 species of Gram-negative bacteria (Miller and Bassler, 2001).
Among the bacteria containing such a system is Agrobacterium tumefaciens, a plant pathogen that is best known for genetically transforming plants, thereby inducing crown gall tumours on susceptible hosts. Pathogenesis involves the transfer of the Ti plasmid to the host cell nucleus and the subsequent transcription of opines and phytohormones, necessary for bacterial cell growth and cellular proliferation, respectively (Farrand, 1998). Inter bacterial conjugal transfer of the Ti plasmid is positively regulated by two proteins: TraI, which synthesizes the autoinducer N-(3-oxo-octanoyl)-l-homoserine lactone; and TraR, which is an autoinducer-dependent transcriptional activator of plasmid conjugal transfer genes (Zhu et al., 2000). The complex of TraR with the N-(3-oxo-octanoyl)-l-homoserine lactone, called Agrobacterium autoinducer or AAI, binds to promoter elements, called tra boxes, upstream of at least five different tra operons on the Ti plasmid.
By homology to LuxR, TraR can be divided in two functional domains (Fuqua and Greenberg, 1998). The C-terminal region of the protein contains a predicted helix–turn–helix (HTH) motif that has been implicated in DNA binding for both TraR and LuxR (Luo and Farrand, 1999; Egland and Greenberg, 2001). The overexpression of this fragment in vivo led to the activation of transcription (Choi and Greenberg., 1991). The N-terminal half of the LuxR protein shows conserved residues known to be required for N-(3-oxo-octanoyl)-l-homoserine lactone binding (Hanzelka and Greenberg, 1995). The putative AAI binding site in TraR has yet to be determined. The role of the autoinducer on TraR regulation has been studied in bacteria grown in the presence of AAI. Purification of TraR–AAI complexes revealed that the protein is dimeric, with one AAI bound for each monomer in an extremely stable complex that is only partially dissociable with detergent treatment (Zhu and Winans, 1999). The DNA-binding site of TraR has been localized to an 18-bp palindromic recognition element called a tra box, and activates transcription of the traA and traC promoters from this site on supercoiled DNA (Zhu and Winans, 1999). It has also been shown that autoinducer protects AAI from endogenous proteases as well as trypsin in purified systems, which suggests its role as a stabilizer for the folding of nascent TraR protein into its mature tertiary structure (Zhu and Winans, 2001). In contrast, another study suggests the possible role of AAI as a signal which releases membrane-bound TraR into the cytoplasm, thereby inducing dimerization of TraR (Qin et al., 2000). The exact role of the signal molecule in transcriptional regulation by TraR therefore remains to be determined.
Here we report the crystal structure of the quorum sensing transcriptional regulator TraR, bound to its specific DNA recognition site (TraBox) and to its autoinducer molecule (AAI; Figure 1A). The structure of this ternary complex, [TraR/AAI]2/TraBox, reveals one completely enclosed AAI molecule in each N-terminal ligand-binding domain. The AAI is not directly involved in dimerization. The C-terminal DNA-binding domain binds the DNA duplex with the typical HTH motif. In addition, the structure reveals an asymmetric dimer with a different arrangement of the N- and C-terminal domains relative to each other, resulting in one monomer being more elongated than the other. The N-terminal ligand-binding domain has structural similarities with the ubiquitous GAF/PAS domains, which show considerable evolutionary mobility and are involved in the generation of many lineage-specific domain architectures in prokaryotic and eukaryotic cells (Anantharaman et al., 2001). The TraR structure suggests that a gene fusion between a GAF/PAS domain and a DNA-binding domain resulted in a transcriptional regulator with a central function in quorum sensing.
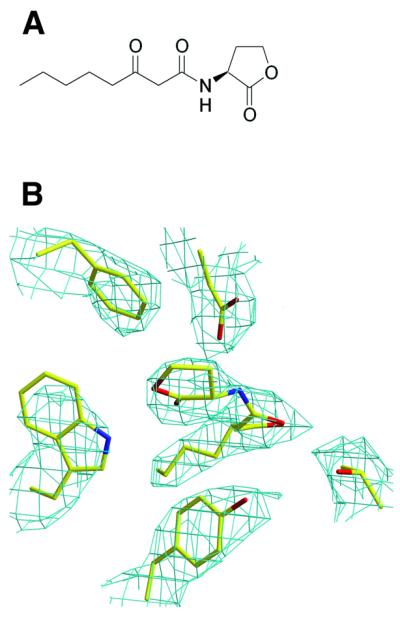
Fig. 1. (A) Chemical structure of N-(3-oxo-octanoyl)-l-homoserine lactone, the A.tumefaciens autoinducer (AAI). (B) Experimental electron density map (density-modified) contoured at 1σ around the AAI and showing also a portion of the protein density in the vicinity of the ligand. The AAI as well as protein residues are shown in stick representation. Oxygen, carbon and nitrogen are coloured red, yellow and blue, respectively.
Results
Overall structure
The crystal structure contains two crystallographically independent ternary complexes in the asymmetric unit. The two DNA helices span and define the whole asymmetric unit along the c-axis of the crystal. The functional unit is formed by the duplex DNA, the tra box sequence of 18 bp, and one [TraR/AAI]2 dimer (Figure 2). The two complexes present in the asymmetric unit consist of one TraR dimer (A:B) bound to DNA duplex (E:F), and one TraR dimer (C:D) bound to DNA duplex (G:H). The two dimers superimpose with a root mean square deviation (r.m.s.d.) between Cα atoms of 0.63 Å, showing no relevant differences. The interactions of each of the two dimers with their DNA sites are virtually the same; in fact, if the dimer AB is superimposed along with its DNA on the C:D dimer, the r.m.s.d. between DNA corresponding atoms is 0.615 Å. Furthermore, monomer A is structurally equivalent to monomer C (r.m.s.d. between Cα atoms, 0.52 Å), while monomer B is equivalent to monomer D (r.m.s.d. between Cα atoms, 0.55 Å). The A:B dimer contacts the C:D dimer mainly via interactions between molecules B and C, and by base stacking between the first base pair of the DNA duplex E:F and the last base pair of the DNA duplex G:H. Therefore, the structure description will focus on only the [TraR/AAI]2/TraBox complex formed by the dimer A:B and the DNA duplex E:F. The monomer is divided in an N-terminal ligand-binding domain (amino acids 1–162), which binds the AAI, and a DNA-binding domain at the C-terminus of the protein (amino acids 176–234).
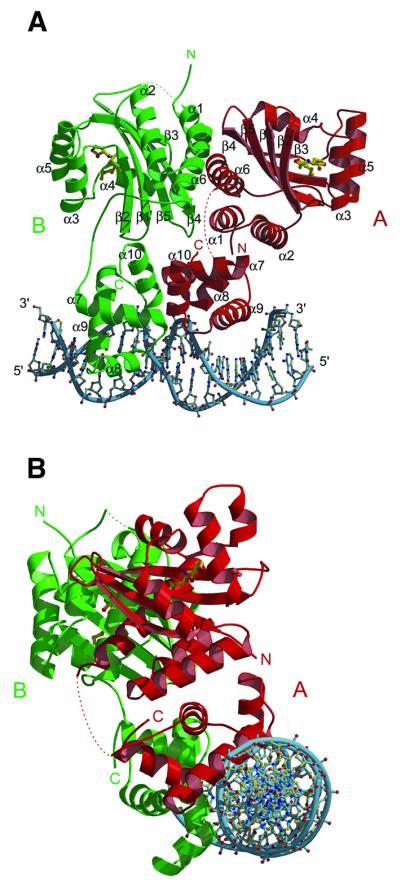
Fig. 2. Ribbon diagram of the ternary complex [TraR/AAI]2/TraBox. The two subunits, A and B, forming the asymmetric homodimer are shown in red and green, respectively. Disordered loops between α6 and α7 in monomer A, and β5 and α6 in monomer B are shown as dotted lines. Phosphates of DNA are shown as a continuous sky-blue coil. Oxygen, carbon and nitrogen are coloured red, yellow, and blue, respectively. Views in (A) are shown along the crystallographic a-axis, and along the DNA axis in (B).
The two ligand-binding domains of the dimer are related by a 2-fold non-crystallographic symmetry (NCS) axis, which is distinct from the 2-fold NCS of the two DNA-binding domains, resulting in an overall asymmetry of the dimer, with monomer B being more elongated than monomer A. Such an arrangement is made possible by the presence of a linker (amino acids 163–175) connecting the two domains, which adopts two different conformations in monomers A and B, respectively (Figure 2A). As a direct consequence, the N-terminal region (amino acids 1–32) of monomer A is deeply inserted between the DNA- and the ligand-binding domains, while in monomer B the same region is located externally, facing symmetry-related molecules. Residues 166–169 of the linker connecting the ligand- and DNA-binding domain of monomer A (and C) are disordered and shown as dotted lines (Figure 2). The dimer asymmetry may have functional implications, especially considering the charge distribution on the surface of the dimer. A long and continuous basic region, formed by both DNA-binding domains, is present where the DNA duplex binds (Figure 3A). Furthermore, an extensive positively charged patch, formed by several C-terminal residues at the interface between the two DNA-binding domains, is solvent exposed (Figure 3B). This could be a recognition site either for proteins involved in the activation of the transcription machinery or for another A.tumefaciens protein, TraM, which has been shown to be an anti-activator of TraR (Luo et al., 2000; Swiderska et al., 2001). Yeast two-hybrid studies and far-western analysis of TraM binding to immobilized TraR have suggested that monomeric TraM associates with a region in the C-terminal half of dimeric TraR (Luo et al., 2000; Swiderska et al., 2001).
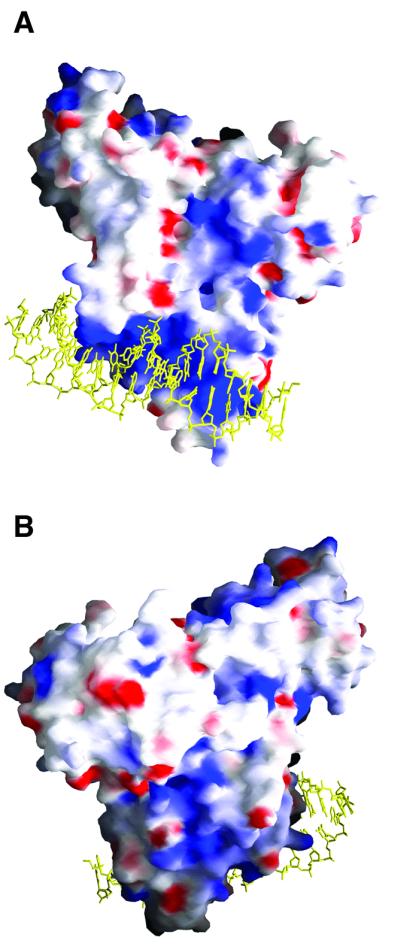
Fig. 3. Electrostatic surface representation of TraR in the [TraR/AAI]2/TraBox complex, with blue and red regions indicating basic and acidic regions, respectively. The atoms of the bound DNA molecule are coloured yellow and two orientations of the complex are displayed. (A) Orientation along the a-axis of the [TraR/AAI]2/TraBox complex. Note the highly basic nature of the DNA-binding domain. (B) The view is that of (A), rotated 180° around the b-axis. Note the solvent- exposed basic patch, formed by several C-terminal residues at the interface between the two DNA-binding domains.
Ligand-binding domain
The ligand-binding domain (amino acids 1–162) consists of a five-stranded antiparallel β-sheet, with strand order 2-1-5-4-3, packed against three α-helices on each side. The AAI is deeply inserted between the β-sheet and three helices (Figure 4A). The N-terminal portion of the sequence (residues 1–36), together with residues 134– 162, form one outer layer of the structure, consisting of three α-helices: α1 (residues 3–12), α2 (residues 17–32) and α6 (residues 145–162). The opposite outer layer of the structure consists of three short α-helices: α3 (residues 54–64), α4 (residues 70–79) and α5 (residues 97–107). The whole domain is quite compact and through the long helix α6 establishes hydrophobic interactions with the corresponding helix of the other monomer (Figure 2A). Additional interactions occur between the last part of helix α1 and the turn connecting strands β4 and β5 of the other monomer. The dimer interface of the ligand-binding domain (Figure 2A) buries ∼2000 Å2 of molecular surface area as compared with both monomers in isolation.
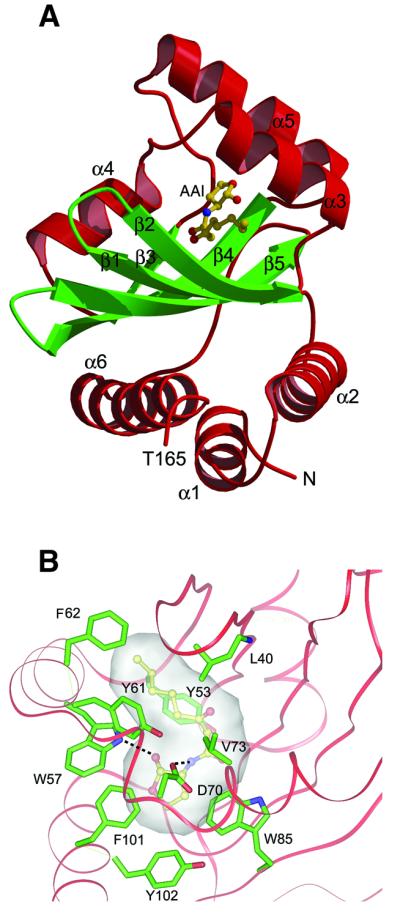
Fig. 4. Structure of the ligand-binding domain. (A) Ribbon diagram of the ligand-binding domain. The α-helices are shown in red and the β-strands in green. The AAI is shown in a ball-and-stick representation. Oxygen, carbon and nitrogen are coloured red, yellow and blue, respectively. (B) Close-up view of the AAI binding site. The AAI is completely embedded in a narrow cavity, lined by a cluster of hydrophobic residues. The AAI is shown in ball-and-stick representation. Oxygen, carbon and nitrogen are coloured red, yellow and blue, respectively. Protein side chains are shown in stick representation, with carbon atoms coloured green. The protein backbone is shown as a red coil. The cavity, accommodating the AAI, is represented as a transparent surface. Hydrogen bonds are shown as black dotted lines.
The AAI is not directly involved in dimerization and, surprisingly, is completely embedded in an enclosed cavity, between the five-stranded antiparallel β-sheet and helices α3, α4 and α5 (Figure 4A), without any solvent contact. This cavity is formed by a cluster of aromatic and hydrophobic residues, reflecting the rather hydrophobic nature of the AAI molecule (Figure 4B). Furthermore, the AAI is stabilized by two hydrogen bonds between the nitrogen preceeding its acyl moiety and the ε oxygen of the buried Asp70, and between the carbonyl oxygen of the lactone moiety and the ε nitrogen of Trp57. The homoserine lactone moiety of the autoinducer sits in a cavity lined by residues Trp57, Asp70, Val72, Val73, Trp85, Phe101, Tyr102, Ala105 and Ile110. The acyl moiety is stabilized further by hydrophobic interactions with Tyr53, Leu40, Tyr61 and Phe62. Polar contacts among the two carbonyls of the acyl moiety and side chains of Tyr53 and Thr129 are possible. Phe62 is also responsible for the occlusion of the discrete cavity opening at the acylic side of the ligand (Figure 4B). Therefore, access to the ligand site appears to be completely precluded to the solvent.
A lactone moiety is invariably present in all the autoinducers of the LuxR family of cell-density-responsive transcriptional regulators (Fuqua et al., 1994). It should be emphasized that the two residues involved in polar interactions (Asp70 and Trp57) with the lactone moiety and most of the residues involved in the lining of the homoserine lactone cavity are strictly conserved in LuxR-type proteins (Figure 5), with the exception of Phe101 and Tyr102. Among residues interacting with the acyl moiety, only Tyr61 is strictly conserved, according to the variability of the length of the acyl group and diversity in LuxR-type proteins. The conservation of these crucial residues along a diffuse region of the sequence leads to the prediction of the structural conservation of the ligand-binding sites (the five-stranded antiparallel β-sheet and helices α3, α4 and α5) among the whole LuxR family.

Fig. 5. Multiple sequence alignment of four members of the LuxR family of transcriptional regulators. TraR, LuxR, LasR and ExpR (SWISS-PROT P33905, P12746, P25084 and Q47189, respectively) are transcriptional regulators involved in quorum sensing from A.tumefaciens, V.fischeri, Pseudomonas aeruginosa and Erwinia carotovora, respectively. Identical and conserved residues are denoted by a red vertical bar and a blue vertical box, respectively. TraR secondary structure and residue numbering are shown above the alignment.
Structural comparison of the ligand-binding domain
Despite a lack of substantial sequence homology to any previously determined structure, the TraR ligand-binding domain (residues 1–162) reveals a number of unexpected similarities to other proteins in its three-dimensional structure (Figure 6). The non-redundant protein structure database was searched with MATRAS (Kawabata and Nishikawa, 2000) and DALI (Holm and Sander, 1993). The TraR ligand-binding domain has structural similarity to the YKG9 GAF domain [Ho et al., 2000; Protein Data Bank (PDB) entry 1F5M, r.m.s.d. between Cα atoms 3.2 Å, for 131 residues out of 162, sequence identity 11%]. It also shares similarity to the PAS domain of several proteins, like that of the photoactive yellow protein (Borgstahl et al., 1995; PDB entry 3PYP, r.m.s.d. between Cα atoms 2.9 Å, for 83 residues out of 162, sequence identity 6%).

Fig. 6. Structural similarity between (A) the TraR ligand-binding domain and (B) the YKG9 GAF domain (Ho et al., 2000), (C) the TraR ligand-binding domain and (D) the photoactive yellow protein, with its covalently bound chromophore, a p-hydroxycinnamoyl anion (Borgstahl et al., 1995). Regions that can be superimposed within 3.2 Å (Cα atoms), with GAF and PAS domains, are coloured in green and red, respectively.
GAF domains are ubiquitous motifs present in cGMP-regulated cyclic nucleotide phospho-diesterases, certain adenylyl cyclases, the bacterial transcription factor FhlA, and hundreds of other signalling and sensory proteins. Moreover, the GAF domain-containing proteins are linked in their evolution to the equally ubiquitous PAS domain-containing proteins (Anantharaman et al., 2001). The common theme among both classes is the binding, either covalent or non-covalent, of a remarkably diverse set of small regulatory molecules. The structure of the TraR ligand-binding domain complexed to its signal molecule, being a representative of the LuxR-type protein family, allows us to include this family in the large class of proteins containing GAF/PAS domains. In addition, the structure reveals the recruitment of this ancient and ubiquitous domain as the module responsible for pheromone recognition in the acyl-homoserine lactone-mediated bacterial quorum sensing regulator.
DNA-binding domain
The DNA-binding domain is located at the C-terminus of the protein (amino acids 176–234; Figure 2A) and comprises four α-helices, α7 (residues 176–188), α8 (residues 191–198), α9 (residues 203–217) and α10 (residues 223–230). In monomer A, this domain makes polar contacts with the N-terminal region of the ligand-binding domain (residues 1–31), mainly with residues from helix α7, from the last part of helix α8 and with C-terminal residues 232–234. In monomer B, no contacts are observed between the two domains (Figure 2A).
The HTH motif is formed by helices α8 and α9, which corresponds to the predicted motif based on sequence alignment and structural similarity (Figure 2A). The closest structural similarity to the TraR DNA-binding domain, calculated using MATRAS and DALI, is to the small DNA-binding protein GerE, which regulates gene transcription in Bacillus subtilis (Ducros et al., 2001). The two structures reveal a striking structural homology and their Cα atoms superimpose with an r.m.s.d. of 0.9 Å (for 59 residues out of 59). They share 20% sequence identity, within the DNA-binding domain of TraR. In addition, this domain superimposes with the C-terminal DNA-binding domain of the Escherichia coli response regulator Narl (Baikalov et al., 1998) with an r.m.s.d. of 1.8 Å (for 59 residues out of 59, 20% sequence identity).
In TraR, the structure of the HTH motif is supported by a core of hydrophobic residues, around which pack the two HTH helices, α8 (‘scaffold’) and α9 (‘recognition’) (Figure 2A). The helices are amphipathic with the hydrophobic residues oriented towards the bundle. There are tight turns mediated by glycine residues between helices α7 and α8, and between α8 and α9. Helix α7 is also tethered to α9 by a buried salt-bridge between Glu178 and Arg215, which is a feature conserved in a variety of HTH-containing proteins. The salt-bridge has been shown to be an important determinant of the relative orientation of the scaffold and recognition helices, also conferring additional stability to the fold (Pervushin et al., 1996). The DNA-binding domain exists as a dimer in the crystal (Figure 2). The predominantly apolar dimer interface is composed of residues from the C-terminal helix of each monomer, α10 (Ala222, Ala226, Thr225 and Ile229). Approximately 600 Å2 of each DNA-binding domain is buried upon dimer formation. The same region mediates the dimerization in the structurally homologous protein GerE, which exists in solution as a dimer (Ducros et al., 2001), suggesting that the dimerization of TraR DNA-binding domains also occurs in solution, and not as an induced fit for the effect of the DNA binding. It is likely that the dimeric DNA-binding domain of TraR is relatively independent of the dimeric ligand-binding domain, due to the presence of the long linker connecting the two dimeric domains. In solution, the flexibility of this linker could confer a relative freedom of movement to the dimeric ligand-binding domains with respect to the dimeric DNA-binding domains. This could well explain the failure of our previous attempts to crystallize the binary complex [TraR/AAI]2.
DNA-binding site
The specific DNA sequence recognized by TraR is an 18-bp duplex, referred to as TraBox, which has a perfect dyad symmetry (Figure 7A), resulting in a perfect identity of the two halves of the sequence. The DNA structure adopts a B-form DNA-like conformation (Figure 2A). It is slightly more tightly wound and shows an average rise of 3.4 Å. There are, however, deviations from a B-DNA-like conformation: most striking is an overall bend of the DNA axis of 30°, to adapt its conformation to the contact surface of the protein (Figure 3A).

Fig. 7. DNA recognition by the TraR protein. (A) Schematic showing TraR–TraBox contacts. The bases are labelled and coloured according to the symmetry of the DNA sequence. The dyad axis is in black. A grey dotted line separates the DNA interactions with monomer A (at the top) and monomer B (at the bottom). Polar interactions are indicated by red rectangles and arrows, while hydrophobic contacts are shown as blue rectangles. (B) Close-up view of the polar interactions in the major groove of the DNA. Protein side chains and DNA bases are shown in stick representation. Oxygen, carbon, nitrogen and phosphate are coloured red, yellow, blue and orange, respectively. Hydrogen bonds are shown as black dotted lines.
The [TraR/AAI]2/TraBox structure reveals that the DNA-binding site of TraR forms a dimer that can fix two binding sites present on TraBox. The docking on the DNA of the two DNA-binding domains is symmetric. If the DNA-binding domain of monomer A is superimposed along with its DNA (a half of TraBox) on the DNA-binding domain of monomer B, the r.m.s.d. between corresponding DNA atoms of the two halves of TraBox is 0.68 Å (excluding the two external DNA bases, not involved in the protein docking). A continuous positively charged patch (Figure 3A) enables a TraR dimer to hold a DNA duplex and put the two α9 recognition helices into the two major grooves, as observed in many prokaryotic HTH-containing proteins (Luisi, 1995). Both recognition helices lie in the major groove of the DNA, perpendicular to the DNA axis with inverted polarity (Figure 2A). As expected for a dimer interacting with a sequence displaying perfect dyad symmetry, interactions are virtually the same in the two halves of the DNA. Each TraR monomer interacts with DNA, mainly through residues from helix α9 (Figure 7), and establishes five direct contacts with the major groove of the DNA. Considering monomer A, side chains of Arg206 and Arg210 make base-specific interactions, hydrogen-bonding with bases G5 and T4 on the F strand, respectively. The side chain of Asn203 forms polar contacts with the phosphate group of base T4 on the F strand. In addition, side chains of Val207 and Met213 form hydrophobic interactions with the backbone sugar of base G3 on the F strand and base T12 on the E strand, respectively. Additional interactions are provided by residues from helix α8. The backbone amide of Met191 forms polar contacts with the phosphate group of base C11 on the E strand, while the side chain of Met191 and Thr190 form hydrophobic interactions with the backbone sugar of base C11 on the E strand. Moreover, the backbone amide of Lys221, from helix α10, forms a polar contact with the phosphate group of base T12 on the E strand. Monomer B shows the same pattern of interactions with the complementary DNA strands, by virtue of the dyad symmetry (Figure 7A).
The pattern of interactions described indicates clearly that bases 11 and 12 play key roles in the non-specific recognition and accommodation of the DNA duplex by the TraR dimer. The sequence specificity is guaranteed by the presence of two neighbouring arginine residues (Arg206 and Arg210) that can interact specifically with bases G5 and T4 (Figure 7B), in agreement with the evidence that prokaryotic HTH-containing proteins often interact with the major groove through an Arg/Lys residue (Suzuki, 1993). Furthermore, the dimeric character of the DNA-binding domain, concomitant with the dyad symmetry of TraBox, establishes a remarkable structural compatibility between the protein and the DNA sequence. For instance, the addition of four nucleotides at the centre of the dyad symmetry (thus increasing the distance between the two DNA-binding sites and placing them on opposite helical faces) abolishes detectable TraR binding (Zhu and Winans, 1999).
Discussion
The LuxR family of transcriptional regulators requires an acyl-homoserine lactone signal molecule to control the regulation of gene expression in response to fluctuations in cell-population density by a mechanism called quorum sensing. Such regulation requires at least three components: a transcription factor, a diffusible signal molecule and a cis-acting recognition site located in the promoter region of the target gene. The crystal structure of the ternary complex [TraR/AAI]2/TraBox, besides being the structural example of this family of transcriptional regulators, represents a snapshot of the interaction among all these elements, giving us an overview of the whole paradigm.
The key finding is that, surprisingly, the signal molecule, N-(3-oxo-octanoyl)-l-homoserine lactone (AAI), is completely embedded into a narrow cavity of ∼200 Å3, formed by a cluster of hydrophobic and aromatic residues, without any possible solvent contact (Figure 4B). In addition, the presence of a completely buried aspartate residue (Asp70) in this cavity, which stabilizes the binding of the pheromone via a hydrogen bond, suggests the key role of the autoinducer in the correct folding of the nascent TraR protein and agrees with results from previous biochemical studies (Zhu and Winans, 2001). Therefore, a model in which AAI binds to an already folded TraR monomer, as proposed by Qin et al. (2000), is difficult to visualize from the structure determined in our studies. It is most likely that the accumulation of the pheromone in the environment, and its subsequent diffusion into bacterial cells, leads to the stabilization of the nascent TraR, which is otherwise rapidly degraded by proteases (Zhu and Winans, 2001). The correct folding of TraR, mediated by the autoinducer, results in the exposure of the hydrophobic face of the long helix α6 (residues 145–162), thus resulting in dimerization of the ligand-binding domains (Figure 2A). Dimerization at the DNA-binding domain does not appear to be correlated with the dimerization of the ligand-binding domains, induced by the pheromone. However, the dimeric interface of the DNA-binding domains is an indispensable requirement for the binding of TraR to its DNA target sequence, tra box, which contains a perfect dyad symmetry. This could well explain the mechanism of inhibition of TraR by TrlR, a truncated protein homologue of TraR, which contains sequences necessary for dimerization but lacks the HTH DNA-binding motif (Zhu and Winans, 1998; Chai et al., 2001). TrlR inhibits TraR through formation of inactive heterodimers. In this scenario, the role of the autoinducer seems to be that of guiding the folding and subsequent formation of stable TraR dimers, which become protease resistant (Zhu and Winans, 2001) and therefore bind tra box operators via their dimeric DNA-binding domains.
Furthermore, the strict conservation of most of the residues involved in autoinducer binding, as well as the residues forming the C-terminal HTH DNA- binding domain, makes this structure a representative model of the whole LuxR family of transcriptional regulators.
Comparison with previously determined structures suggests that TraR is a protein that has evolved through a process of gene fusion. The ligand-binding domain shares similarity with the GAF and PAS domains of several proteins (Figure 6). These intracellular small-molecule-binding modules are ubiquitous ancestral domains and are present in numerous distinct proteins with various enzymatic, transport and signal-transducing domains (Anantharaman et al., 2001). TraR seems to be the product of a fusion between a bacterial PAS/GAF domain, adapted for the specific recognition of the homoserine lactone moiety, and a small HTH DNA-binding domain. This results in a multidomain protein able to ‘sense’ the relative abundance of a homoserine lactone inside the cell and activate transcription of target genes in response to it. This simple architecture is very common among bacterial transcriptional regulators, because transcriptional regulation mediated by small molecules is the prevalent mode of regulation of operons, such as the lactose or arabinose operons (Luisi, 1995).
In addition, the TraR HTH DNA-binding domain shares a striking structural homology to the small DNA-binding protein GerE, which regulates gene transcription in B.subtilis, by recruiting an σ subunit of RNA polymerase (Ducros et al., 2001). This suggests the possibility that TraR could also be directly involved in the recruitment of RNA polymerase, in order to activate transcription of the target genes. Obviously, on the basis of the TraR crystal structure, mutational analyses could indicate TraR regions directly involved in the transcriptional activation, as well as regions contacted by the two anti-activator proteins TraM and TrlR.
The hypothesis of a fusion of two ancestral domains with dimeric character could also explain the overall asymmetry of the TraR homodimer, as observed in the structure. The two domains retain their original dimerization interfaces and, being connected to each other by a long linker, can dimerize independently, resulting in an overall asymmetric dimer capable of binding DNA with a dyad symmetry-containing sequence. The docking mode on DNA of the TraR DNA-binding domain resembles that of prokaryotic regulatory proteins, in particular those of the dimeric repressors of phage 434 and λ (Jordan and Pabo, 1988; Aggarwal et al., 1989). In all three structures, the HTH motif is anchored to segments on DNA backbone on both sides of the major groove, through hydrogen bonds to phosphates (Figure 7B) (Jordan and Pabo, 1988; Aggarwal et al., 1988).
In summary, the [TraR/AAI]2/TraBox structure unravels the molecular determinants by which LuxR-type proteins recognize autoinducers and afterwards bind to specific DNA sequences. As documented by the increasing number of publications in the field of bacterial quorum sensing, the exceptional variety of physiological functions controlled by quorum sensing in prokaryotes has just begun to emerge. The structure of this ternary complex could greatly enhance the ability to design new inhibitory compounds to fight pathogenic bacteria of many different species. Furthermore, the structure reveals the modular organization of the LuxR family of transcriptional activators, making it a promising candidate for genetic manipulations, which would change a prokaryotic transcription factor into a ligand-dependent eukaryotic transcriptional activator.
Materials and methods
AAI and DNA syntheses
AAI (C12H19NO4, molecular mass 241.29 Da; Figure 1A) was synthesized from l-homoserine lactone hydrobromide and the acyl Meldrum’s acid intermediate of Oikawa, according to Zhang et al. (1993). The high-performance liquid chromatography-purified oligonucleotide 5′-ATG-TGC-AGA-TCT-GCA-CAT-3′ (referred to as TraBox; Oswell Oligonucleotides) was resuspended up to 2 mM and, via its perfect dyad symmetry, annealed to give an 18-bp double-stranded DNA.
Complex preparation and crystallization
Details of the purification, characterization and crystallization will be described elsewhere. In brief, a selenomethionine derivative of TraR was expressed and purified from E.coli in the presence of its autoinducer, AAI. The ternary complex, [TraR/AAI]2/TraBox, was prepared by mixing equimolar amounts of protein dimer and duplex DNA. Crystals were grown by vapour diffusion at room temperature by mixing 1:1 volumes of the complex (0.21 mM) and a reservoir solution containing 50 mM 4-morpholine ethanesulfonic acid (MES) buffer pH 6.2, 200 mM calcium acetate, 5% (w/v) PEG 8000 and 3 mM dithiothreitol (DTT). Crystals were then flash-cooled for data collection at 100 K, in 50 mM MES buffer pH 6.2, 200 mM calcium acetate, 25% (w/v) PEG 8000, 25% glycerol and 3 mM DTT, after gradually equilibrating them with increasing concentrations of PEG and glycerol. Multi-wavelength anomalous diffraction (MAD) data were collected using synchrotron radiation at the European Synchrotron Radiation Facility (ESRF; Grenoble, France), at beamline ID29, using an ADSC Quantum 210 charge-coupled device (CCD) detector. Data were collected to 3.0 Å resolution from one randomly oriented crystal at the Se absorption peak (12.6620 keV) and at the absorption edge (12.6599 keV). Data were processed with MOSFLM (Powell, 1999) and scaled with the program SCALA from the CCP4 suite (CCP4, 1994). Crystals belong to space group P212121, with unit-cell parameters a = 66.993, b = 94.67 and c = 209.663 Å. Data collection statistics are summarized in Table I. The assumption of the presence of two [TraR/AAI]2/TraBox complexes in the asymmetric unit gave a reasonable Matthews coefficient of 2.54 Å3/Da and a solvent content of 49.6%. Therefore, 24 crystallographically independent selenium sites had to be located as part of the MAD phasing process.
Table I. Summary of X-ray diffraction data and refinement statistics.
| Se MADa |
||
|---|---|---|
| Inflection data | Peak data | |
| X-ray diffraction data | ||
| Wavelength | 0.979349 | 0.979186 |
| Resolution (Å)b | 50–3.0 (3.16–3.0) | 50–3.0 (3.16–3.0) |
| Rsym (%)c | 9.0 (56.9) | 8.5 (47.9) |
| <I/σI>d | 21.1 (5.2) | 21.8 (5.8) |
| No. of observations | 274 775 | 278 470 |
| No. of unique observations | 27 075 | 27 075 |
| Completeness (%) |
98.8 (98.1) |
98.8 (98.2) |
| Refinement statistics | ||
| Resolution (Å) | 20–3.0 | |
| R-factore | 0.23 | |
| Rfreef | 0.28 | |
| R.m.s.d.g bond lengths (Å) | 0.009 | |
| R.m.s.d. bond angles (°) | 1.5 | |
| Overall B-factor (Å2) | 74.3 | |
| R.m.s.d. B-factor (Å2) | 0.475 | |
| φψ angle distribution:h | ||
| In core region | 697 (83.5) | |
| In additionally allowed region | 136 (16.3) | |
| In generously allowed region | 1 (0.1) | |
| In disallowed region | 1 (0.1) | |
| Number of atoms: | ||
| In structure | 9013 | |
| In protein | 7397 | |
| In ligand | 68 | |
| In DNA | 1464 | |
| Solvent | 84 | |
aData collected with a crystal-to-detector distance of 280 mm and an oscillation range of 1°.
bHighest resolution of data set with highest resolution bin in parentheses.
cRsym = ∑h∑i |<Ih> – Ii(h)|/∑h∑i Ii(h), where Ii(h) is the mean intensity of the N reflection.
dDefined as mean intensity/standard deviation.
eR-factor = ∑h |Fo – Fc|/∑h |Fo|.
fRfree is calculated from 5% of the data, which were omitted during the course of the refinement.
gR.m.s.d. is the root mean square deviation from ideal geometry.
hAs defined by PROCHECK (Laskowski et al., 1993), the percentage distribution is given in parentheses.
Structure determination and refinement
The selenium substructure was determined using the direct method procedure as implemented in the program SnB (Weeks and Miller, 1999). Data from the peak wavelength were scaled and processed with the DREAR suite (Blessing et al., 1996) to derive the renormalized E values corresponding to the anomalous differences. These E values were then submitted to SnB using the program’s standard parameters. Analysis of the minimum function values showed a bimodal distribution indicating convergence to a solution. In all, 20 of the 24 independent selenium positions were located. Heavy-atom refinement and phase calculations were carried out at 3.0 Å resolution, using the data from the peak and the inflection (as the reference wavelength), in SHARP (de La Fortelle and Bricogne, 1997). This was followed by solvent flattening and histogram matching with the program DM and then solvent flipping with SOLOMON from the CCP4 suite (CCP4, 1994). The electron density map, even without using any form of NCS averaging, was of excellent quality (Figure 1B).
The initial non-crystallographic symmetry matrices were calculated from the positions of the heavy atoms using FINDNCS (CCP4). The model was built using QUANTA (Accelrys, Pharmacopeia Inc.). Refinement of the model was done with the CNX package (Accelrys, Pharmacopeia Inc.) against reflections between 20 and 3.0 Å resolution, with a maximum-likelihood target using the experimental phase probability distribution. The topology and parameter files for AAI were generated by the program XPLO2D (Kleywegt and Jones, 1997). Non-crystallographic symmetry restraints were applied throughout and gradually lowered during the refinement. Superimpositions of molecules were performed by using the program LSQMAN (Kleywegt, 1996). The main refinement statistics are listed in Table I, along with data collection statistics. In total, in the asymmetric unit there are: four protein chains, A (1–234 aa), B (1–234 aa), C (1–234 aa) and D (2–234 aa); two DNA duplexes, E (1–18 bp): F (1–18 bp) and G (1–18 bp): H (1–18 bp); four AAI molecules; and 84 water molecules. Missing residues are aa 166–169 in A, aa 139–142 in B, aa 165–170 in C and aa 139–142 in D. These residues are all located in solvent-exposed loop regions. The density for the ligand-binding domain of the D molecule is less clear than the other three monomers, A, B and C, because it is not stabilized by interactions with symmetry-related molecules due to crystal packing.
The structures shown in the figures were generated using the programs MOLSCRIPT (Kraulis, 1991), BOBSCRIPT (Esnouf, 1997) and RASTER3D (Merritt and Bacon, 1997), with the exception of Figure 4B, which was generated using INSIGHTII (Accelrys, Pharmacopeia Inc.). Electrostatic calculations and Figure 3 were prepared with the program GRASP (Nicholls et al., 1991). Sequence alignments were done with Clustal_X (Thompson et al., 1997). The program ESPript (Gouet et al., 1999) was used to generate Figure 5.
Accession numbers
The coordinates of the [TraR/AAI]2/TraBox complex have been deposited in the PDB under accession code 1h0m (code r1h0msf for the structure factor entry).
Acknowledgments
Acknowledgements
This paper is dedicated to the memory of our friend and colleague Franco Tatò. We thank Andrea Carfì, Andrea Mattevi, Paola Lo Surdo and Matthew Bottomley for helpful discussions and comments on the manuscript, and Bill Shepard and Andy Thomson for assistance in the MAD data collection at beamline ID29, ESRF, Grenoble, France.
Note added in proof
While this work was under review, a paper entitled ‘Structure of a bacterial quorum-sensing transcription factor complexed with phero mone and DNA’ by R.-G.Zhang, T.Pappas, J.L.Brace, P.C.Miller, T.Oulmassov, J.M.Molyneaux, J.C.Anderson, J.K.Bashkin, S.C.Winans and A.Joachimiak (2002, Nature, 417, 971–974) was published. Their structure is comparable to ours and they also noted the asymmetry of the dimer.
References
- Aggarwal A.K., Rodgers,D.W., Drottar,M., Ptashne,M. and Harrison,S.C. (1988) Recognition of a DNA operator by the repressor of phage 434: a view at high resolution. Science, 242, 899–907. [DOI] [PubMed] [Google Scholar]
- Anantharaman V., Koonin,E.V. and Aravind,L. (2001) Regulatory potential, phyletic distribution and evolution of ancient, intracellular small-molecule-binding domains. J. Mol. Biol., 307, 1271–1292. [DOI] [PubMed] [Google Scholar]
- Baikalov I., Schroder,I., Kaczor-Grzeskowiak,M., Cascio,D., Gunsalus,R.P. and Dickerson,R.E. (1998) NarL dimerization? Suggestive evidence from a new crystal form. Biochemistry, 37, 3665–3676. [DOI] [PubMed] [Google Scholar]
- Bassler B.L. (2002) Small talk: cell-to-cell communication in bacteria. Cell, 109, 421–424. [DOI] [PubMed] [Google Scholar]
- Blessing R.H., Guo,D.Y. and Langs,D.A. (1996) Statistical expectation value of the Debye–Waller factor and E (hkl) values for macromolecular crystals. Acta Crystallogr. D, 52, 257–266. [DOI] [PubMed] [Google Scholar]
- Borgstahl G.E., Williams,D.R. and Getzoff,E.D. (1995) 1.4 Å structure of photoactive yellow protein, a cytosolic photoreceptor: unusual fold, active site, and chromophore. Biochemistry, 34, 6278–6287. [DOI] [PubMed] [Google Scholar]
- Chai Y., Zhu,J. and Winans,S.C. (2001) TrlR, a defective TraR-like protein of Agrobacterium tumefaciens, blocks TraR function in vitro by forming inactive TrlR:TraR dimers. Mol. Microbiol., 40, 414–421. [DOI] [PubMed] [Google Scholar]
- Choi S.H. and Greenberg,E.P. (1991) The C-terminal region of the Vibrio fischeri LuxR protein contains an inducer-independent lux gene-activating domain. Proc. Natl Acad. Sci. USA, 88, 1115–1119. [DOI] [PMC free article] [PubMed] [Google Scholar]
- Choi S.H. and Greenberg,E.P. (1992) Genetic dissection of DNA binding and luminescence gene activation by the Vibrio fischeri LuxR protein. J. Bacteriol., 174, 4064–4069. [DOI] [PMC free article] [PubMed] [Google Scholar]
- CCP4 (1994) The CCP4 suite: programs for protein crystallography. Acta Crystallogr. D, 50, 760–763. [DOI] [PubMed] [Google Scholar]
- de La Fortelle E. and Bricogne,G. (1997) Maximum-likelihood heavy-atom parameter refinement for multiple isomorphous replacement and multiwavelength anomalous diffraction methods. Methods Enzymol., 276, 472–494. [DOI] [PubMed] [Google Scholar]
- Ducros V.M.-A., Lewis,R.J., Verma,C.S., Dodson,E.J., Leonard,G., Turkenburg,G.P., Murshudov,G.N., Wilkinson,A.J. and Brannigan,J.A. (2001) Crystal structure of GerE, the ultimate transcriptional regulator of spore formation in Bacillus subtilis. J. Mol. Biol., 306, 759–771. [DOI] [PubMed] [Google Scholar]
- Egland K.A. and Greenberg,E.P. (2001) Quorum sensing in Vibrio fischeri: analysis of the LuxR DNA binding region by alanine-scanning mutagenesis. J. Bacteriol., 183, 382–386. [DOI] [PMC free article] [PubMed] [Google Scholar]
- Esnouf R.M. (1997) An extensively modified version of MolScript that includes greatly enhanced coloring capabilities. J. Mol. Graph. Model., 15, 132–134. [DOI] [PubMed] [Google Scholar]
- Farrand S.K. (1998) Conjugation in Rhizobiaceae. In Spaink,H.P., Kondorosi,A. and Hooykaas,P.J.J. (eds), The Rhizobiaceae, Molecular Biology of Model Plant-Associated Bacteria. Kluwer Academic, Dordrecht, The Netherlands, pp. 199–233.
- Fuqua C. and Greenberg,E.P. (1998) Self perception in bacteria: quorum sensing with acylated homoserine lactones. Curr. Opin. Microbiol., 1, 183–189. [DOI] [PubMed] [Google Scholar]
- Fuqua C., Winans,S.C. and Greenberg,E.P. (1994) Quorum sensing in bacteria: the LuxR-LuxI family of cell density-responsive transcriptional regulators. J. Bacteriol., 176, 269–275. [DOI] [PMC free article] [PubMed] [Google Scholar]
- Gouet P., Courcelle,E., Stuart,D.I. and Metoz,F. (1999) ESPript: multiple sequence alignments in PostScript. Bioinformatics, 15, 305–308. [DOI] [PubMed] [Google Scholar]
- Hanzelka B.L. and Greenberg,E.P. (1995) Evidence that the N-terminal region of the Vibrio fischeri LuxR protein constitutes an autoinducer-binding domain. J. Bacteriol., 177, 815–817. [DOI] [PMC free article] [PubMed] [Google Scholar]
- Ho Y.S., Burden,L.M. and Hurley,J.H. (2000) Structure of the GAF domain, a ubiquitous signaling motif and a new class of cyclic GMP receptor. EMBO J., 19, 5288–5299. [DOI] [PMC free article] [PubMed] [Google Scholar]
- Holm L. and Sander,C. (1993) Protein structure comparison by alignment of distance matrices. J. Mol. Biol., 233, 123–138. [DOI] [PubMed] [Google Scholar]
- Jordan S.R. and Pabo,C.O (1988) Structure of the λ complex at 2.5 Å resolution: details of the repressor–operator interactions. Science, 242, 893–899. [DOI] [PubMed] [Google Scholar]
- Kawabata T. and Nishikawa,K. (2000) Protein structure comparison using the markov transition model of evolution. Proteins, 41, 108–122. [PubMed] [Google Scholar]
- Kleywegt G.J. (1996) Use of non-crystallographic symmetry in protein structure refinement. Acta Crystallogr. D, 52, 842–857. [DOI] [PubMed] [Google Scholar]
- Kleywegt G.J. and Jones,T.A. (1997) Model building and refinement practice. Methods Enzymol., 277, 208–230. [DOI] [PubMed] [Google Scholar]
- Kraulis P.J. (1991) A program to produce both detailed and schematic plots of protein structures. J. Appl. Crystallogr., 24, 946–950. [Google Scholar]
- Laskowski R.A., MacArthur,M.W., Moss,D.S. and Thornton,J.M. (1993) PROCHECK: a program to check the stereochemical quality of protein structures. J. Appl. Crystallogr., 26, 283–291. [Google Scholar]
- Luisi B. (1995) DNA–protein interaction at high resolution. In Lilley,D.M.J. (ed.), DNA–Protein: Structural Interactions. IRL Press, Oxford, UK, pp. 1–39.
- Luo Z.Q. and Farrand,S.K. (1999) Signal-dependent DNA binding and functional domains of the quorum-sensing activator TraR as identified by repressor activity. Proc. Natl Acad. Sci. USA, 96, 9009–9014. [DOI] [PMC free article] [PubMed] [Google Scholar]
- Luo Z.Q., Qin,Y. and Farrand,S.K. (2000) The antiactivator TraM interferes with the autoinducer-dependent binding of TraR to DNA by interacting with the C-terminal region of the quorum-sensing activator. J. Biol. Chem., 275, 7713–7722. [DOI] [PubMed] [Google Scholar]
- Merritt E.A. and Bacon,D.J. (1997) Raster3D: photorealistic molecular graphics. Methods Enzymol., 277, 505–524. [DOI] [PubMed] [Google Scholar]
- Miller M.B. and Bassler,B.L. (2001) Quorum sensing in bacteria. Annu. Rev. Microbiol., 55, 165–199. [DOI] [PubMed] [Google Scholar]
- Mueller-Fahrnow A. and Egner,U. (1999) Ligand-binding domain of estrogen receptors. Curr. Opin. Biotechnol., 10, 550–556. [DOI] [PubMed] [Google Scholar]
- Nelson K.H. and Hastings,J.W. (1979) Bacterial bioluminescence: its control and ecological significance. Microbiol. Rev., 43, 496–518. [DOI] [PMC free article] [PubMed] [Google Scholar]
- Nicholls A., Sharp,K. and Honig,B. (1991) Protein folding and association: insights from the interfacial and thermodynamic properties of hydrocarbons. Proteins, 11, 281–296. [DOI] [PubMed] [Google Scholar]
- Pervushin K., Billeter,M., Siegal,G. and Wuthrich,K. (1996) Structural role of a buried salt bridge in the 434 repressor DNA-binding domain. J. Mol. Biol., 264, 1002–1012. [DOI] [PubMed] [Google Scholar]
- Powell H.R. (1999) The Rossmann Fourier autoindexing algorithm in MOSFLM. Acta Crystallogr. D, 55, 1690–1695. [DOI] [PubMed] [Google Scholar]
- Qin Y., Luo,Z.Q., Smyth,A.J., Gao,P., Beck von Bodman,S. and Farrand,S.K. (2000) Quorum-sensing signal binding results in dimerization of TraR and its release from membranes into the cytoplasm. EMBO J., 19, 5212–5221. [DOI] [PMC free article] [PubMed] [Google Scholar]
- Suzuki M. (1993) Common features in DNA recognition helices of eukaryotic transcription factors. EMBO J., 12, 3221–3226. [DOI] [PMC free article] [PubMed] [Google Scholar]
- Swiderska A., Berndtson,A.K., Cha,M.R., Li,L., Beaudoin,G.M.,III, Zhu,J. and Fuqua,C. (2001) Inhibition of the Agrobacterium tumefaciens TraR quorum-sensing regulator. Interactions with the TraM anti-activator. J. Biol. Chem., 276, 49449–49458. [DOI] [PubMed] [Google Scholar]
- Thompson J.D., Gibson,T.J., Plewniak,F. and Higgins,D.G. (1997) The Clustal_X windows interface: flexible strategies for multiple sequence alignment aided by quality analysis tools. Nucleic Acids Res., 25, 4876–4882. [DOI] [PMC free article] [PubMed] [Google Scholar]
- Weeks C.M. and Miller,R. (1999) Optimizing Shake-and-Bake for proteins. Acta Crystallogr. D, 55, 492–500. [DOI] [PubMed] [Google Scholar]
- Zhang L., Murphy,P.J., Kerr,A. and Tate,M.E. (1993) Agrobacterium conjugation and gene regulation by N-acyl-l-homoserine lactones. Nature, 362, 446–448. [DOI] [PubMed] [Google Scholar]
- Zhu J. and Winans,S.C. (1998) Activity of the quorum-sensing regulator TraR of Agrobacterium tumefaciens is inhibited by a truncated, dominant defective TraR-like protein. Mol. Microbiol., 27, 289–297. [DOI] [PubMed] [Google Scholar]
- Zhu J. and Winans,S.C. (1999) Autoinducer binding by the quorum-sensing regulator TraR increases affinity for target promoters in vitro and decreases TraR turnover rates in whole cells. Proc. Natl Acad. Sci. USA, 96, 4832–4837. [DOI] [PMC free article] [PubMed] [Google Scholar]
- Zhu J. and Winans,S.C. (2001) The quorum-sensing transcriptional regulator TraR requires its cognate signaling ligand for protein folding, protease resistance, and dimerization. Proc. Natl Acad. Sci. USA, 98, 1507–1512. [DOI] [PMC free article] [PubMed] [Google Scholar]
- Zhu J., Oger,P.M., Schrammeijer,B., Hooykaas,P.J., Farrand,S.K. and Winans,S.C. (2000) The bases of crown gall tumorigenesis. J. Bacteriol., 182, 3885–3895. [DOI] [PMC free article] [PubMed] [Google Scholar]