

Abstract
Cardiorespiratory control is mediated in part by central chemosensitive neurons that respond to increased CO2 (hypercapnia). Activation of these neurons is believed to involve hypercapnia-induced decreases in intracellular pH (pHi). All previous measurements of hypercapnia-induced pHi changes in chemosensitive neurons have been made from the soma, but chemosensitive signaling could be initiated in the dendrites of these neurons. In this study, membrane potential (Vm) and pHi were measured simultaneously in chemosensitive locus coeruleus (LC) neurons from neonatal rat brainstem slices using whole-cell pipettes and the pH-sensitive fluorescent dye pyranine. We measured pHi from the soma as well as from primary dendrites to a distance of 160 μm from the edge of the soma. Hypercapnia (15% CO2, pHo 7.00; control: 5% CO2, pHo 7.45) resulted in an acidification of similar magnitude in dendrites and soma (about 0.26 pH unit), but that was faster in the more distal regions of the dendrites. Neither the dendrites nor the soma exhibited pHi recovery during hypercapnia-induced acidification, but both regions contain pH-regulating transporters since they exhibit pHi recovery from an NH4Cl prepulse-induced acidification (at constant pHo 7.45). Exposing a portion of the dendrites to hypercapnic solution did not increase firing rate, but exposing the soma to hypercapnic solution resulted in a near maximal increase in firing rate. These data show that while the pHi response to hypercapnia is similar in the dendrites and soma, somatic exposure to hypercapnia plays a major role in the activation of chemosensitive LC neurons from neonatal rats.
Keywords: acid, brainstem, intracellular pH, pyranine, respiratory control, whole-cell
INTRODUCTION
Increased CO2 (hypercapnia) stimulates ventilation. This ventilatory response to hypercapnia is largely mediated by CO2 sensitive neurons in the brainstem, referred to as central chemosensitive neurons (for recent review see 26 and 34). Chemosensitive neurons are located in a variety of sites in the brainstem and their response to hypercapnia is believed to be mediated in part by a decrease in pHi (12,26,41,42). Cell acidification can alter excitability by inhibiting a variety of ion channels (13). However, all of the studies of the role of changes of pHi in chemosensitive neurons have measured pHi of the soma only (12, 20, 24,26,32,33,39,42). It may be that the chemosensitive signal does not arise in the soma but in the dendrites (14,22,34). If this is the case, the neuron would be responding to a signal from a specified area, not from a larger region of the neuron. Further, dendrites from chemosensitive neurons in a variety of brainstem regions project to the surface or associate with blood vessels (1,6,15,22), suggesting that they can more easily respond to systemic changes in CO2/H+. This possibility is difficult to assess since changes in pHi in the dendrites of chemosensitive neurons in response to hypercapnia have not been measured. The responses of chemosensitive neuron firing rate to local acidification, within the vicinity of the soma or of the dendrites, has also not been measured.
We employed a technique using whole-cell pipettes to reliably load neuronal soma and dendrites with a pH-sensitive dye and thereby measure pHi and Vm simultaneously (35,43). We used neonatal rat brainstem slices and studied neurons from the locus coeruleus (LC) since more than 80% of the neurons from this region respond to hypercapnia with an increased firing rate (12,21,23). Using this technique, we found that the pHi responses of LC dendrites to hypercapnia are similar to the pHi responses of the soma, consistent with chemosensitive signaling arising in the soma, the dendrites, or both. We further studied the firing rate response of LC neurons to local exposures of hypercapnia. We found that exposing only a dendrite to hypercapnic acidotic solution did not increase LC neuron firing rate, but somatic exposure elicited a near maximal firing rate response.
Preliminary reports of this work have been published (27,28).
MATERIALS AND METHODS
Solutions and materials.
Control solution contained (in mM): 124 NaCl, 3 KCl, 1.24 NaH2PO4, 1.3 MgSO4, 2.4 CaCl2, 26 NaHCO3, and 10 glucose and was equilibrated with 5% CO2/95% O2 (control; pH ~ 7.45 at 37°C). Hypercapnic acidosis solution was equilibrated with 10% CO2/90% O2 (pH ~ 7.15 at 37°C), 15% CO2/85% O2 (pH ~ 7.00 at 37°C) or 20% CO2/80% O2 (pH ~ 6.85 at 37ºC). During NH4Cl prepulse experiments (5), 30mM NaCl in control solution was isosmotically replaced with 30mM NH4Cl. The pHi calibration solution contained (in mM): 129 KCl, 1.24 KH2PO4, 1.3 MgSO4, 2.4 CaCl2, 17 K-HEPES (N-2-hydroxyethylpiperazine-N′-2-ethanesulfonic acid), 10 glucose, and 0.004 nigericin and was titrated with either KOH or HCl to pH values ranging from 6.2 to 8.6. Nigericin was purchased from Sigma and was added from a 16.7 mM stock solution (in DMSO). Pyranine (8-hydroxypyrene-1,3,6-trisulfonic acid) was purchased from Molecular Probes and was added from a 4 mM stock solution (in water).
Preparation of pontine brain slices.
Transverse pontine slices (200–300μm) were prepared from preweanling Sprague-Dawley rats (postnatal day, P0 – P12) beginning at the level of the 7th cranial nerve and extending rostrally for ~ 1 to 1.5 mm. All animal procedures were approved by the Wright State University Institutional Animal Care and Use Committee. Wright State University is accredited by AAALAC and is covered by NIH Assurance (no. A3632-01). Slices were cut into ice-cold control solution using a vibratome (Pelco 101, series 1000) and stored at room temperature. Experiments began at least one hour and no longer than six hours after slicing. Individual slices were then placed into a superfusion chamber (1.0 ml volume), which was on the stage of an upright Nikon Eclipse E600 microscope, immobilized with a grid of nylon fibers, and superfused at ~ 4 ml/min with control solution (37°C).
Visualization of brain slices.
Individual LC neurons were visualized using infrared video microscopy. A 60X water immersion objective (W.D. 3 mm; N.A. 0.8) was used during these experiments and contained Hoffman Modulated Contrast optics. Light was directed to a Nikon multi-image port module equipped with a 505 nm dichroic mirror, which allowed 100% of the infrared image and 100% of the fluorescence image (see below) to each port simultaneously. The infrared image was then directed to a Sony CCD-IRIS video camera and displayed on a Sony video monitor.
Imaging of pyranine-loaded slices.
The pH-sensitive dye, pyranine, was loaded into individual LC neurons with either whole-cell pipettes or sharp electrodes (see below). Pyranine-loaded LC neurons were excited (with light from a xenon arc lamp) alternately at 450 ± 10 (pH-sensitive) and 415 ± 10 nm (pH-insensitive) using a Sutter Lambda 10-2 filter wheel. An acquisition took about 2 seconds and was repeated at 10 to 60 second intervals. There was no excitation light between acquisitions. Emitted fluorescence at 515 ± 10 nm (all filters from Omega Optical) was directed to the Nikon multi-image port module, and was then directed to a GenIIsys image intensifier and a CCD100 camera (both from Dage-MTI). The subsequent fluorescence images were acquired by a Gateway 2000 E-3100 computer, collected and processed using Metafluor 4.6r5 software (Universal Imaging), and the 450/415 fluorescence ratios (Rfl) determined. In order to convert Rfl to pHi, we calibrated pyranine using the high K+/nigericin technique (37) to obtain Rfl values at known pH values ranging from 6.2 to 8.6. These Rfl values were then normalized to the Rfl value at pH 7.4, yielding normalized Rfl (Nfl). A calibration of Nfl versus pHi was created, which produced a calibration curve with the following equation:
This allowed us to perform a one point calibration at pH 7.4 at the end of each experiment. The Rfl values measured during the experiment were divided by the calibration Rfl value at pH 7.4, yielding Nfl, and Nfl was converted to pHi using the above equation.
Sharp electrode recordings.
Sharp electrodes (125–150 MΩ) were fabricated from borosilicate glass (1B100F-4, World Precision Instruments) using a Flaming/Brown P-87 electrode puller and contained 3 M K-acetate and 10 mM pyranine. The electrode holder contained a Ag-AgCl wire and the circuit was completed with a Ag-AgCl wire placed in the superfusion bath, downstream to the brain slice. An impalement was obtained by placing the electrode tip on the cell membrane and inducing a ~ 4 ms pulse using the remote buzz button from a Dagan BVC-700 amplifier. Once an LC neuron was impaled, pyranine was iontophoresed into the neuron with hyperpolarizing current (−0.1 nA, 500msec, 1Hz) for about 5 minutes. Impalements were done only on the outer edge of the soma (as opposed to the center) to insure that the fluorescence from pyranine in the electrode would not interfere with the fluorescence of pyranine in the soma. Stable Rfl was achieved within about 10 minutes. Membrane potential (Vm) was measured with the use of the Dagan BVC-700 amplifier.
Whole-cell recordings.
The whole-cell recording technique, which was used to simultaneously measure Vm and pHi, was modified from the technique of Schwiening and Willoughby (35,43). Whole-cell pipettes (5 MΩ) were fabricated from borosilicate glass (TW150F-4, World Precision Instruments) using a Narishige PP-830 dual stage pipette puller and contained (in mM): 130 K-gluconate, 1 MgCl2, 10 HEPES, 0.4 EGTA (ethylene glycolbis(β-aminoethyl ether)-N,N,N′,N′-tetraacetic acid), 2 Na2ATP, 0.3 Na2GTP and 0.2 – 0.4 pyranine (pHo ~ 7.3; 37ºC) (13). The pipette holder contained a Ag-AgCl wire and the circuit was completed with a Ag-AgCl wire placed in the superfusion bath, downstream to the brain slice. Positive pressure was put on the whole-cell recording pipette as soon as it was put into the bath solution. To achieve a tight seal, the pipette was initially manipulated to touch the membrane of the soma. Tight seals were attempted solely on the outer edge of the soma, so that the fluorescence from pyranine in the pipette would not interfere with the fluorescence of pyranine in the soma. Once the pipette touched the outer edge of the soma, negative pressure was applied to the pipette to form a tight (G Omega;) seal with the cell membrane. The tight seal was then ruptured, and a whole-cell patch was created. Pyranine diffused from the whole-cell pipette into the neuron and stable Rfl values were achieved within about 15 minutes (17). Vm was measured with the use of the Dagan BVC-700 amplifier. We also performed experiments in which the neurons were loaded with pyranine, and then the whole-cell pipette was rapidly but carefully detached from the neuron (detached neuron). We then loaded a second neuron adjacent to the pyranine-loaded detached neuron, but this time, the whole-cell pipette remained attached to the neuron (attached neuron). Rfl in the detached neuron was stable and the neuron remained unchanged morphologically in excess of two hours, both of which indicate that the neuron remained healthy.
Determining the effect of firing rate on pHi
Constant current was injected into a whole-cell patched LC neuron via a Dagan BVC-700 amplifier for 5–10 minutes to depolarize the neuron and increase its firing rate. We simultaneously measured pHi (as described above) during increased firing rate. The amount of current was varied to increase firing rate 25%, 100%, 200%, 300% or 400% and was done in a stepwise manner. The neuron was allowed to return to resting firing rate and pHi between each step. The change in pHi during each step was determined in the soma and at various regions along the dendrite (0–25, 25–50 and 50–100 μm from the edge of the soma).
Microinjection of hypercapnic solution over the soma or dendrites.
The same pipettes used for whole-cell recordings were used as microinjection pipettes, filled with control solution + 200 μM pyranine (equilibrated with 100% CO2) and placed in the holder of a Picospritzer II D microinjection system (General Valve Corporation). Hypercapnic solution was injected for 2 minutes over discreet regions of a whole-cell patched LC neuron, while measuring Vm. The injected hypercapnic solution was visualized from the pyranine fluorescence within the solution and encompassed a region that was approximately 100 μm in diameter. Upon cessation of the injection, it took approximately 2 minutes for the hypercapnic solution to be completely superfused away. Pipettes were initially positioned over the distal region of a dendrite, which allowed just the dendrite to be exposed to the injected hypercapnic solution. Pipettes were then positioned over the proximal region of the same dendrite, which allowed both the dendrite and soma to be exposed to the injected hypercapnic solution. Finally, pipettes were positioned next to the soma, which allowed the soma (and to a lesser extent, the proximal regions of dendrites) to be exposed to the injected hypercapnic solution. In between each of the above injections, the neurons were allowed to return to resting Vm conditions. Control experiments were performed identically to those described above except that the microinjection pipette was filled with control solution (equilibrated with 5% CO2, pHo 7.45).
Data analysis.
Vm was saved to both a digital VCR (Vetter, model 400) and to Axoscope software (version 8.0) for later analysis. Firing rates were determined (10 s bins) using a window discriminator/integrator (Winston Electronics). Curve fitting for the pHi calibrationcurve was done using NFIT (Island Products, Galveston, TX). The rate of acidification upon exposure to hypercapnia was measured from the point just prior to the beginning of acidification to the point at which the initial fast drop in pHi was complete (approximately 2 minutes, which corresponds to about 12 points). The rate of pHi recovery in response to hypercapnia-induced acidification, in the maintained presence of hypercapnia, was measured from the point at which the initial fast drop in pHi was complete until the point at which hypercapnia was removed. This period was at least 5 minutes in duration and included from 5–15 points. The rate of pHi recovery from an NH4Cl prepulse-induced acidification was measured beginning at the point of minimum pHi and followed for about 3 minutes, corresponding to approximately 18 points. All of these rates were determined as the slope of the best fit least squares linear regression line fit to the appropriate points as described above. Significant differences between 2 means were determined by Student’s t tests. Comparisons of more than 2 means were done with one way analysis of variance (ANOVA). Multiple paired comparisons were made using the Student Neuman-Keuls test. For the statistical comparison of a mean difference with 0, a 95% confidence interval was constructed. For all tests, a P value of < 0.05 was used as the criterion for significance. All values are given as the mean ± 1 standard error of the mean (SEM).
RESULTS
Whole-cell vs. sharp electrode recordings.
We wanted to use whole-cell pipettes to load the dendrites as well as the soma of LC neurons with pyranine as had previously been done with non-chemosensitive neurons (35,43). However, we were concerned that there might be some clamping of pHi or washout of the electrical response to hypercapnia with the use of these pipettes (8,15,17,31). Although we used a filling solution that had low EGTA concentration and no added Ca2+, which has been shown previously to reduce whole-cell washout (11), we wanted to compare simultaneous measurements of pHi and Vm using whole-cell pipettes with those using sharp electrodes, which have limited diffusional exchange with the cytoplasm.
The Vm response to hypercapnia was similar when using whole-cell pipettes vs. sharp electrodes (Figs. 1A & B). The initial Vm was −45 ± 1 (n=15) and −45 ± 2 mV (n=5), depolarized by 4 and 3 mV in response to hypercapnia (10% CO2), and returned to normal Vm of −44 ± 1 and −45 ± 2 mV upon return to normocapnia (5% CO2) with whole-cell vs. sharp electrodes, respectively. Hypercapnia also induced a similar reversible increase in firing rate from 0.8 ± 0.03 to 1.7 ± 0.03 (115 ± 19% increase) back to 1.0 ± 0.03 Hz measured with whole-cell pipettes (Figs. 1A & D) and 1.2 ± 0.2 to 2.3 ± 0.3 (107 ± 29% increase) back to 1.0 ± 0.3 Hz measured with sharp electrodes.
Figure 1.
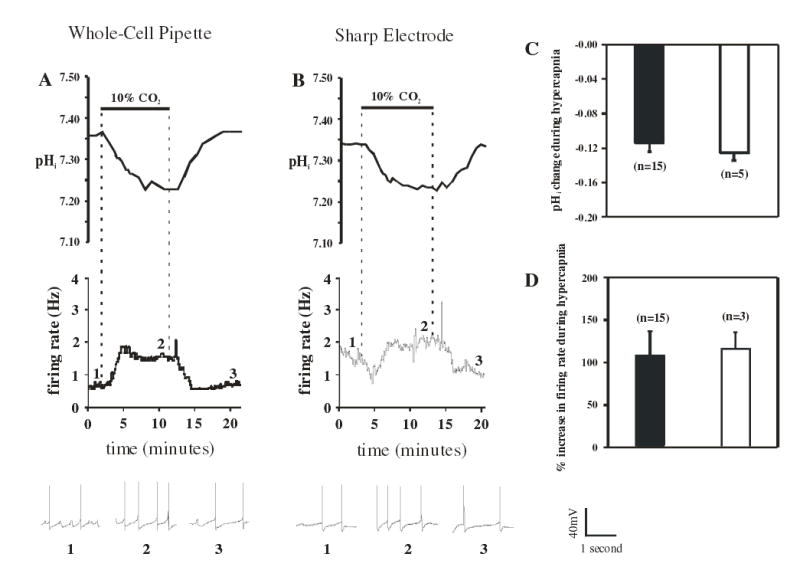
Simultaneous measurements of pHi and firing rate in response to hypercapnia (10% CO2; pHo 7.15) of LC neurons measured with either whole-cell pipettes or sharp electrodes. A: The pHi (top trace) and integrated firing rate (middle trace) as a function of time in response to hypercapnia as measured with a whole-cell pipette. Note the reversible and maintained acidification and increased firing rate in response to hypercapnia. Brief segments of individual action potentials are shown in the bottom trace. The segments were taken from the numbered regions as indicated in the middle trace. Time and voltage calibrations for these traces are indicated to their right. B: The pHi (top trace) and integrated firing rate (middle trace) as a function of time in response to hypercapnia as measured with a sharp electrode. Brief segments of individual action potentials are shown in the bottom trace. The segments were taken from the numbered regions as indicated in the middle trace. Time and voltage calibrations for these traces are indicated to their right. C: The mean (± 1 SEM) of the hypercapnia-induced change of pHi measured with whole-cell pipettes (filled bars) or sharp electrodes (open bars). Hypercapnia-induced acidification (about 0.12 pH unit) was the same when measured with either technique. D: The mean (± 1 SEM) of the hypercapnia-induced % increase in firing rate measured with whole-cell pipettes (filled bars) or sharp electrodes (open bars). Hypercapnia-induced increase firing rate (about 100%) was the same when measured with either technique.
The pHi response to hypercapnia was also similar when using whole-cell pipettes vs. sharp electrodes (Figs. 1A & B). When measured in neurons patched with whole-cell pipettes, hypercapnia (10% CO2) caused a maintained 0.13 ± 0.01 pH unit intracellular acidification from an initial pHi of 7.34 ± 0.01 pH unit, which returned to 7.32 ± 0.03 pH unit upon return to normocapnia (5% CO2) (Figs. 1A & C). When measured in neurons impaled with sharp electrodes, hypercapnia induced a similar maintained intracellular acidification of 0.11 ± 0.01 pH unit from an initial pHi of 7.32 ± 0.02 pH unit, which returned to 7.30 ± 0.04 pH unit upon return to normocapnia (Figs. 1B & C). Thus, we observed no significant differences in hypercapnia-induced changes in pHi (Fig. 1C) or firing rate (Fig. 1D) between neurons studied with whole- cell pipettes vs. sharp electrodes. This indicates that whole-cell pipettes can be reliably used to study the responses of LC neurons to hypercapnia, and we have used whole-cell pipettes in the remainder of the studies.
Attached versus detached whole-cell recordings.
We were surprised to find that the soma remains loaded with pyranine even when the whole-cell pipette becomes detached. We studied this phenomenon directly by loading a neuron with pyranine and then deliberately detaching the patch electrode (detached neuron). A second neuron, adjacent to the pyranine-loaded detached neuron, was then patched and loaded, with the whole-cell pipette remaining attached to this neuron (attached neuron) (Fig. 2A). Rfl in the detached neuron was stable for more than 2 hours, and morphologically, the neuron remained unchanged, both of which indicate that it successfully resealed. We then compared the changes of pHi in response to hypercapnic acidosis in both the detached and attached neuron. Brain slices were superfused with control solution until an initial stable pHi baseline was established for both detached and attached neurons (7.31 ± 0.02 and 7.35 ± 0.02, n = 5, respectively). Upon superfusion with hypercapnic acidotic solution equilibrated with 15% CO2/85% O2 (we used 15% CO2 instead of 10% CO2 to give us a larger pHi response so that we could better compare the changes between the two somata), there was an intracellular acidification of 0.25 pH unit in both detached and attached neurons that was maintained for the entire duration of the hypercapnic exposure (Figs. 2B & C). Upon return to control solution equilibrated with 5% CO2/95% O2, values of pHi in detached and attached neurons returned back to their initial levels of 7.30 ± 0.02 and 7.33 ± 0.02, respectively. The rate of acidification upon exposure to hypercapnic acidosis was also similar in the detached and attached neurons: −0.061 ± 0.010 pH unit/minute and −0.058 ± 0.007 pH unit/minute, respectively (Fig. 2D). Thus, it appears that the whole cell pipette can be detached from an LC neuron after loading with pyranine and yet the neuron will still give normal pHi responses to hypercapnic acidosis.
Figure 2.
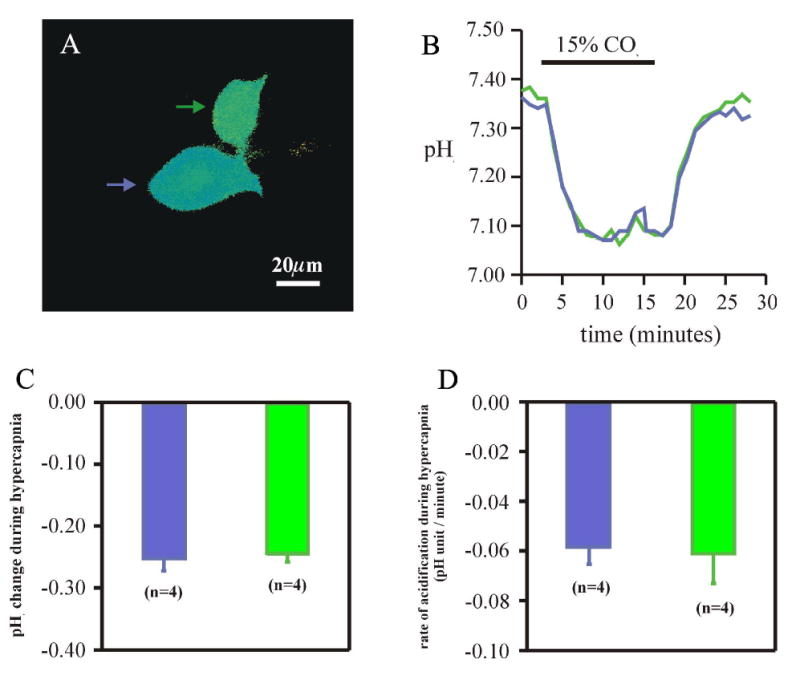
Comparison of the pHi response to hypercapnia in detached vs. attached LC neurons. A: A pseudocolor image of the somata of two pyranine-loaded LC neurons. One was previously loaded with a whole cell pipette that was then detached from the cell body (green), while the other was loaded and still has the whole-cell pipette attached (blue). B: The pHi response of the two neurons to hypercapnia (15% CO2, pHo 7.00). C: The magnitude of the pHi change in the soma induced by hypercapnia for attached (blue) and detached (green) LC neurons. D: The rate of the acidification induced by hypercapnia for attached (blue) and detached (green) LC neurons. Note that the change of pHi and the rate of acidification are the same in both attached and detached soma. The height of a bar represents the mean and the error bar represents 1 SEM.
The effects of increasing firing rate on pHi.
Since increased firing rate has previously been shown to acidify neurons (3,35,43), we wanted to determine to what extent the increase in firing rate seen with hypercapnic acidosis contributed to the decrease in pHi. Once a stable Vm and pHi baseline recording was established, various levels of constant, positive DC current were injected into the neuron via the amplifier to increase neuronal firing rate (Figs. 3A & B). The initial current injection caused a similar increase in firing rate that hypercapnic acidosis (10% CO2) did. Subsequent current injections caused a 100, 200, 300 and 400% increase in firing rate (Fig. 3A, top panel). In between each current injection, firing rate was allowed to return to baseline levels. The change in pHi was also recorded during current injections in the soma and at various distances down the dendrites (Fig. 3A, bottom panel). The firing rate-induced changes of pHi did not differ between the soma and dendrites and amounted to at most about 0.06 pH unit for a 400% increase in firing rate (Fig. 3B).
Figure 3.
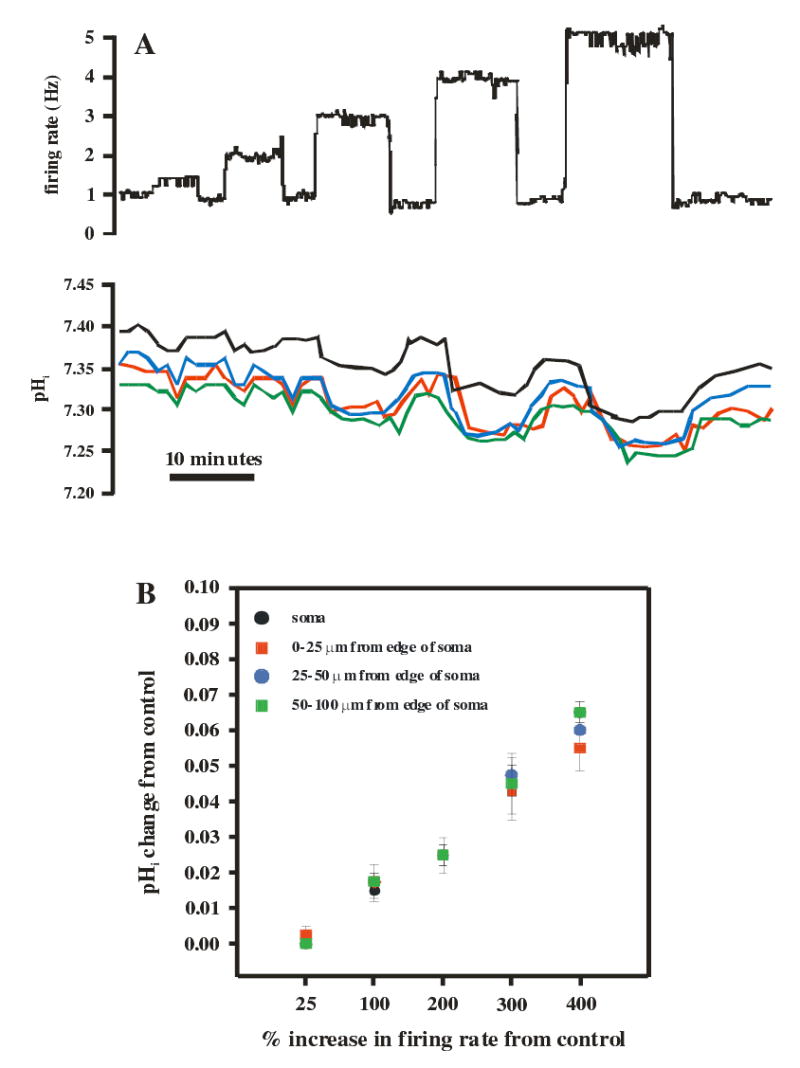
Determination of the effect of firing rate on pHi. A. Constant depolarizing current pulses (5–10 min duration) were injected into a whole-cell patched LC neuron to increase firing rate (top panel) while simultaneously measuring pHi (bottom panel). The current injected was varied to increase firing rate by 25% (similar to increase seen with 10% CO2), 100%, 200%, 300% or 400% and was done in a stepwise manner. The neuron was allowed to return to resting firing rate and pHi between each step. The change of pHi during each step was determined in the soma and at various regions along the dendrite (0–25, 25–50 and 50–100 μm from the edge of the soma). B. The mean (± 1 SEM) of the change of pHi as a function of the % change in firing rate. Note the linear relationship between the two, the similar pHi changes in the soma and dendrites, and the small magnitude of the change of pHi for even large increases in firing rate.
Comparing hypercapnia-induced pHi changes in soma versus dendrite.
We next wanted to directly measure the response of pHi to hypercapnic acidosis in the dendrites vs. the soma of LC neurons. We loaded neurons using whole-cell pipettes, and increased the pyranine concentration from 200μM to 400μM. This was done to get good loading of the dendrites as well as the soma. By increasing excitation light and imaging system gain, dendrites could be visualized for a considerable distance from the soma, but in these cases somatic fluorescence was saturated. An example of such a pyranine-loaded neuron is show in Fig. 4. This neuron is similar in morphology to multipolar LC neurons previously described (9), with a pyramidal soma about 20–40 μm across and 4–5 major dendrites that taper to about 2 μm in diameter. Often, at least one of the dendrites extended a considerable distance within the same focal plane as the soma (Fig. 4).
Figure 4.
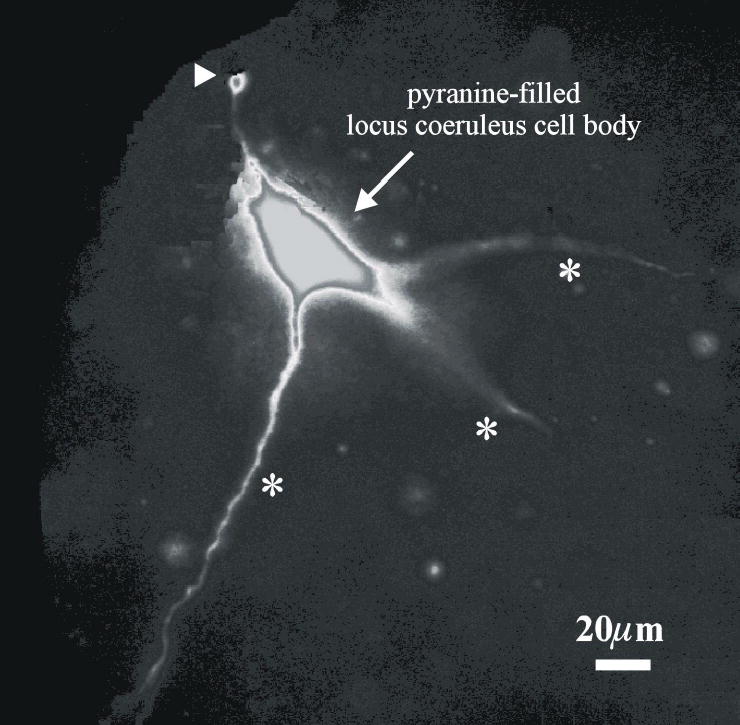
A monochrome image of an LC neuron loaded with pyranine and imaged at high gain. Note the three dendrites (denoted by *), one of which remains in focus for about 100 μm. Note also, a fourth dendrite that has been pruned by slice preparation, as is evident from the fluorescent bleb at its end (arrow head).
To avoid saturation of somatic fluorescence while still being able to visualize dendritic fluorescence, we used neurons loaded with high levels of pyranine but without increasing system gain. Measurements were made of pHi in the soma and only in dendrites within the same plane of focus as the soma. Measurements were taken from three different regions: 0–25μm, 25–50μm and 50–100μm from the edge of the soma, where the soma clearly narrows to form the most proximal region of a dendrite (Fig. 5A). An example of the fluorescence of pyranine from different regions of the dendrite, as well as the soma, is shown in Fig. 5A. The magnitude of the pHi change before, during and after hypercapnia, in both the soma and the different regions of the dendrite, as well as the integrated firing rate during those same times, are shown in Figs. 5B and 5C. This neuron was chemosensitive, as shown by its reversible increase in firing rate in response to hypercapnic acidosis (15% CO2) (Fig. 5C). The magnitude and the rate of acidification appeared to be somewhat larger the farther down the dendrite the measurements were made (Fig. 5B).
Figure 5.
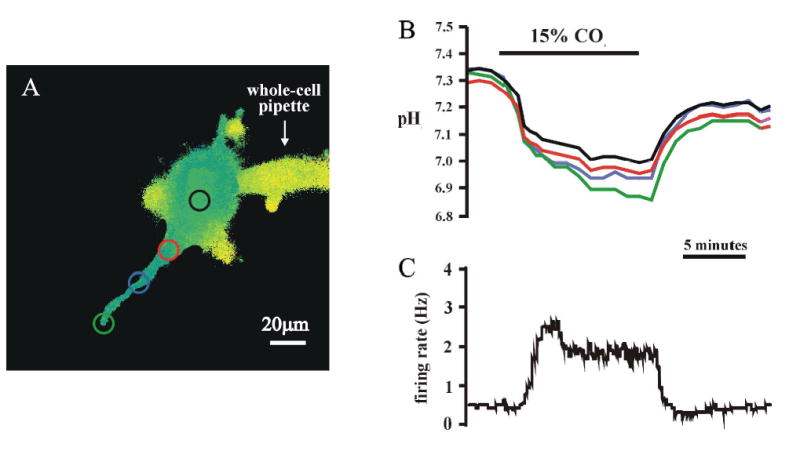
Simultaneous measurement of the firing rate response and the pHi response to hypercapnia (15% CO2, pHo 7.00) in the soma and a dendrite of an LC neuron. A: A pseudocolor image of an LC neuron with the dye-filled pipette attached. The four colored circles show the areas of interest that were studied. B: The pHi response to hypercapnia in the soma and in three areas of a dendrite (0–25, 25–50 and 50–100 μm from the edge of the soma). C: The integrated firing rate response to hypercapnia, measured with the whole cell pipette.
We were able to obtain 7 neurons with dendrites that loaded and remained in the same plane of focus as the soma for at least 100 μm from the edge of the soma. To detect pHi changes in the dendrites further from the soma, we loaded neurons as above and then detached the whole-cell pipette from the soma. This allowed us to follow a dye-loaded dendrite as far as possible by moving the stage. To further enhance our ability to visualize the most distal regions of the dendrites, we increased the gain on the intensifier. This allowed us to visualize dendrites as far as 160 μm from the edge of the soma. An additional 5 neurons were studied using this approach.
The summary of changes of pHi in the various regions in response to hypercapnia of these 12 neurons is shown in Figs. 6A & B. In Fig. 6A, there was a trend for hypercapnia to induce a slightly greater acidification the more distal the region on the dendrite but given the variation from neuron to neuron this difference was not significantly different (ANOVA, P>0.51). The overall mean hypercapnia-induced acidification was 0.26 ± 0.02 pH unit (n=48). Similarly, the rate of acidification appeared to be slightly faster in the dendrites than in the soma (Fig. 6B), but these rates were not significantly different (ANOVA, P>0.11) with an overall average rate of acidification of −0.070 ± 0.008 pH unit/min (n=48). To eliminate the effect of inter-neuron variability, we were able to do a paired analysis of the somatic vs. dendritic effects for the 7 neurons where we had simultaneous measurements of the pHi changes in both the soma and dendrites. In this paired analysis, we saw a slightly larger acidification the farther down the dendrite, which was just significant at 50–100 μm (Fig. 6C). Further, the rate of acidification induced by hypercapnia was faster the farther down the dendrite for all 7 neurons and the paired analysis showed that the rate was significantly faster at all distances down the dendrite when compared to the soma. Finally, acidification in the dendrites was significantly faster at 50–100 μm from the edge of the soma than at regions of the dendrite closer to the soma (Fig. 6D).
Figure 6.
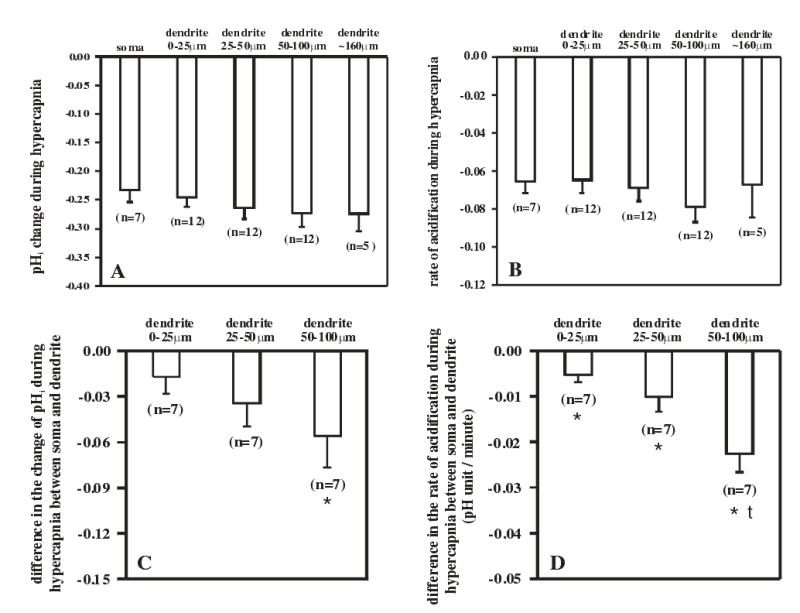
A comparison of the magnitude and the rate of hypercapnia-induced acidification in the soma and dendrites of LC neurons. A: A comparison of the magnitude of hypercapnia-induced acidification of the soma and of four dendritic regions. The mean values (± 1 SEM) for the magnitude of hypercapnia-induced acidification in various regions of LC neuron are shown and do not differ among the various regions. B. The mean values (± 1 SEM) for the rate of acidification induced by hypercapnia in various regions of LC neurons. The rates for the various regions are not significantly different. C. The paired difference (mean ± 1 SEM) between the magnitude of acidification for a particular region of the dendrite and the acidification of the soma for 7 neurons (like the one shown in Fig. 5A) where we have values for both the soma and dendrites. Only for the most distant dendritic region is the magnitude of acidification significantly larger than the acidification of the soma. The values for the three dendritic regions do not differ significantly from one another. D: The paired difference (mean ± 1 SEM) between the rate of acidification for a particular region of the dendrite and the rate of acidification of the soma for 7 neurons (like the one shown in Fig. 5A) where we have values for both the soma and dendrites. All three dendritic regions acidify significantly more rapidly than the soma, and the most distant dendritic region acidifies significantly more rapidly than the other dendritic regions. An * indicates that the difference value is significantly different from 0 (P<0.05) and a † indicates that the difference value for a dendritic region is different from the other the values for the other two regions (P<0.05).
We also found that neither the soma nor any of the regions of the dendrite exhibited pHi recovery during exposure to hypercapnia (e.g. Figs. 1A, 2 & 5B). There was actually a slight additional acidification during the hypercapnic exposure that did not differ among the soma and the various dendritic regions (ANOVA, P>0.84) and amounted to −0.007 ± 0.003 pH unit/min (n=48).
As expected, the firing rate response to hypercapnia with 15% CO2 was somewhat larger than the response to hypercapnia with 10% CO2. In control solution (5% CO2), the firing rate was 0.90 ± 0.21 Hz (n=7), which increased by 139 ± 33% (to 1.89 ± 0.32 Hz) in response to 15% CO2, and returned to control values (0.82 ± 0.19 Hz) when again exposed to control solution.
Response to NH4Cl prepulse in dendrites vs. soma.
Since there was no pHi recovery during hypercapnic acidosis in any region of LC neurons, we wanted to verify whether or not the dendrites had the ability to regulate pHi during an acid load. We previously showed that the soma exhibits pH recovery during an acid load if pHo is maintained constant, as occurs during an NH4Cl prepulse (33). We therefore exposed the slices to an NH4Cl prepulse and measured pHi recovery from acidification to a pHi of around 6.9. The soma as well as all regions of the dendrite exhibited pHi recovery (Fig. 7A). Furthermore, the rates of recovery in the soma and the three regions of the dendrite were all similar (Fig. 7B).
Figure 7.
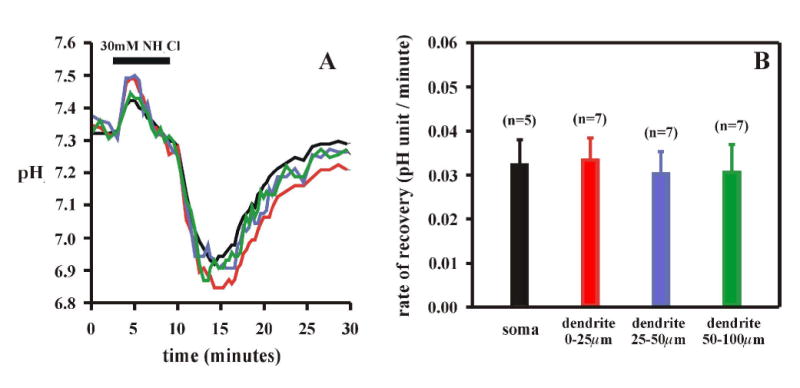
A: The pHi response to an NH4Cl prepulse (30 mM) of the soma and of three dendritic regions (0–25, 25–50 and 50–100 μm from the soma) of LC neurons. B: Mean values (± 1 SEM) of the rate of pHi recovery from an NH4Cl prepulse-induced acidification in the soma and in the three dendritic regions. None of the recovery rates differed significantly among the various regions.
We used the change in pHi upon removal of NH4Cl to estimate the buffering power (4) in the dendrites and the soma (e.g. Fig. 7A). The buffering power determined in this way will -include the intrinsic buffering power and the open buffering power due to intracellular HCO3 and is an overestimate due to the presence of pHi recovery (4). Nevertheless, our values can serve as an estimate for a comparison of buffering power in the dendrites vs. the soma. The overall buffering power (intrinsic plus HCO3− buffering) did not differ between the soma and the dendrites at 0–25, 25–50 and 50–100 μm from the soma (ANOVA, P>0.39) and averaged 74.9 ± 3.5 mM/pH unit (n=28). Estimating buffering power due to intracellular HCO3− yielded a value of about 30 mM/pH unit, which would mean intrinsic buffering power in the soma and dendrites of LC neurons is about 45 mM/pH unit, similar to values of intrinsic buffering power reported for medullary neurons (7,32).
Firing rate response to acidification of dendrites or soma.
Both the soma and dendrites exhibit a similar pHi response to hypercapnia, but the basic question that remains is whether exposing dendrites, soma or both is required for activation of chemosensitive LC neurons. To address this question, we measured the firing rate of LC neurons while microinjecting hypercapnic solution over a dendrite or the soma. The response of a representative LC neuron is shown in Fig. 8. An LC neuron was patched and loaded with pyranine, so that the soma and dendrites (2 are visible) could be seen (Fig. 8A). A separate microinjection pipette, loaded with hypercapnic acidotic solution containing pyranine, was placed such that solution could be microinjected on a dendrite only (Fig. 8B, arrowheads show region being superfused). Upon cessation of microinjection, the hypercapnic solution washed off the dendrite (Fig. 8C). When the pipette was moved closer to the soma and the microinjection repeated, solution now covered the dendrite and the soma (Fig. 8D). Once again, the hypercapnic solution washed away upon cessation of microinjection (Fig. 8E). The microinjection pipette was then moved adjacent to the soma and hypercapnic acidotic solution was microinjected on the soma and the proximal dendrites as well (Fig. 8F). Finally, cessation of microinjection resulted once again in the hypercapnic solution being washed away (Fig. 8G). This neuron had a spontaneous integrated firing rate of about 0.5 Hz that was largely unaffected by exposure of a dendrite to hypercapnia (Fig. 8, region B in bottom trace). However, when hypercapnic solution covered the soma as well (Figs. 8D and F), firing rate was markedly increased (Fig. 8, regions D and F in bottom trace). This hypercapnia-induced increased firing rate was reversible with the firing rate returning to initial values upon removal of the hypercapnic solution (Fig. 8, regions E and G in bottom trace).
Figure 8.
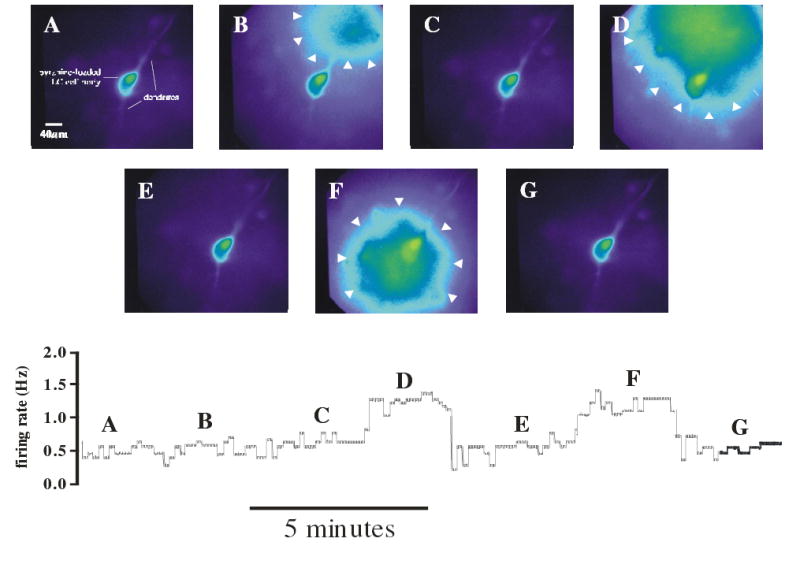
Microinjection of hypercapnic acidotic solution on a dendrite or soma of an LC neuron and its effect on firing rate. A. An LC neuron patched with a whole cell pipette and loaded with pyranine. The soma and two dendrites are evident. B. A hypercapnic solution was microinjected for 2 min over one of the dendrites using a pipette filled with hypercapnic solution containing pyranine that was positioned over the distal region of a dendrite. The area covered by the hypercapnic solution was visualized as the extracellular pyranine fluorescence and encompassed a region approximately 100 μm in diameter (indicated by white arrowheads). C. The microinjection was stopped and the extracellular hypercapnic solution rapidly washed away. D. The microinjection pipette was moved to a more proximal dendritic position and the microinjection repeated. In this case, the area encompassed by the hypercapnic solution included a proximal dendrite and the soma (white arrowheads). E. Once again, the microinjection was stopped and the external solution allowed to return to normal. F. The microinjection pipette was moved adjacent to the soma and the microinjection repeated. The hypercapnic solution covered the soma and the proximal dendrites. G. The microinjection was stopped and the hypercapnic solution allowed to wash away. Lower Panel: The integrated firing rate of the LC neuron depicted in A–G. The firing rate corresponding to each image is indicated by the letter of that image above the firing rate trace. Note that the hypercapnic solution did not increase firing rate when microinjected over a distal dendrite (point B), but increased firing rate reversibly when microinjected over the proximal dendrites and soma (points D and F).
A summary of the response of 5 neurons exposed to hypercapnia either on the dendrites or the soma is shown in Fig. 9A. Compared to the control integrated firing rate of neurons in normocapnic solution, neurons exposed to hypercapnia only on a dendrite showed no significant increase in firing rate. However, neurons exposed on both a dendrite and soma, or on the soma alone, showed a significant increase in firing rate of about 130% (Fig. 9A). This increase was compared to the increase in firing rate of LC neurons induced by solutions equilibrated with CO2 of different levels superfused over the whole slice (Fig. 9C). Firing rate increased in LC neurons exposed to 10% CO2 and increased more in neurons exposed to 15% CO2. At higher levels of hypercapnia (20% CO2) LC neurons exhibited no further increased firing rate (Fig. 9C), plateauing at an increase of firing rate of about 150%. For comparison, our values for increased firing rate when microinjecting hypercapnic solution over the soma are shown in Fig. 9C. It can be seen that exposing the soma to hypercapnic solution elicited a near maximal firing rate response for LC neurons to hypercapnia.
Figure 9.
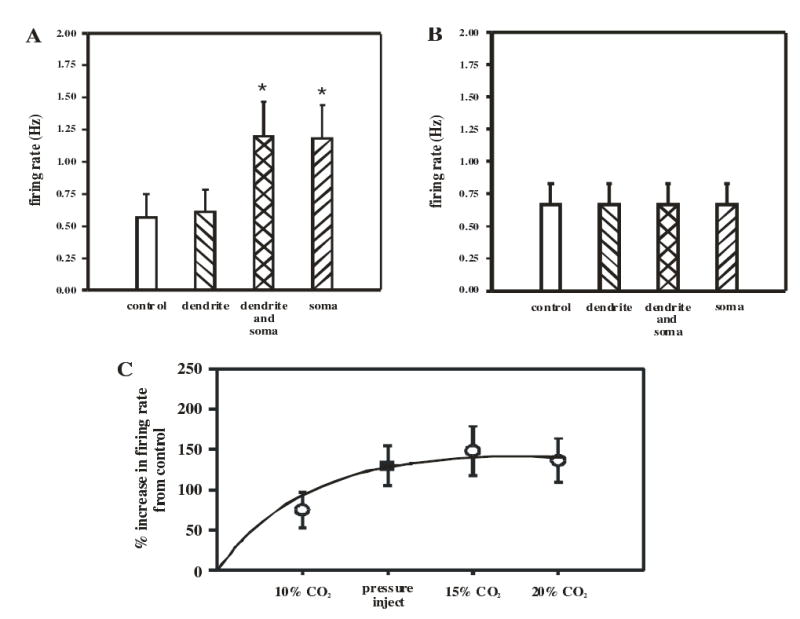
The summary of the firing rate responses to focal microinjection of hypercapnic solutions in LC neurons. A. The mean (± 1 SEM; n=5) of the firing rate when LC neurons are exposed to control solution and microinjection of hypercapnic solution over the distal dendrites alone, the proximal dendrites and soma, and the soma. The firing rate increases significantly (*) only when the area covered by the hypercapnic solution includes the soma. B. The mean (± 1 SEM; n=4) of the firing rate when LC neurons are exposed to microinjection of control solution (equilibrated with 5% CO2) over the distal dendrites, the proximal dendrites and soma, and the soma. There was no increase in firing rate when normocapnic solution was microinjected over any area of LC neurons. C. The relationship of the % increase in firing rate of LC neurons when the whole slice is superfused (open circles) with solution equilibrated with different levels of hypercapnic (from 10–20% CO2). The % increase in firing rate increases with the degree of hypercapnia up to 15% CO2 and then plateaus. Each point represents the mean % increase in firing rate (± 1 SEM; n=9). The filled square represents the mean (± 1 SEM; n=5) % increase in firing rate with microinjection of hypercapnic solution over the soma of LC neurons. Note this microinjection induces a near maximal increase in firing rate.
LC neuron firing rate responses to hypercapnia have been shown to be an intrinsic response (21), but we do not know if the entire response here reflects intrinsic responses or are in part mediated by synaptic events.
We were concerned that our increase in firing rate was due to mechanical disruption of the whole cell patch upon microinjection of solution and not to the hypercapnic solution. We thus repeated the experiments as shown in Fig. 8, but using microinjection pipettes filled with control solution equilibrated with 5% CO2. Microinjection of this control solution, whether on a dendrite or the soma, did not result in any increase in the spontaneous firing rate (Fig. 9B). Thus, the increased firing rate we see with microinjection of hypercapnic solution appears to be due to the hypercapnia and not to any mechanical disturbance.
DISCUSSION
In this study we compared the somatic versus the dendritic responses to hypercapnia in LC neurons from neonatal rats. The main findings are that, surprisingly, exposure of the soma, but not a dendrite, of chemosensitive LC neurons to hypercapnia results in an increased firing rate, while the response of pHi to hypercapnia in the dendrites and soma of LC neurons is the same. This is the first study to address the CO2 sensitivity of the dendrites vs. the soma in central chemosensitive neurons and our findings have implications for models of cellular chemosensitive signaling.
Our model system.
We studied chemosensitive neurons from the LC region of brainstem slices of neonatal rats. The LC is a dorsal pontine region that contains largely noradrenergic neurons and its role in ventilatory control is uncertain. The LC contains the highest percentage (>80%) of CO2-activated neurons of any brainstem region (12,21,26), these neurons have been shown to be intrinsically sensitive to hypercapnia (21), focal acidification of the LC results in increased ventilation (18), and ablation of catecholaminergic neurons (including 80% of the LC neurons) blunts the response of ventilation to hypercapnia (19). On the other hand, LC neurons have the smallest firing rate response for a given acidic stimulus of any chemosensitive neurons (26) and lesions of LC neurons with kainic acid result in at most a modest effect on hypercapnia-induced ventilation (11). It has been proposed that the LC may also play a role in hypercapnia-induced anxiety (26).
Since the ventilatory response is known to change with development (25,36), our findings with neonates might not reflect the properties of adult LC neurons. We have previously shown that both the percentage of CO2-activated neurons and the magnitude of their response, is the same in slices from neonatal rats age P1–P21 and that these values are similar to adult values (25,36). Thus we believe that the values measured here are not affected by development and may well reflect the responses of adult LC neurons as well.
The few previous studies comparing neuronal pHi responses between the soma and dendrites have used isolated neurons and neurons stimulated electrically (35,39,43). Because we are using slices superfused with hypercapnic solutions, our measured rates of hypercapnia-induced acidification will be a complex function of the rate of superfusion of the slice, the depth within the slice of the soma and dendrites being measured, the surface area to volume ratio of the structure being acidified, and the cell buffering power. We were able to control the depth of the structure being studied within the slice by measuring soma and dendrites at the same focal plane (and thus at the same depth within the slice) (e.g. Fig. 4). Further, the intracellular buffering power was the same in the soma and dendrites. Nevertheless, superfusion and diffusion are likely to contribute substantially to the rate of acidification of LC neurons within a slice.
The use of slices offers several advantages. Access to individual neurons (both soma and dendrite) can easily be obtained, facilitating the simultaneous measurement Vm and pHi. With the exception of some dendritic pruning (e.g. Fig. 4), LC neurons maintain a near normal morphology compared to in vivo (9). Finally, the normal association of neurons with glia in the slice offers a more nearly physiological condition than in reduced preparations and will allow for the study of potential roles of glia in neuronal responses to hypercapnia.
We visualized and studied pHi simultaneously in the soma and in dendrites to at least 100 μm from the edge of the soma (Fig. 5). We were able to visualize dye-loaded dendrites farther than 100 μm, but to do this we had to increase the excitation light and increase system gain (e.g. Fig. 4). This resulted in saturation of the dye signal from the soma which precluded accurate measurements of pHi from the soma. Other studies using a similar technique to load either pyranine (43) or Oregon Green BAPTA (a calcium sensitive dye) (38) into the soma and dendrites of neurons had a similar phenomenon of very high fluorescence in the soma, and some of the observed lack of response of pHi or Cai in the soma vs. the dendrites may have been due to dye saturation. Thus, to measure fluorescence in both the soma and the dendrites, care must be taken not to saturate the fluorescence of the soma. More distal regions could be studied by using higher dye concentrations or greater system gain, using confocal microscopy, or using detached neurons, where the neuron is loaded and the patch pipette is removed (Fig. 2). We used this latter approach to study dendrites to about 160 μm from the edge of the soma (Fig. 6).
Morphology of LC neurons.
The morphology of our cells was most similar to multipolar neurons previously described in LC neurons (9). The neurons have large, pyramidal somata with an average of 4 primary and 4 secondary dendrites. These dendrites have a fairly uniform diameter of between 2–2.5 μm over most of their length (9). Primary dendrites in neurons from 30 day old rats extend about 350 μm from the soma, although dendrites have been shown to increase in length after day P15 in other brainstem neurons (40). We were able to visualize much of the structure of LC neurons within about 160 μm from the edge of the soma (Figs. 4 and 6). Thus, we are probably measuring pHi in at least the first half, and perhaps much more, of the primary dendrites in this study. However, we may not be studying pHi in dendrites to their farthest extension. Further study is necessary to determine if the pHi response to hypercapnia in the farthest reaches of the dendrites may differ from the responses seen here.
Dendritic vs. somatic pHi responses to hypercapnia.
The responses of dendrites and soma can differ under various conditions. The pHi of neurites was 0.2–0.3 more alkaline than that of the soma in PC12 cells (10). Repetitive firing resulted in acidification of the soma but no change in dendritic pHi in expiratory neurons from the ventral respiratory group (3), and a faster and larger acidification in the lamellipodia of snail neurons (35) and in the dendrites of cerebellar Purkinje for depolarization-induced calcium cells (43) than in the soma of these cells. Faster and larger responses in the dendrites vs. the soma is also seen transients in snail (35) and hippocampal neurons (38). Further, the complement of channels on the surface membrane of dendrites may differ from those on the membrane of the soma. For example, voltage-gated K+ channels reside on the somatic membrane and may be largely absent in dendrites (30) or decrease along the dendrite away from the soma (16). Also, in chemosensitive olfactory neurons, voltage-gated K+ channels are fairly uniformly distributed across the neuron while voltage-gated Cl− channels are present in much higher density in the dendrites. Thus, substantial differences can exist both in the membrane properties and intracellular responses of dendrites vs. soma.
We have made the first measurements of the effects of hypercapnia on dendritic vs. somatic pHi changes in chemosensitive neurons. We found the rate of acidification was somewhat greater (Figs. 5 and 6) in the dendrites than in the soma, but this effect was far smaller than expected based on the larger dendritic surface area to volume ratio. That dendrites showed only a slightly faster rate of acidification suggests that perfusion and diffusion contribute substantially to the rate of acidification of LC neurons within the slice. It may be that in vivo, LC neuron dendrites will respond even faster than the soma to hypercapnia.
In all other respects, the pHi responses to hypercapnia of the dendrites from LC neurons were remarkably similar to the responses of the soma. Both had a similar magnitude of acidification in response to 15% CO2 (~0.25 pH unit) (Fig. 6A), neither exhibited any pHi recovery from hypercapnia-induced acidification during maintained hypercapnia (Fig. 5B), both had a similar total buffering power (~75 mM/pH unit) and similar intrinsic buffering power (~45 mM/pH unit), and both showed a similar rate of recovery from an NH4Cl prepulse-induced acidification (Fig. 7). This latter observation is interesting. Given the similar rates of pHi recovery and total buffering powers in soma and dendrites, the larger volume to surface area ratio of the soma implies that there must be a larger membrane transport mediated H+ flux across the somatic vs. the dendritic membrane (29). Acid flux in LC neurons appears to be nearly completely mediated by Na+/H+ exchange (NHE) (Ritucci, Dean and Putnam, unpublished observations). Thus, NHE activity must be substantially higher in LC soma vs. LC dendrites. This could be accomplished by either a higher expression of NHE on the somatic membrane or by a higher activity, possibly due to a different isoform, of the NHE present on the somatic vs. the dendritic membrane.
Differences in the firing rate response to local hypercapnic exposure of a dendrite vs. the soma.
Exposure of a dendrite to hypercapnia did not stimulate LC neuron firing rate, while stimulation of the soma gave a near maximal firing rate response (Figs. 8 and 9). This was not due to mechanical effects on the patched soma since exposure of the soma to normocapnic solution did not result in any change in firing rate (Fig. 9B). These data suggest the surprising conclusion that the soma is most involved in chemosensitive signaling in LC neurons. These findings further suggest that the pH-sensitive ion channels that serve as chemosensitive targets (26) must reside preferentially on the soma and perhaps the proximal dendrites of LC neurons.
Chemosensitive signaling has previously been proposed to involve the dendrites (2,14,15,22). Chemosensitive neurons of the ventrolateral medulla send dendritic projections to the ventral surface (15,22), LC neurons have some dendrites that end on the ependyma (1), and medullary raphé neurons have projections that run along the basilar artery (6), all of which would be consistent with the dendrites serving to sense CO2. These previous findings seem to be at odds with our findings of a major role played by the soma in chemosensitive signaling. However, our studies do not rule out a potential role for the dendrites. We have only excited one portion of one dendrite (Fig. 8A–C), and it may require a hypercapnic exposure of a larger portion of the dendritic field to increase LC neuron firing rate. Alternatively, dendritic endings closely associated with the brainstem surface (15,22) or large arteries (6) may be highly adapted to respond to hypercapnia, although this response would have to be very powerful for a few endings to activate an action potential in the distant soma. Finally, chemosensitive signaling may be different in LC neurons compared to neurons from other chemosensitive areas. No direct evidence for differences in signaling exists, but there are differences in the percentage and the magnitude of the response of chemosensitive neurons from various brainstem areas (26).
Given that a maintained fall of pHi in response to hypercapnia is an important aspect of signaling in central chemosensitive neurons (12,27), our findings of a maintained intracellular acidification induced by hypercapnia in both the dendrites and soma are consistent with either a dendritic or a somatic source of chemosensitive signaling, or both. In contrast, our direct measurements of hypercapnia-induced increased firing rate in LC neurons shows that exposure of the soma is most important. These data imply that LC neurons seem to be sensing CO2 over a broad expanse of tissue, including the soma and perhaps the proximal regions of the dendrites, and not just from a localized region. This would be consistent with a sensor that responds to global, rather than local, changes of CO2.
Acknowledgments
We thank Phyllis Douglas for technical assistance. This work was supported by a National Institutes of Health Grant R01-HL-56683.
References
- 1.Andrzejewski M, Mückenhoff K, Scheid P, Ballantyne D. Synchronized rhythms in chemosensitive neurons of the locus coeruleus in the absence of chemical synaptic transmission. Resp Physiol. 2001;129:123–140. doi: 10.1016/s0034-5687(01)00300-0. [DOI] [PubMed] [Google Scholar]
- 2.Ballantyne D, Scheid P. Central chemosensitivity of respiration: a brief overview. Resp Physiol. 2001;129:5–12. doi: 10.1016/s0034-5687(01)00297-3. [DOI] [PubMed] [Google Scholar]
- 3.Ballanyi K, Mückenhoff K, Bellingham MC, Okada Y, Scheid P, Richter DW. Activity-related pH changes in respiratory neurones and glial cells of cats. Neuroreport. 1994;6:33–36. doi: 10.1097/00001756-199412300-00010. [DOI] [PubMed] [Google Scholar]
- 4.Boron WF. Intracellular pH transients in giant barnacle muscle fibers. Am J Physiol Cell Physiol. 1977;233:C61–C73. doi: 10.1152/ajpcell.1977.233.3.C61. [DOI] [PubMed] [Google Scholar]
- 5.Boron WF, De Weer P. Intracellular pH transients in squid giant axons caused by CO2, NH3, and metabolic inhibitors. J Gen Physiol. 1976;67:91–112. doi: 10.1085/jgp.67.1.91. [DOI] [PMC free article] [PubMed] [Google Scholar]
- 6.Bradley SR, Pieribone VA, Wang W, Severson CA, Jacobs RA, Richerson GB. Chemosensitive serotonergic neurons are closely associated with large medullary arteries. Nature Neurosci. 2002;5:401–402. doi: 10.1038/nn848. [DOI] [PubMed] [Google Scholar]
- 7.Chambers-Kersh L, Ritucci NA, Dean JB, and Putnam RW. Response of intracellular pH to acute anoxia in individual neurons from chemosensitive and nonchemosensitive regions of the medulla. In: Oxygen Sensing: Molecule to Man, edited by Lahiri S, Prabhakar N and Forster II RE. New York: Kluwer Academic/Plenum Publishers, 2000, p. 453–464. [DOI] [PubMed]
- 8.Dean JB and Reddy RB. Effects of intracellular dialysis on CO2/H+ chemosensitivity in brain stem neurons. In: Ventral Brainstem Mechanisms and Control of Respiration and Blood Pressure, edited by Trouth CO and Millis RM. New York: Marcel Dekker, 1995, p. 453–461.
- 9.Diaz-Cintra S, Cintra L, Kemper T, Resnick O, Morgane PJ. The effects of protein deprivation on the nucleus locus coeruleus: A morphometric Golgi study in rats of three age groups. Brain Res. 1984;304:243–253. doi: 10.1016/0006-8993(84)90327-5. [DOI] [PubMed] [Google Scholar]
- 10.Dickens CJ, Gillespie JI, Greenwell JR. Interactions between intracellular pH and calcium in single mouse neuroblastoma (N2A) and rat pheochromocytoma cells (PC12) Quart J Exp Physiol. 1989;74:671–679. doi: 10.1113/expphysiol.1989.sp003319. [DOI] [PubMed] [Google Scholar]
- 11.Erlichman JS, Budd T., Graham M, Lawless R, Murray S., Zugermayr M, and Leiter JC. Role of the locus coeruleus in ventilatory control in the awake rat. Soc. Neurosci. Abstr. Program No. 609.5, 2003.
- 12.Filosa JA, Dean JB, Putnam RW. Role of intracellular and extracellular pH in the chemosensitive response of rat locus coeruleus neurones. J Physiol. 2002;541.2:493–509. doi: 10.1113/jphysiol.2001.014142. [DOI] [PMC free article] [PubMed] [Google Scholar]
- 13.Filosa JA, Putnam RW. Multiple targets of chemosensitive signaling in locus coeruleus neurons: role of K+ and Ca2+ channels. Am J Physiol Cell Physiol. 2003;284:C145–C155. doi: 10.1152/ajpcell.00346.2002. [DOI] [PubMed] [Google Scholar]
- 14.Huang R-Q, Erlichman JS, Dean JB. Cell-cell coupling between CO2-excited neurons in the dorsal medulla oblongata. Neuroscience. 1997;80:41–57. doi: 10.1016/s0306-4522(97)00017-1. [DOI] [PubMed] [Google Scholar]
- 15.Kawai A, Ballantyne D, Mückenhoff K, Scheid P. Chemosensitive medullary neurones in the brainstem-spinal cord preparation of the neonatal rat. J Physiol. 1996;492.1:277–292. doi: 10.1113/jphysiol.1996.sp021308. [DOI] [PMC free article] [PubMed] [Google Scholar]
- 16.Korngreen A, Sakmann B. Voltage-gated K+ channels in layer 5 neocortical pyramidal neurones from young rats: subtypes and gradients. J Physiol. 2000;525.3:621–639. doi: 10.1111/j.1469-7793.2000.00621.x. [DOI] [PMC free article] [PubMed] [Google Scholar]
- 17.Mulkey DK, Henderson RAI, Ritucci NA, Putnam RW, Dean JB. Oxidative stress decreases pHi and Na+/H+ exchange and increases excitability of solitary complex neurons from rat brain slices. Am J Physiol Cell Physiol. 2004;286:C940–C951. doi: 10.1152/ajpcell.00323.2003. [DOI] [PubMed] [Google Scholar]
- 18.Nattie EE. Central chemosensitivity, sleep, and wakefulness. Resp Physiol. 2001;129:257–268. doi: 10.1016/s0034-5687(01)00295-x. [DOI] [PubMed] [Google Scholar]
- 19.Nattie EE and Li A Brainstem catecholaminergic neurons participate in central chemoreception in NREM sleep and wakefulness. Soc. Neurosci. Abstr. Program No. 145.9, 2004.
- 20.Nottingham S, Leiter JC, Wages P, Buhay S, Erlichman JS. Developmental changes in intracellular pH regulation in medullary neurons of the rat. Am J Physiol Regul Integrat Comp Physiol. 2001;281:R1940–R1951. doi: 10.1152/ajpregu.2001.281.6.R1940. [DOI] [PubMed] [Google Scholar]
- 21.Oyamada Y, Ballantyne D, Mückenhoff K, Scheid P. Respiration-modulated membrane potential and chemosensitivity of locus coeruleus neurones in the in vitro brainstem-spinal cord of the neonatal rat. J Physiol. 1998;5(132):381–398. doi: 10.1111/j.1469-7793.1998.381bb.x. [DOI] [PMC free article] [PubMed] [Google Scholar]
- 22.Pilowsky P, Llewellyn-Smith IJ, Arnolda L, Lipski J, Minson J, Chalmers J. Are the ventrally projecting dendrites of respiratory neurons a neuroanatomical basis for the chemosensitivity of the ventral medulla oblongata? Sleep. 1993;16:S53–S55. [PubMed] [Google Scholar]
- 23.Pineda J, Aghajanian GK. Carbon dioxide regulates the tonic activity of locus coeruleus neurons by modulating a proton- and polyamine-sensitive inward rectifier potassium current. Neuroscience. 1997;77:723–743. doi: 10.1016/s0306-4522(96)00485-x. [DOI] [PubMed] [Google Scholar]
- 24.Putnam RW. Intracellular pH regulation of neurons in chemosensitive and nonchemosensitive areas of brain slices. Resp Physiol. 2001;129:37 –56. doi: 10.1016/s0034-5687(01)00281-x. [DOI] [PubMed] [Google Scholar]
- 25.Putnam RW, Conrad SC, Gdovin MJ, Erlichman JS, and Leiter JC. Neonatal maturation of the hypercapnic ventilatory response and central neural CO2 chemosensitivity. Resp. Physiol. Neurobiol 2005. IN PRESS. [DOI] [PMC free article] [PubMed]
- 26.Putnam RW, Filosa JA, Ritucci NA. Cellular mechanisms involved in CO2 and acid signaling in chemosensitive neurons. Am J Physiol Cell Physiol. 2004;287:C1493–C1526. doi: 10.1152/ajpcell.00282.2004. [DOI] [PubMed] [Google Scholar]
- 27.Putnam RW, Ritucci NA, and Dean JB. Dendritic vs. somatic changes of intracellular pH (pHi) in response to hypercapnia in chemosensitive neurons from the locus coeruleus (LC). Soc. Neurosci. Abstr.: Program No. 889.17, 2004.
- 28.Putnam RW, Ritucci NA, and Dean JB. Somatic vs. dendritic responses to hypercapnia in chemosensitive locus coeruleus neurons from neonatal rats. Soc. Neurosci. Abstr.: IN PRESS, 2005. [DOI] [PMC free article] [PubMed]
- 29.Putnam RW and Roos A. Intracellular pH. In: Handbook of Physiology. Section 14: Cell Physiology, edited by Hoffman JF and Jamieson JD. New York: Oxford University Press, 1997, p. 389–440.
- 30.Riazanski V, Becker A, Chen J, Sochivko D, Lie A, Wiestler OD, Elger CE, Beck H. Functional and molecular analysis of transient voltage-dependent K+ currents in rat hippocampal granule cells. J Physiol. 2001;537.2:391–406. doi: 10.1111/j.1469-7793.2001.00391.x. [DOI] [PMC free article] [PubMed] [Google Scholar]
- 31.Richerson GB. Response to CO2 of neurons in the rostral ventral medulla in vitro. J Neurophysiol. 1995;73:933 –944. doi: 10.1152/jn.1995.73.3.933. [DOI] [PubMed] [Google Scholar]
- 32.Ritucci NA, Chambers-Kersh L, Dean JB, Putnam RW. Intracellular pH regulation in neurons from chemosensitive and nonchemosensitive areas of the medulla. Am J Physiol Regul Integrat Comp Physiol. 1998;275:R1152 –R1163. doi: 10.1152/ajpregu.1998.275.4.R1152. [DOI] [PubMed] [Google Scholar]
- 33.Ritucci NA, Dean JB, Putnam RW. Intracellular pH response to hypercapnia in neurons from chemosensitive areas of the medulla. Am J Physiol Regul Integrat Comp Physiol. 1997;273:R433 –R441. doi: 10.1152/ajpregu.1997.273.1.R433. [DOI] [PubMed] [Google Scholar]
- 34.Scheid P, Putnam RW, Dean JB, Ballantyne D. Special Issue: Central chemosensitivity. Resp Physiol. 2001;129:1 –278. doi: 10.1016/s0034-5687(01)00297-3. [DOI] [PubMed] [Google Scholar]
- 35.Schwiening CJ, Willoughby D. Depolarization-induced pH microdomains and their relationship to calcium transients in isolated snail neurones. J Physiol. 2002;538.2:371–382. doi: 10.1113/jphysiol.2001.013055. [DOI] [PMC free article] [PubMed] [Google Scholar]
- 36.Stunden CE, Filosa JA, Garcia AJ, Dean JB, Putnam RW. Development of in vivo ventilatory and single chemosensitive neuron responses to hypercapnia in rats. Resp Physiol. 2001;127(2–3):135–155. doi: 10.1016/s0034-5687(01)00242-0. [DOI] [PubMed] [Google Scholar]
- 37.Thomas JA, Buchsbaum RN, Zimniak A, Racker E. Intracellular pH measurements in Erhlich ascites tumor cells utilizing spectroscopic probes generated in situ. Biochemistry. 1979;18:2210–2218. doi: 10.1021/bi00578a012. [DOI] [PubMed] [Google Scholar]
- 38.Tombaugh GC. Intracellular pH buffering shapes activity-dependent Ca2+ dynamics in dendrites of CA1 interneurons. J Neurophysiol. 1998;80:1702 –1712. doi: 10.1152/jn.1998.80.4.1702. [DOI] [PubMed] [Google Scholar]
- 39.Trapp S, Lückermann M, Brooks PA, Ballanyi K. Acidosis of rat dorsal vagal neurons in situ during spontaneous and evoked activity. J Physiol. 1996;496.3:695–710. doi: 10.1113/jphysiol.1996.sp021720. [DOI] [PMC free article] [PubMed] [Google Scholar]
- 40.Vincent A, Tell F. Postnatal changes in electrophysiological properties of rat nucleus tractus solitarii neurons. Eur J Neurosci. 1997;9:1612–1624. doi: 10.1111/j.1460-9568.1997.tb01519.x. [DOI] [PubMed] [Google Scholar]
- 41.Wang W, Bradley SR, Richerson GB. Quantification of the response of rat medullary raphe neurones to independent changes in pHo and PCO2. J Physiol. 2002;540.3:951–970. doi: 10.1113/jphysiol.2001.013443. [DOI] [PMC free article] [PubMed] [Google Scholar]
- 42.Wiemann M, Bingmann D. Ventrolateral neurons of medullary organotypic cultures: intracellular pH regulation and bioelectric activity. Resp Physiol. 2001;129:57 –70. doi: 10.1016/s0034-5687(01)00282-1. [DOI] [PubMed] [Google Scholar]
- 43.Willoughby D, Schwiening CJ. Electrically evoked dendritic pH transients in rat cerebellar Purkinje cells. J Physiol. 2002;544.2:487–499. doi: 10.1113/jphysiol.2002.027508. [DOI] [PMC free article] [PubMed] [Google Scholar]