

Abstract
PELP1 (proline-, glutamic acid-, and leucine-rich protein-1 (also referred to as MNAR, or modulator of non-genomic activity of estrogen receptor)), a recently identified novel coactivator of estrogen receptors, is widely expressed in a variety of 17β-estradiol (E2)-responsive reproductive tissues and is developmentally regulated in mammary glands. pRb (retinoblastoma protein), a cell cycle switch protein, plays a fundamental role in the proliferation, development, and differentiation of eukaryotic cells. To study the putative function of PELP1, we established stable MCF-7 breast cancer cell lines overexpressing PELP1. PELP1 overexpression hypersensitized breast cancer cells to E2 signaling, enhanced progression of breast cancer cells to S phase, and led to persistent hyperphosphorylation of pRb in an E2-dependent manner. Using phosphorylation site-specific pRb antibodies, we identified Ser-807/Ser-811 of pRb as a potential target site of PELP1. Interestingly, PELP1 was discovered to be physiologically associated with pRb and interacted via its C-terminal pocket domain, and PELP1/pRb interaction could be modulated by antiestrogen agents. Using mutant pRb cells, we demonstrated an essential role for PELP1/pRb interactions in the maximal coactivation functions of PELP1 using cyclin D1 as one of the targets. Taken together, these findings suggest that PELP1, a steroid coactivator, plays a permissive role in E2-mediated cell cycle progression, presumably via its regulatory interaction with the pRb pathway.
The steroid hormone 17β-estradiol (E2)1 plays an important role in controlling the expression of genes involved in a wide variety of biological processes, including development, homeostasis, and breast cancer progression (1, 2). The biological effects of estrogen are mediated by its binding to the structurally and functionally distinct estrogen receptors (ERs) ERα and ERβ. ERα is the major ER in mammary epithelium (3). Upon binding of E2 to ERα, the ligand-activated ERα translocates to the nucleus, binds to the 13-bp palindromic estrogen response element (ERE) in the target genes, and stimulates gene transcription, thus promoting cell proliferation (4). In addition to the genomic actions of ER, non-genomic functions are implicated via activation of intracellular signal transduction pathways involved in the regulation of cell proliferation (5–8).
ERα comprises an N-terminal AF1 (activation function-1) domain, a DNA-binding domain, and a C-terminal ligand-binding region that contains an AF2 domain (9). The AF2 ligand-dependent activation function of ERα is located in the ligand-binding domain, whereas AF1 functions in a ligand-independent manner. AF1 and AF2 exhibit cell-type and promoter context specificity (10). Also, the transcription functions of ERs have been shown to be influenced by several coactivators, including SRC1 (steroid receptor coactivator-1), GRIP1, AIB1, CBP (cAMP response element-binding protein-binding protein), p300, PGC1, E6AP, PCAF (p300/CBP associating factor), and SNF2 (11–13). It is generally accepted that some of the diverse functions of estrogens depend on differential recruitment of coregulators to the E2·ER complex. Despite the identification of a number of ER coregulators, the molecular mechanism by which E2 elicits distinct responses in different tissues is not known. Tissue-specific expression of coregulators and availability of novel integrators of signaling are speculated to play a role in the complex signaling elicited by the E2/ER pathway.
E2 regulates cell proliferation in a wide variety of tissues, including mammary glands (14). Evidence suggests that estrogen induces mitogenesis by recruiting non-cycling cells into the cell cycle and increasing the rate of progression from G1 to S phase. Induction of the early-response genes (such as c-myc and c-fos) was proposed as one mechanism of this process (15–17), whereas regulation of CDK2 (cyclin-dependent kinase-2) and CDK4 activities was proposed as another (18–20). In addition, cyclin D1 was identified as a target of E2 action, and estrogen treatment was shown to up-regulate cyclin D1 levels (21). Even though E2-mediated cell cycle progression has been well acknowledged, the molecular mechanisms underlying the regulation of G1/S phase transition remain elusive, as does the regulatory role, if any, ER coregulators play in this process.
pRb (retinoblastoma protein), a cell cycle switch protein, plays a fundamental role in the proliferation, development, and differentiation of eukaryotic cells (22). Accumulating evidence suggests that pRb can act as a positive or negative regulator of transcription, depending on the cellular context (23, 24). Additionally, pRb is a nuclear protein that arrests cells in the G1 phase by repressing the genes required for G1/S phase progression (25). Members of the E2F family of transcription factors are the major targets of pRb (26). Progression of cells from G1 to S phase requires inactivation of pRb via phosphorylation; the phosphorylation status is primarily governed by cyclin D/CDK4 and cyclin E/CDK2 enzymes (23). pRb has also been shown to play a role in cell differentiation and development. Furthermore, expression of a phosphorylation-defective mutant of pRb in a mammary gland leads to ductal growth suppression, precocious differentiation, and adenocarcinoma (27). A number of cellular proteins interact with pRb, including cyclin D1, HDAC1, and Brahma-related gene-1 (BRG1), and oncogenes such as EIA, SV40 antigen, and human papilloma virus E7 (22). These proteins use a conserved LXCXE motif in their binding domain for this interaction (23, 26). Even though both ERs and pRb have been shown to play a role in cell proliferation and differentiation, very little is known about the mechanisms by which ER uses pRb and the role ER coactivators may play in the regulation of pRb functions by E2.
Recently, we cloned a novel ER regulatory protein named PELP1 (proline-, glutamic acid-, and leucine-rich protein-1), which is abundantly expressed in mammary glands; and its expression is developmentally regulated (28). PELP1 is predominantly nuclear in localization, contains 10 nuclear receptor interaction motifs (LXXLL), and functions as an ER coactivator in a ligand-dependent manner. In addition, PELP1 contains a number of potential protein interaction motifs, including proline-rich regions and zinc finger domains and an unusually rich glutamic acid domain in its C-terminal region. However, earlier analysis of the Expressed Sequence Tags Database suggested the possibility of a splice variant of PELP1 missing 435 bp in the N-terminal region (accession numbers gi 19894545, gi 19898760, gi 22814677, and gi 13139213); hence, the name PELP1 was given. A new study using a proteomics approach identified an ER-β-interacting protein that was named MNAR (modulator of non-genomic activity of estrogen receptor) (29). Interestingly, comparison of MNAR cDNA sequence with human genome sequence shows that both PELP1 and MNAR cDNAs are localized to the same region in chromosome 17p13.3 and share >99% DNA sequence homology. The present study was designed to clarify whether PELP1 and MNAR encode the same protein and to further understand the functions of PELP1 using model breast cancer cells over-expressing PELP1. Herein, we present evidence that is consistent with the NCBI gene prediction method (accession number XM_053717) showing that PELP1 and MNAR are the same proteins. Deregulation of PELP1 hypersensitized breast cancer cells to E2 signaling, leading to persistent hyperphosphorylation of pRb and enhanced progression of breast cancer cells to S phase. Our findings also suggest that PELP1 interacts with pRb via its C-terminal pocket domain and that regulatory interactions between PELP1 and pRb are required for PELP1-mediated maximal ER coactivation functions such as cyclin D1 induction by E2. In presenting these findings, we are the first to provide a mechanism by which PELP1 contributes to E2-mediated G1/S phase progression, in addition to its suspected role in ER transcriptional regulation.
MATERIALS AND METHODS
Cell Cultures and Reagents
MCF-7 human breast cancer cells were maintained in Dulbecco’s modified Eagle’s medium/nutrient mixture F-12 (1:1) supplemented with 10% fetal calf serum (28). SAOS2 cells were obtained from American Type Culture Collection (Manassas, VA) and maintained in McCoy’s medium 5A. Dextran-coated charcoal-treated fetal calf serum (DCC serum) and antibodies against vinculin and E2 were purchased from Sigma. Antibodies against ERα were purchased from Upstate Biotechnology, Inc. (Lake Placid, NY). The anti-T7 epitope antibody was purchased from Novagen (Milwaukee, WI). Phosphorylation site-specific pRb antibodies were obtained from Cell Signaling Technology (Boston, MA). The anti-pRb antibody was purchased from NeoMarkers (Fremont, CA). The anti-cyclin D1 antibody was purchased from Santa Cruz Biotechnology (Santa Cruz, CA).
Stable Cells, Synchronization, and Estrogen Treatment
MCF-7 cells stably expressing PELP1 were generated by transfecting full-length PELP1 using FuGENE 6 transfection reagent (Roche Applied Science). Stable clones were selected using G418 (1 mg/ml) selection. Approximately 200 clones were isolated. Twenty clones were screened for selection of individual clones, and the rest were pooled and used as pooled clones. Stable cell lines expressing full-length PELP1 were synchronized in G0 phase via serum starvation for 48 h in phenol red-free Dulbecco’s modified Eagle’s medium with 0.15% serum, and growth was stimulated by supplementation of 5% DCC serum and estrogen. The growth rate of the cells was measured by counting them with a Beckman Coulter Counter. Cell cycle progression was analyzed using a fluorescence-activated cell sorter (BD Biosciences), and CDK2 kinase activity was determined using histone H1 as a substrate following the protocol described previously (19).
Cell Extracts, Immunoblotting, and Immunoprecipitation
To prepare cell extracts, cells were washed three times with phosphate-buffered saline and then lysed in radioimmune precipitation assay buffer (50 mm Tris-HCl (pH 7.5), 150 mm NaCl, 0.5% Nonidet P-40, 0.1% SDS, 0.1% sodium deoxycholate, 1× protease inhibitor mixture (Roche Applied Science), and 1 mm sodium vanadate) for 15 min on ice. The lysates were centrifuged in an Eppendorf centrifuge at 4 °C for 15 min. Cell lysates containing an equal amount of protein (~200 μg) were then resolved on an SDS-polyacrylamide gel (8% acrylamide), transferred to a nitrocellulose membrane, probed with the appropriate antibodies, and developed using either the enhanced chemiluminescence or alkaline phosphatase-based color reaction method. Cell lysates for immunoprecipitation were prepared using Nonidet P-40 lysis buffer (50 mm Tris-HCl (pH 7.5), 100 mm NaCl, 0.5% Nonidet P-40, 1× protease inhibitor mixture, and 1 mm sodium vanadate). Immunoprecipitation was performed for 2 h at 4 °C using 1 μg of antibody/mg of protein.
Northern Analysis
Total RNA was isolated using TRIzol reagent (Invitrogen) following the manufacturer’s protocol. Total RNA (20 μg) was separated on a formaldehyde gel and hybridized in formamide buffer at 42 °C. Northern blots were probed with a 32P-labeled 900-bp PELP1 N-terminal cDNA fragment. A poly(A) blot containing various human tissues was purchased from Clontech. A mouse conceptus full-stage blot was purchased from Seegene (Seoul, Korea) and probed with a 300-bp mouse pelp1 N-terminal fragment. Actin levels were used to assess the integrity of the RNA and as a control for RNA loading. RT-PCR was performed with 1 μg of total RNA, and the RT-PCR kit (Promega, Madison, WI) was used following the manufacturer’s instructions. The primers used for RT-PCR were 5′-gctgtcctcagaagatggtgatgcc-3′ (forward) and 5′-aggatcccaaagcgcaagagccggct-3′ (reverse). Full-length MNAR cDNA in the pcDNA vector was isolated by screening a mammary gland cDNA library (Invitrogen) using 32P-labeled 900-bp PELP1 cDNA as a probe.
GST Pull-down Assay
Plasmids encoding GST-pRb fusion proteins were obtained from the laboratory of Dr. Mark Ewen (Dana-Farber Cancer Institute). Deletion constructs of PELP1 were generated by PCR amplification and subcloning into the pcDNA3.1 vector. In vitro translation of pcDNA3.1-PELP1 (amino acids 1–330) was performed using a TnT kit (Promega) in the presence of [35S]methionine. GST pull-down assays were performed as described previously (28). Eluates were separated by 10% SDS-PAGE and developed using a PhosphorImager.
Reporter Gene Assays
For reporter gene transient transfections, MCF-7 or SAOS2 cells were cultured for 24 h in minimal essential medium without phenol red-containing 5% DCC serum. ERE-luciferase or cyclin D1-luciferase reporter constructs were cotransfected with or without PELP1 and the pRb expression plasmid using FuGENE 6 according to the manufacturer’s instructions. Twenty-four hours later, cells were treated with E2 for 24 h. Cells were then lysed with passive lysis buffer, and the luciferase assay was performed using a luciferase reporter assay kit (Promega). The total amount of DNA used in the transfections was kept constant by adding a parental vector. Each transfection was carried out in six-well plates in triplicate wells.
RESULTS
PELP1 and MNAR Are Identical Proteins
Localization of PELP1 and MNAR cDNAs to the same region of chromosome 17p13.3 raised the possibility that the PELP1 and MNAR proteins are generated from the same gene. Even though MNAR cDNA (GenBankTM/EBI accession number AF547983) shows 99% similarity to PELP1 cDNA (accession number U88153.2), there are two differences between them: 1) an extra 435-bp region in PELP1, which is absent in MNAR (Fig. 1A), and 2) at the protein level in few amino acids localized to small pockets. PELP1 has many GC-rich regions and repetitive amino acids (stretches of proline and glutamic acids), which may give rise to errors during sequencing and lead to localized loss or gain of a base in the region of 10–15 bp and thus artificially create errors in the protein reading frame of a few amino acids. To test this hypothesis, we resequenced the PELP1 plasmid, designing multiple primers closer to the region where the differences were observed. The results show sequencing errors at six places, and correcting them makes MNAR 100% identical to PELP1 except for the presence of an extra 435 bp in PELP1 (the corrected sequence and its comparison with MNAR are shown as a supplemental figure). Because PELP1 and MNAR are identical except for an extra 435 bp in PELP1, this suggests that PELP1 and MNAR are isoforms of the same gene. To test this hypothesis, we performed a Northern blot analysis of various human tissues using the 900-bp N-terminal region present in both PELP1 and MNAR cDNAs as a probe. The results show the presence of a single transcript of ~3.5 kb (Fig. 1B). We then investigated the possibility that PELP1 and MNAR are expressed differentially during development using total RNA from murine embryos in different stages. The results show the expression of a single transcript of ~3.5 kb that was differentially regulated in various stages (Fig. 1C).
Fig. 1. PELP1 and MNAR are identical proteins.
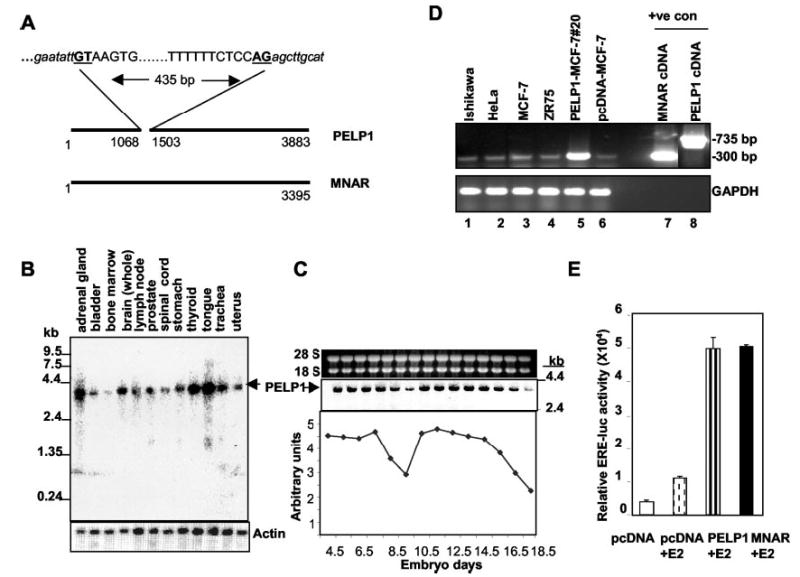
A, shown is a schematic diagram of PELP1 and MNAR cDNAs. Consensus sites for splicing are underlined. B, shown are the results from Northern analysis of PELP1 expression using a poly(A)+ blot and 900-bp PELP1 N-terminal cDNA as a probe. C, shown are the results from Northern analysis of PELP1 expression using a murine total RNA blot containing total RNA isolated from mouse embryos at the indicated time points and using the 300-bp N-terminal region of mouse pelp1 as a probe. D, shown are the results from RT-PCR analysis of total RNA isolated from various cells. pcDNA- or PELP1-expressing stable clones were analyzed by RT-PCR using primers spanning the extra 435-bp region present in PELP1. Plasmids encoding PELP1 and MNAR cDNAs were used as positive controls. ±ve con, positive control; GAPDH, glyceraldehyde-3-phosphate dehydrogenase. E, HeLa cells were cotransfected with ERE-luciferase (luc) and the ER expression plasmid with or without PELP1 or MNAR plasmids, and reporter activity was measured after treating cells with E2 for 24 h.
Further examination of the extra 435-bp region of PELP1 showed that it contains consensus intron splice sites at both ends (GTAAGTG . . . TTCTCCAG (Fig. 1A). Because we failed to detect two mRNA species, this raises the possibility that the PELP1 cDNA we initially isolated was an immature transcript. This hypothesis is supported by the fact that cellular poly(A)+ RNA usually contains a considerable amount of heteronuclear RNA, including premature forms of cytoplasmic RNA (30–32). If the initial PELP1 clone is an immature transcript containing an unspliced intron, then following transfection into cells, it should be spliced out and generate a mature mRNA of the same size as the endogenous transcript. We examined this possibility first by RT-PCR using primers 890–916 (forward) and 1625–1599 (reverse), which are outside the extra 435-bp region (nucleotides 1068–1503) present in PELP1. If PELP1 RNA synthesized from the pcDNA vector is spliced properly, then RT-PCR will generate a 300-bp fragment; and if unspliced, it will generate a 735-bp fragment. In all four cell lines we examined, we observed only 300-bp fragments, suggesting that endogenous PELP1 mRNA does not have the extra 435-bp region observed in PELP1 cDNA (Fig. 1D, lanes 1–4). As suspected, stable expression of T7-tagged PELP1 cDNA in breast cancer cells showed a prevalent band of 300 bp, rather than the expected 735 bp (Fig. 1D, lane 5). Both PELP1 and MNAR cDNAs activated ER-mediated transcriptional activation of the ERE-luciferase reporter in a similar fashion (Fig. 1E). We then examined whether any expressed sequence tag cDNA clones present in the GenBankTM/EBI Data Bank contain this 435-bp region and found that all 12 expressed sequence tag clones matching the N-terminal region lack it. Collectively, these observations suggest that PELP1 and MNAR encode an identical protein, and the PELP1 cDNA we initially isolated contains a 435-bp intron that is efficiently spliced out in epithelial cells to generate mature PELP1 mRNA.
PELP1 Expression Causes Hypersensitivity to E2 Signaling
To understand the mechanism by which PELP1 may contribute to E2-mediated signaling, we established MCF-7/PELP1 stable clones as model cells. We characterized two individual clones (PELP1 clones 13 and 20) and one PELP1 pooled clone in this study. As a control, two pcDNA vectors expressing pcDNA clone 1 and the pcDNA pooled clone were used. Northern analysis showed that mRNA expressed from PELP1 cDNA migrated to the same distance as endogenous PELP1 (Fig. 2A). Expressed T7-PELP1 protein showed a similar size as endogenous PELP1 in Western analysis and migrated as a 160-kDa protein (Fig. 2B). Stable clones showed 3–4-fold overexpression of T7-PELP1 compared with endogenous PELP1. To determine whether overexpression of PELP1 hypersensitizes breast cancer cells to E2 action, MCF-7 cells expressing pcDNA clone 1, the pcDNA pooled clone, PELP1 clones 13 and 20, and the PELP1 pooled clone were treated with 10−9 m E2 for 8 h, and the expression status of the E2-responsive gene pS2 was analyzed by Northern blotting. As shown in Fig. 2C, PELP1 overexpression resulted in a significant 7–8-fold induction of pS2 mRNA expression compared with a 4-fold induction in the pcDNA clones. As expected, PELP1-overexpressing cells were hypersensitive to estrogen as evaluated in ERE-luciferase reporter transactivation assays (Fig. 2D). These results suggest that deregulated expression of PELP1 contributes to increased hormonal sensitivity of breast cancer cells.
Fig. 2. PELP1 promotes hypersensitivity to E2 action.
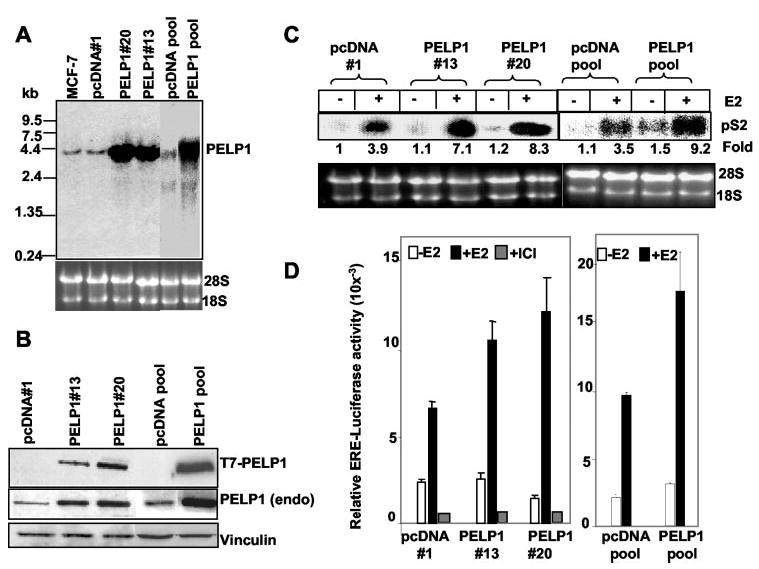
A, total RNA was isolated from pcDNA- and PELP1-expressing clones, and PELP1 expression was analyzed by Northern blotting with a 900-bp fragment coding the N-terminal region of PELP1 as a probe. B, total cell lysates from pcDNA- and PELP1-expressing clones were analyzed by Western blotting with an anti-T7 monoclonal antibody, and the membrane was stripped and reprobed using PELP1 antiserum that recognizes endogenous (endo) PELP1. Vinculin was used as a loading control. C, pcDNA- and PELP1-expressing clones were cultured for 48 h in 5% DCC serum and treated with or without E2 for 8 h. Expression of the E2-responsive gene pS2 was analyzed by Northern blotting with a 300-bp pS2 cDNA fragment as a probe. D, pcDNA- and PELP1-expressing clones were cultured for 48 h in DCC serum, transfected with a ERE-luciferase reporter gene, and treated with or without E2 for 24 h. The luciferase activity was then measured. ICI, ICI 182780.
PELP1 Expression Accelerates E2-mediated Cell Cycle Progression
E2 regulates cell proliferation in a wide variety of tissues (17). Because PELP1 is a coactivator of ER (28, 29) and PELP1-expressing cells are hypersensitive to E2, we next examined PELP1 overexpression to investigate whether it accelerates the growth of breast cancer cells in response to E2 stimulation. pcDNA- and PELP1-expressing stable clones were cultured in medium containing 5% DCC serum for 48 h and treated with or without E2 (10−9 m) for 72 h, and the cell numbers were determined using a Coulter Counter. PELP1-expressing cells showed a 35–50% increase in cell number compared with pcDNA-transfected cells (Fig. 3A). To further validate the effect of PELP1 on cell cycle progression, we next synchronized cells in G0/G1 phase by growing them in 0% DCC serum for 48 h and treating them with or without E2 for 20 h; the status of the cell cycle was analyzed by flow cytometry (Fig. 3B). The results show a clear effect of PELP1 on the accelerated G1/S phase progression of the cells compared with the control pcDNA clones (Fig. 3C). To confirm these findings, we next sought to determine whether the enhanced G1/S phase transition was also accompanied by associated biochemical alterations. The pcDNA and PELP1 clone-expressing cells were treated with or without E2 for 20 h, and the CDK2 kinase activity was determined in an in vitro kinase assay using histone H1 as a substrate (Fig. 3D). Consistent with the cell cycle analysis, PELP1 clones had a 3–4-fold increase in CDK2 kinase activity. These results suggest that PELP1 overexpression sensitizes cells to E2-mediated G1/S phase progression.
Fig. 3. PELP1 accelerates E2-mediated cell cycle progression.

A, pcDNA- and PELP1-expressing clones were cultured in 5% DCC serum for 48 h and treated with or without E2 for 72 h, and the cell number was determined. B, pcDNA and PELP1 clones were serum-starved in 0% DCC serum for 48 h and treated with E2 for 20 h, and the cell cycle status was analyzed by flow cytometry. A representative figure from fluorescence-activated cell sorter analysis is shown here. C, the bar graphs show the percentages of cells in S phase. **, p < 0.01; ***, p < 0.001; NS, non-significant (Student’s t test). Each value represents an average of three experiments. D, pcDNA and PELP1 clones were treated with or without E2 for 20 h, and CDK2 kinase activity was determined in an in vitro kinase assay with histone H1 as a substrate.
PELP1 Expression Leads to Persistent Hyperphosphorylation of pRb
To examine the mechanism by which PELP1 overexpression sensitizes breast cancer cells to G1/S phase transition, we analyzed the status of several cell cycle regulatory proteins. PELP1- and pcDNA-expressing MCF-7 cells growing in 5% DCC serum were stimulated with E2 for different lengths of time. PELP1 overexpression had no effect on the status of p21 and p27 (data not shown). Of all the cell cycle proteins analyzed, we observed the most profound change in the status of phosphorylated pRb in PELP1-overexpressing clones; hence, we limited this study to further characterize the noticed PELP1 regulation of pRb. As shown in Fig. 4A, PELP1-expressing breast cancer cells showed higher levels of hyperphosphorylated forms of pRb. This hyperphosphorylation persisted for up to 20 h after E2 treatment. Analysis of the kinetics of phosphorylation showed the maximal increase in phosphorylation at 6–8 h of treatment (Fig. 4B). To examine the identity of the responsive phosphorylation sites on pRb, pcDNA and PELP1 clones were treated with or without E2 for 6 or 8 h, and the phosphorylation status of pRb was analyzed using phosphorylation site-specific-pRb antibodies that recognize Ser-807/Ser-811, Ser-780, or Ser-795. We observed substantial changes in the magnitude of pRb phosphorylation selectively at Ser-807/Ser-811, but not at Ser-780 or Ser-795 (Fig. 4C). To confirm the specificity of the pRb Ser-807/Ser-811 phosphorylation in PELP1 clones via ER, we pretreated cells with or without the pure antiestrogen ICI 182780 and, 30 min later, stimulated them with E2 for 8 h. The phosphorylation of pRb at Ser-807/Ser-811 was analyzed with the phospho-Ser-807/Ser-811-specific antibody (Fig. 4D). Increased phosphorylation of pRb in the PELP1 clone was blocked by ICI 182780, suggesting that the observed activation of Ser-807/Ser-811 in pRb is dependent on the E2/ER-initiated signaling in PELP1-over expressing cells.
Fig. 4. PELP1 overexpression increases hyperphosphorylation of pRb.

A, pcDNA vector- and PELP1-expressing clones were stimulated with E2 for 20 h. Total lysates were analyzed for the phosphorylation status of pRb by Western blotting with pRb. B, pcDNA and PELP1 clones were stimulated with E2 for different periods, and the kinetics of pRb phosphorylation were analyzed by Western blotting. The arrows point to the hyperphosphorylated form of pRb (pRbPhos). C, pcDNA and PELP1 clones were treated with E2 for 6 or 8 h, and total cell lysates were analyzed for the status of phosphorylation of pRb using phosphorylation site-specific antibodies. D, pcDNA and PELP1 clones were pretreated with or without ICI 182780 for 30 min and then with or without E2 for 8 h. The status of pRb phosphorylation at Ser-807/Ser-811 was analyzed by Western blotting (W).
PELP1 Interacts with pRb in Vitro and in Vivo
pRb hyper-phosphorylation in PELP1-expressing cells raised the possibility that PELP1 plays an important role in E2-mediated regulation of the pRb pathway. To test this possibility, we set out to explore whether PELP1 interacts with pRb. Lysates from control and E2-stimulated MCF-7/PELP1 cells were immunoprecipitated with an anti-pRb monoclonal antibody. Immunoprecipitation of pRb specifically immunoprecipitated T7-tagged PELP1. We found easily detectable basal interaction of T7-PELP1 with pRb even in the absence of E2 treatment (presumably due to residual estrogen), and interaction was further enhanced after E2 treatment (Fig. 5A). In a reciprocal experiment, immunoprecipitation of T7-PELP1 precipitated pRb (Fig. 5B). The GST fusion protein of pRb containing A/B and C pocket domains efficiently interacted with PELP1 in a GST pull-down assay (Fig. 5C). To further examine the possibility that PELP1 interacts with pRb under physiological conditions, MCF-7 cells were treated with E2, and cell lysates were immunoprecipitated with a control IgG or anti-pRb antibody and Western-blotted with an anti-PELP1 antibody that recognizes endogenous PELP1. The results show clear interaction between endogenous PELP1 and pRb (Fig. 5D), suggesting that PELP1 interacts with pRb under physiological conditions.
Fig. 5. Interactions between PELP1 and pRb.
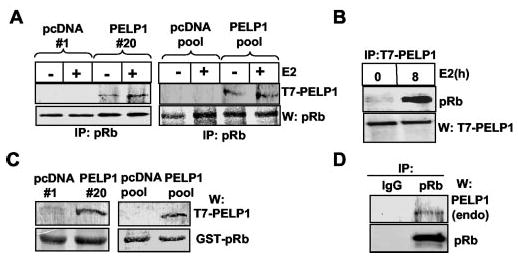
A, total cell lysates from pcDNA or PELP1 clones were immunoprecipitated (IP) with an anti-pRb antibody and Western-blotted (W) with an anti-T7 or anti-pRb monoclonal antibody. B, cell lysates from a PELP1 clone treated with or without E2 for 8 h were immunoprecipitated with an anti-T7 monoclonal antibody and Western-blotted with an anti-pRb monoclonal antibody. C, total cell lysates from pcDNA or PELP1 clones were incubated with GST-pRb protein, and bound proteins were pulled down using GST beads. GST-pRb eluates were immunoblotted with an anti-T7 monoclonal antibody. D, MCF-7 cells were treated with E2 for 8 h, and cell lysates were immunoprecipitated with a control IgG or anti-pRb antibody. Immunoprecipitates were analyzed by Western blotting with an anti-PELP1 antibody that recognizes endogenous (endo) PELP1.
PELP1 Interacts with pRb via the C-terminal Pocket Domain
To understand the mechanism by which PELP1 interaction influences the functions of pRb, we next identified the binding domains of pRb for its interaction with PELP1. pRb has been shown to bind its target proteins by three different mechanisms, binding to the A/B pocket via the LXCXE motif (e.g. cyclin D1) (33), to the A/B and C pockets (e.g. E2F) (26), and to the C pocket (e.g. c-Abl) (34). We used GST fusion proteins of the pRb domains, GST-pRb-(334–928) (A/B and C pockets), GST-pRb-(334–776) (A/B pocket), and GST-pRb-(776–928) (C pocket), to identify the PELP1-binding domains using a GST pull-down assay and cell lysates from T7-PELP1-expressing clones as a source of PELP1. PELP1 interacted with the GST-pRb fusion protein containing the C-terminal region, but not with the GST-pRb fusion proteins containing the A/B pocket domain (Fig. 6, A and B). These results suggest that PELP1/pRb interactions are mediated by the pRb C pocket domain independently of the A/B pocket domain.
Fig. 6. PELP1 interacts with pRb via a C pocket domain.
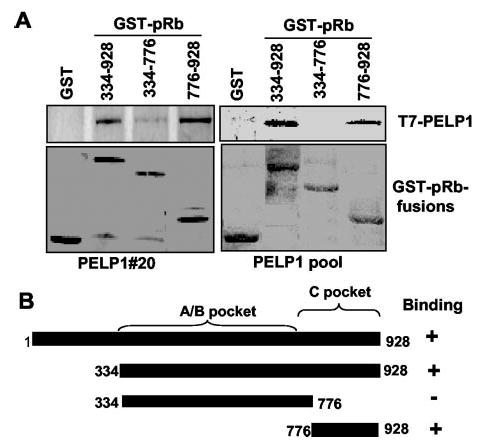
A, total cell lysates from PELP1 clone 20 or the PELP1 pooled clone were incubated with GST-pRb fusion proteins containing the A/B and C pocket domains, the A/B pocket domain, or the C pocket domain. The ability of T7-PELP1 to interact with pRb fusion proteins was analyzed using a GST pull-down assay, followed by Western blotting with an anti-T7 monoclonal antibody. B, shown is a schematic representation of GST fusion proteins used in the GST pull-down assays.
pRb Binds to the N-terminal Region of PELP1
To determine the pRb-binding site in PELP1, we used deletion constructs of PELP1 lacking the N- or C-terminal regions. T7-tagged PELP1 constructs of various lengths were transiently transfected into MCF-7 cells, and the ability of the expressed T7-PELP1 proteins to interact with endogenous pRb was analyzed via immunoprecipitation using an anti-T7 tag monoclonal antibody, followed by Western blotting with an anti-pRb antibody. As shown in Fig. 7 (A–C), deletion of C-terminal amino acids 456–1130 had little to no effect on PELP1 binding to pRb. However, deletion of N-terminal amino acids 1–397 completely abolished the ability of pRb to interact with PELP1, suggesting that pRb binding is localized in the N-terminal region of PELP1. To confirm these results, we translated a PELP1 N-terminal fragment containing amino acids 1–330 in vitro using the Promega TnT system and analyzed the ability of the translated product to interact with GST-pRb fusion proteins using a GST pull-down assay. GST fusion proteins of the pRb domain, GST-pRb-(334–928) (A/B and C pockets) and GST-pRb-(776–928) (C pocket domain), efficiently interacted with N-terminal amino acids 1–330 of PELP1 (Fig. 7B). These results suggest that the pRb-binding region in PELP1 is localized in the N-terminal region and that this interaction primarily involves the C pocket domain of pRb.
Fig. 7. pRb interacts with PELP1 via its N-terminal region.
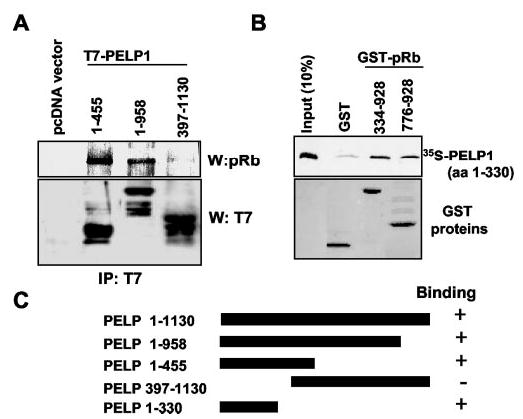
A, pcDNA and PELP1 cDNAs of the indicated lengths in a pcDNA vector were transiently transfected into MCF-7 cells. Equal amounts of total cell lysates were immunoprecipitated (IP) with an anti-pRb antibody. Immunoprecipitates were analyzed by Western blotting (W) with an anti-T7 monoclonal antibody. B, the PELP1 cDNA fragment encoding N-terminal amino acids (aa) 1–330 was in vitro translated using the TnT system. The ability of this region to interact with GST fusion proteins of the A/B and C pockets and the C pocket of pRb was analyzed in GST pull-down assays, followed by autoradiography. C, shown is a schematic representation of the PELP1 constructs used in this study.
Role for pRb in PELP1-mediated Coactivation Function
Because PELP1 interacts with pRb and increases pRb hyper-phosphorylation, we examined PELP1/pRb interactions to determine whether they play a role in PELP1-mediated coactivator functions using pRb-defective SAOS2 osteosarcoma cells (34, 35). SAOS2 cells express a mutant pRb protein that lacks a C-terminal region and that is localized in the cytoplasm and therefore is unable to interact with PELP1. However, these cells express endogenous PELP1 (Fig. 8, inset). SAOS2 cells were cotransfected with an ERE reporter, ER, and PELP1 with or without pRb expression vectors, and ERE-luciferase activity was determined after stimulation of cells with or without E2 (10−9 m) for 24 h. Cotransfection of PELP1 alone produced weak coactivation of ERE-luciferase activity in SAOS2 cells. However, cotransfection of pRb and PELP1 into SAOS2 cells resulted in a dramatic increase in ERE activity (Fig. 8A). Transfection of pRb alone into these cells also potentiated modest ERE-luciferase activity, which may have been due to its interaction with endogenous PELP1. To test the possibility that the increase in PELP1 activation is due to functional interactions between PELP1 and pRb proteins, we performed ERE reporter assays by cotransfecting the PELP1 N-terminal region, which contains a pRb-binding site and nuclear localization motif and thus is expected to interfere with the interaction of pRb with endogenous PELP1. Cotransfection of the PELP1 N-terminal fragment abolished the pRb-mediated increase in the ERE reporter activity, suggesting that functional interactions between pRb and endogenous PELP1 are required for the pRb increase observed in the ERE reporter activity (Fig. 8B). These results suggest that PELP1/pRb interactions may play a role in maximizing the coactivation function of PELP1 in cell cycle progression.
Fig. 8. Requirement of pRb for efficient ER coactivation function of PELP1.
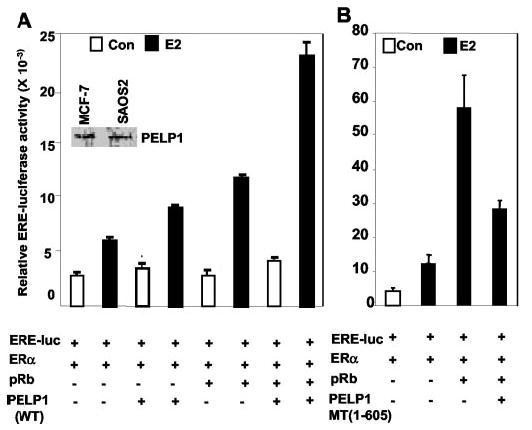
A, pRb-defective SAOS2 cells were cultured for 48 h in 5% DCC serum and then transfected with the ERE reporter, ERα, and PELP1 with or without pRb expression vectors. Cells were treated with or without E2 (10−9 m) after 48 h, and luciferase (luc) activity was measured after 24 h of ligand treatment. The inset shows the expression of endogenous PELP1 in SAOS2 cells. B, SAOS2 cells were cotransfected with the PELP1 N-terminal fragment and the pRb expression vector, and ERE-luciferase activity was measured after 24 h of E2 treatment. Con, control; WT, wild-type; PELP-MT, PELP-1 protein containing amino acids 1–605.
PELP1 Up-regulates Cyclin D1 Expression in an E2- and pRb-dependent Manner
Because cyclin D1 was shown to have an effect on pRb phosphorylation during G1/S phase progression (36), we examined whether PELP1 regulates cyclin D1 promoter activity and whether PELP1/pRb interactions can modulate this activity. SAOS2 cells were cotransfected with a –1745-bp cyclin D1-luciferase promoter (37) with or without PELP1 and with or without pRb, and luciferase activity was determined. The results show that cotransfection of PELP1 or pRb alone was sufficient to modestly increase the cyclin D1 promoter activity. However, cotransfection of PELP1 and pRb significantly stimulated this activity compared with vector-transfected cells (4-fold) (Fig. 9A). The Rb-mediated increase in the cyclin D1 activity could be blocked by cotransfection of a PELP1 fragment containing the pRb-binding site (Fig. 9B). We next sought to determine whether PELP1 can up-regulate cyclin D1 expression in a physiological setting. pcDNA- and PELP1-expressing MCF-7 clones were stimulated with E2 for various periods of time, and the level of cyclin D1 expression was analyzed by Western blotting. As illustrated in Fig. 9C, the pcDNA-expressing clone showed a transient increase in the cyclin D1 expression level after 6–8 h of E2 treatment. In contrast, PELP1-expressing MCF-7 cells showed a relatively higher magnitude of cyclin D1 induction, and increased cyclin D1 levels persisted for up to 20 h. Together, these results suggest that PELP1 regulates cyclin D1 expression at the transcriptional level and that such regulation may involve functional interactions between PELP1 and pRb.
Fig. 9. PELP1 up-regulates cyclin D1 transcription and expression in a pRb-dependent manner.
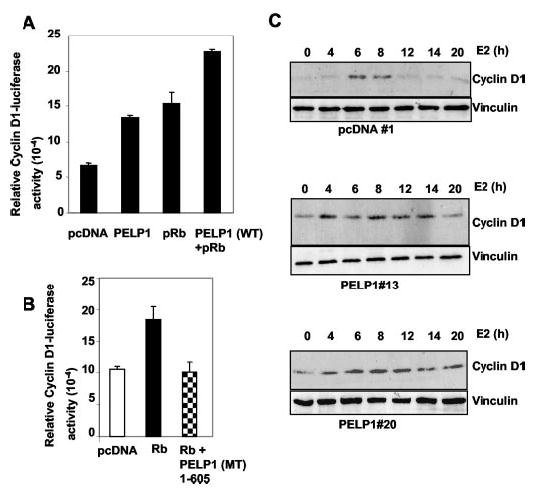
A, pRb-negative SAOS2 cells were transiently transfected with a –1745-bp cyclin D1-luciferase reporter with or without PELP1 and pRb; 24 h later, cells were lysed, and luciferase activity was measured. B, SAOS2 cells were cotransfected with a – 1745-bp cyclin D1-luciferase reporter and the pRb expression vector with or without the PELP1 N-terminal fragment, and cyclin D1-luciferase activity was measured after 24 h of transfection. C, pcDNA clone 1 and PELP1 clones 20 and 13 were treated with E2 for the indicated periods, and total lysates were analyzed for expression of cyclin D1 by Western blotting. WT, wild-type; PELP-MT, PELP-1 protein containing amino acids 1–605.
DISCUSSION
E2 regulates cell proliferation in a wide variety of tissues, including breast tissue (14). src3-null mutant mice have been demonstrated to exhibit decreased development of mammary glands, suggesting that coactivators are critical for efficient proliferation and differentiation of mammary glands (38). Earlier studies also suggested that overexpression of ER coactivators such as SRC1and GRIP enables cell cycle progression (39, 40). Even though these studies demonstrated that steroid coactivators enhance normal E2-mediated cell cycle progression, the mechanisms by which ER coregulators promote this progression remain elusive. In the present study, overexpression of the novel ER coactivator PELP1 was accompanied by persistent hyperphosphorylation of pRb in an E2-dependent manner, and overexpression of PELP1 increased the rate of cell proliferation. Our results suggest that PELP1 affects ER-mediated cell cycle progression through both transcriptionally regulating E2-responsive genes (such as cyclin D1) and modulating the functions of cell cycle regulators such as pRb.
Previous studies showed that E2 induces up-regulation of cyclin D1 expression and that such an increase is implicated in pRb phosphorylation (19). Specifically, the ER coactivator AIB1 was shown to enhance E2-dependent induction of cyclin D1, suggesting a role for ER coregulators in modulating cyclin D1 expression (41). Furthermore, pRb has been shown to be a coactivator and to regulate cyclin D1 expression (36). In our study, PELP1 overexpression resulted in persistent expression of cyclin D1 and increased hyperphosphorylation of pRb. Luciferase reporter assays using a cyclin D1 promoter further support the conclusion that PELP1 regulates cyclin D1 expression and that such an increase is dependent on the presence of functional pRb. PELP1 also positively contributes to E2-mediated G1/S phase progression via cyclin D1 up-regulation, and such an increase in cyclin D1 expression depends on PELP1/pRb interactions. Because PELP1 expression is deregulated in breast tumors, its ability to modulate cyclin D1 expression may provide a functional advantage for ER-positive tumors and play a role in ER-positive tumor cell proliferation. Finally, the ability of PELP1 to confer hypersensitivity to the MCF-7 cancer cell line suggests that the deregulation of PELP1 expression seen in breast tumors (28) may provide an advantage to breast cancer cells by sensitizing them to residual levels of estrogen.
E2-mediated stimulation of pRb hyperphosphorylation in PELP1-overexpressing cells may also be due to the ability of PELP1 to interact with pRb directly. pRb has been shown to bind its target proteins by binding to the A/B pocket via the LXCXE motif (e.g. cyclin D1) (33), the A/B and C pockets (e.g. E2F) (26), and the C pocket (e.g. c-Abl) (34). Using a GST pull-down assay, we demonstrated that PELP1 interacts with pRb via the C-terminal pocket domain and that the pRb-binding site in PELP1 is localized to N-terminal amino acids 1–330. Examination of the N-terminal region of PELP1 suggested that it contains an LXSXE motif, a variant of the pocket-binding LXCXE motif present in pRb-interacting proteins. As PELP1 did not interact with the A/B pocket domain, this motif may not play a role in pRb binding to PELP1. The ability of PELP1 to interact with pRb via N-terminal amino acids 1–330 (Fig. 7B), which contain seven LXXLL motifs and an ER-binding site, raises the possibility that PELP1 works as an adapter molecule, bringing ER and pRb together.
pRb is phosphorylated in a cell cycle-dependent manner. The 20-amino acid region at the C terminus of pRb (m89 region) has been shown to control the exposure of the CDK site Ser-807/Ser-811 both in vitro and in vivo (42). It is possible that PELP1 interaction with the C pocket in pRb specifically exposes Ser-807/Ser-811 for CDK phosphorylation. Indeed, our results using phosphorylation site-specific antibodies suggest that PELP1 expression selectively increases pRb phosphorylation at Ser-807/Ser-811, but not at Ser-795 or Ser-780. It is also possible that PELP1 interaction with the pRb C-terminal pocket domain plays a role in disruption of interactions of known pRb C pocket-binding proteins such as c-Abl (34) and protein phosphatase-1 (43). Future studies will be directed at understanding PELP1 modulation of the C pocket of pRb, by which it may influence pRb phosphorylation and activity and consequently its cell cycle functions.
pRb plays an important role in cell proliferation and differentiation (22, 23). It has been shown to inactivate E2F through direct interaction and sequestration (23). Phosphorylation of pRb by cell cycle-dependent kinases releases E2F, thus leading to G1/S phase progression. Additionally, a number of viral oncogenes interact with pRb; such interactions are proposed to play a role in releasing E2F, leading to deregulation of cell progression (44). However, recent evidence also implicates pRb as a coactivator in the context of other coactivators/promoters. For example, pRb interacts with the human bromoprotein BRM and potentiates glucocorticoid receptor-mediated transcription (45). pRb also acts as a coactivator of the transcription factors AP-2 (46, 47) and NF-IL6 (48). In addition, the results of coexpression experiments demonstrate that PELP1/pRb interactions positively modulate both ERE reporter and cyclin D1 promoter activities. These results suggest that pRb plays a role in PELP1-mediated coactivation functions. Because PELP1 expression is developmentally regulated and pRb is ubiquitously expressed, PELP1/pRb interactions may play a role in the regulation of specific genes during mammary gland development and differentiation.
Accumulating evidence in the literature suggests that pRb also plays a role in estrogen-mediated nuclear signaling. pRb-binding protein-2 was shown to interact with DNA-binding domains of nuclear receptors and to potentiate ER-dependent transcription in an AF2-dependent manner (35). Also, the retinoblastoma-interacting zinc finger protein interacts with ER in a ligand-dependent manner and has been shown to play a role in ER-mediated cell proliferation and transcriptional activation (49). Our results show that pRb interacts with PELP1 and that such interactions are required for the maximal coactivation function of PELP1, further supporting the earlier observations that pRb plays an important role in the genomic functions of ER and that PELP1 may function as a mediator of pRb functions in ER signaling.
In summary, we have demonstrated that PELP1 interacts with pRb and promotes hyperphosphorylation of pRb. PELP1/pRb interactions are essential for the maximal coactivation function of PELP1; these interactions may play a role in genomic and cell cycle signaling events regulated by E2/ER interactions. Our findings suggest that PELP1, a bona fide ER coactivator, plays a permissive role in E2-mediated cell cycle progression, presumably via its regulatory interactions with the pRb pathway.
Acknowledgments
We are grateful to Rakesh Kumar for thoughtful discussions and critical reading of this manuscript, Mark Ewen for GST-pRb plasmids, Andrew Koff for the pRb expression vector, Donald P. McDonnell for the ERE-luciferase reporter, Mong-Hong Lee for the cyclin D1-luciferase reporter, and Diep Nguyen and Feng Li for assistance in plasmid construction.
Footnotes
This work was supported in part by National Institutes of Health Grants CA84456 and CA95681.
The on-line version of this article (available at http://www.jbc.org) contains a supplemental figure.
The abbreviations used are: E2, 17β-estradiol; ER, estrogen receptor; ERE, estrogen response element; RT, reverse transcription; GST, glutathione S-transferase; PELP, proline-, glutamic acid-, and leucine-rich protein; MNAR, modulator of non-genomic activity of estrogen receptor.
References
- 1.McDonnell DP, Norris JD. Science. 2002;296:1642–1644. doi: 10.1126/science.1071884. [DOI] [PubMed] [Google Scholar]
- 2.Couse JF, Korach KS. Endocr Rev. 1999;20:358–417. doi: 10.1210/edrv.20.3.0370. [DOI] [PubMed] [Google Scholar]
- 3.Warner M, Nilsson S, Gustafsson JA. Curr Opin Obstet Gynecol. 1999;11:249–254. doi: 10.1097/00001703-199906000-00003. [DOI] [PubMed] [Google Scholar]
- 4.Kumar V, Chambon P. Cell. 1988;55:145–156. doi: 10.1016/0092-8674(88)90017-7. [DOI] [PubMed] [Google Scholar]
- 5.Levin ER. J Appl Physiol. 2001;91:1860–1867. doi: 10.1152/jappl.2001.91.4.1860. [DOI] [PubMed] [Google Scholar]
- 6.Luconi M, Forti G, Baldi E. J Steroid Biochem Mol Biol. 2002;80:369–381. doi: 10.1016/s0960-0760(02)00041-9. [DOI] [PubMed] [Google Scholar]
- 7.Mendelsohn ME. Am J Cardiol. 2002;90:3F–6F. doi: 10.1016/s0002-9149(02)02418-9. [DOI] [PubMed] [Google Scholar]
- 8.Valverde MA, Parker MG. Trends Biochem Sci. 2002;27:172–173. doi: 10.1016/s0968-0004(02)02075-3. [DOI] [PubMed] [Google Scholar]
- 9.Kumar V, Green S, Stack G, Berry M, Jin JR, Chambon P. Cell. 1987;51:941–951. doi: 10.1016/0092-8674(87)90581-2. [DOI] [PubMed] [Google Scholar]
- 10.Berry M, Metzger D, Chambon P. EMBO J. 1990;9:2811–2818. doi: 10.1002/j.1460-2075.1990.tb07469.x. [DOI] [PMC free article] [PubMed] [Google Scholar]
- 11.Hermanson O, Glass CK, Rosenfeld MG. Trends Endocrinol Metab. 2002;13:55–60. doi: 10.1016/s1043-2760(01)00527-6. [DOI] [PubMed] [Google Scholar]
- 12.McKenna NJ, Malley BW. Cell. 2002;108:465–474. doi: 10.1016/s0092-8674(02)00641-4. [DOI] [PubMed] [Google Scholar]
- 13.Osborne CK, Schiff R, Fuqua SA, Shou J. Clin Cancer Res. 2001;7:4338–4342. [PubMed] [Google Scholar]
- 14.Foster JS, Henley DC, Ahamed S, Wimalasena J. Trends Endocrinol Metab. 2001;12:320–327. doi: 10.1016/s1043-2760(01)00436-2. [DOI] [PubMed] [Google Scholar]
- 15.Prall OW, Rogan EM, Musgrove EA, Watts CK, Sutherland RL. Mol Cell Biol. 1998;18:4499–4508. doi: 10.1128/mcb.18.8.4499. [DOI] [PMC free article] [PubMed] [Google Scholar]
- 16.Lamb J, Ladha MH, McMahon C, Sutherland RL, Ewen ME. Mol Cell Biol. 2000;20:8667–8675. doi: 10.1128/mcb.20.23.8667-8675.2000. [DOI] [PMC free article] [PubMed] [Google Scholar]
- 17.Prall OW, Rogan EM, Sutherland RL. J Steroid Biochem Mol Biol. 1998;65:169–174. doi: 10.1016/s0960-0760(98)00021-1. [DOI] [PubMed] [Google Scholar]
- 18.Foster JS, Henley DC, Bukovsky A, Seth P, Wimalasena J. Mol Cell Biol. 2001;21:794–810. doi: 10.1128/MCB.21.3.794-810.2001. [DOI] [PMC free article] [PubMed] [Google Scholar]
- 19.Prall OW, Sarcevic B, Musgrove EA, Watts CK, Sutherland RL. J Biol Chem. 1997;272:10882–10894. doi: 10.1074/jbc.272.16.10882. [DOI] [PubMed] [Google Scholar]
- 20.Neuman E, Ladha MH, Lin N, Upton TM, Miller SJ, DiRenzo J, Pestell RG, Hinds PW, Dowdy SF, Brown M, Ewen ME. Mol Cell Biol. 1997;17:5338–5347. doi: 10.1128/mcb.17.9.5338. [DOI] [PMC free article] [PubMed] [Google Scholar]
- 21.Altucci L, Addeo R, Cicatiello L, Dauvois S, Parker MG, Truss M, Beato M, Sica V, Bresciani F, Weisz A. Oncogene. 1996;12:2315–2324. [PubMed] [Google Scholar]
- 22.Harbour JW, Dean DC. Nat Cell Biol. 2000;2:E65–E67. doi: 10.1038/35008695. [DOI] [PubMed] [Google Scholar]
- 23.Harbour JW, Dean DC. Genes Dev. 2000;14:2393–2409. doi: 10.1101/gad.813200. [DOI] [PubMed] [Google Scholar]
- 24.Morris EJ, Dyson NJ. Adv Cancer Res. 2001;82:1–54. doi: 10.1016/s0065-230x(01)82001-7. [DOI] [PubMed] [Google Scholar]
- 25.Weinberg RA. Cell. 1995;81:323–330. doi: 10.1016/0092-8674(95)90385-2. [DOI] [PubMed] [Google Scholar]
- 26.Dyson N. Genes Dev. 1998;12:2245–2262. doi: 10.1101/gad.12.15.2245. [DOI] [PubMed] [Google Scholar]
- 27.Jiang Z, Zacksenhaus E. J Cell Biol. 2002;156:185–198. doi: 10.1083/jcb.200106084. [DOI] [PMC free article] [PubMed] [Google Scholar]
- 28.Vadlamudi RK, Wang RA, Mazumdar A, Kim Y, Shin J, Sahin A, Kumar R. J Biol Chem. 2001;276:38272–38279. doi: 10.1074/jbc.M103783200. [DOI] [PubMed] [Google Scholar]
- 29.Wong CW, McNally C, Nickbarg E, Komm BS, Cheskis BJ. Proc Natl Acad Sci U S A. 2002;99:14783–14788. doi: 10.1073/pnas.192569699. [DOI] [PMC free article] [PubMed] [Google Scholar] [Retracted]
- 30.Hirosawa M, Ishikawa K, Nagase T, Ohara O. Genome Res. 2000;10:1333–1341. doi: 10.1101/gr.129500. [DOI] [PubMed] [Google Scholar]
- 31.Hillier LD, Lennon G, Becker M, Bonaldo MF, Chiapelli B, Chissoe S, Dietrich N, DuBuque T, Favello A, Gish W, Hawkins M, Hultman M, Kucaba T, Lacy M, Le M, Le N, Mardis E, Moore B, Morris M, Parsons J, Prange C, Rifkin L, Rohlfing T, Schellenberg K, Marra M. Genome Res. 1996;6:807–828. doi: 10.1101/gr.6.9.807. [DOI] [PubMed] [Google Scholar]
- 32.Wolfsberg TG, Landsman D. Nucleic Acids Res. 1997;25:1626–1632. doi: 10.1093/nar/25.8.1626. [DOI] [PMC free article] [PubMed] [Google Scholar]
- 33.Ewen ME, Sluss HK, Sherr CJ, Matsushime H, Kato J, Livingston DM. Cell. 1993;73:487–497. doi: 10.1016/0092-8674(93)90136-e. [DOI] [PubMed] [Google Scholar]
- 34.Welch PJ, Wang JY. Cell. 1993;75:779–790. doi: 10.1016/0092-8674(93)90497-e. [DOI] [PubMed] [Google Scholar]
- 35.Chan SW, Hong W. J Biol Chem. 2001;276:28402–28412. doi: 10.1074/jbc.M100313200. [DOI] [PubMed] [Google Scholar]
- 36.Muller H, Lukas J, Schneider A, Warthoe P, Bartek J, Eilers M, Strauss M. Proc Natl Acad Sci U S A. 1994;91:2945–2949. doi: 10.1073/pnas.91.8.2945. [DOI] [PMC free article] [PubMed] [Google Scholar]
- 37.Lee RJ, Albanese C, Stenger RJ, Watanabe G, Inghirami G, Haines GK, III, Webster M, Muller WJ, Brugge JS, Davis RJ, Pestell RG. J Biol Chem. 1999;274:7341–7350. doi: 10.1074/jbc.274.11.7341. [DOI] [PubMed] [Google Scholar]
- 38.Xu J, Liao L, Ning G, Yoshida K, Deng C, Malley BW. Proc Natl Acad Sci U S A. 2000;97:6379–6384. doi: 10.1073/pnas.120166297. [DOI] [PMC free article] [PubMed] [Google Scholar]
- 39.Tai H, Kubota N, Kato S. Biochem Biophys Res Commun. 2000;267:311–316. doi: 10.1006/bbrc.1999.1954. [DOI] [PubMed] [Google Scholar]
- 40.Shang Y, Hu X, DiRenzo J, Lazar MA, Brown M. Cell. 2000;103:843–852. doi: 10.1016/s0092-8674(00)00188-4. [DOI] [PubMed] [Google Scholar]
- 41.Planas S, Shang Y, Donaher JL, Brown M, Weinberg RA. Cancer Res. 2001;61:3858–3862. [PubMed] [Google Scholar]
- 42.Driscoll B, Ang A, Hu YH, Yan CL, Fu Y, Luo Y, Wu KJ, Wen S, Shi XH, Barsky L, Weinberg K, Murphree AL, Fung YK. J Biol Chem. 1999;274:9463–9471. doi: 10.1074/jbc.274.14.9463. [DOI] [PubMed] [Google Scholar]
- 43.Tamrakar S, Ludlow JW. J Biol Chem. 2000;275:27784–27789. doi: 10.1074/jbc.M004542200. [DOI] [PubMed] [Google Scholar]
- 44.Dyson N, Buchkovich K, Whyte P, Harlow E. Princess Takamatsu Symp. 1989;20:191–198. [PubMed] [Google Scholar]
- 45.Singh P, Coe J, Hong W. Nature. 1995;374:562–565. doi: 10.1038/374562a0. [DOI] [PubMed] [Google Scholar]
- 46.Decary S, Decesse JT, Ogryzko V, Reed JC, Naguibneva I, Harel B, Cremisi CE. Mol Cell Biol. 2002;22:7877–7888. doi: 10.1128/MCB.22.22.7877-7888.2002. [DOI] [PMC free article] [PubMed] [Google Scholar]
- 47.Lai A, Lee JM, Yang WM, DeCaprio JA, Kaelin WG, Seto E, Branton PE. Mol Cell Biol. 1999;19:6632–6641. doi: 10.1128/mcb.19.10.6632. [DOI] [PMC free article] [PubMed] [Google Scholar]
- 48.Chen PL, Riley DJ, Chen K, Lee WH. Proc Natl Acad Sci U S A. 1996;93:465–469. doi: 10.1073/pnas.93.1.465. [DOI] [PMC free article] [PubMed] [Google Scholar]
- 49.Abbondanza C, Medici N, Nigro V, Rossi V, Gallo L, Piluso G, Belsito A, Roscigno A, Bontempo P, Puca AA, Molinari AM, Moncharmont B, Puca GA. Proc Natl Acad Sci U S A. 2000;97:3130–3135. doi: 10.1073/pnas.050015697. [DOI] [PMC free article] [PubMed] [Google Scholar]