Abstract
In normal rats, vasopressin and hyperosmolality enhance urea permeability (Purea) in the terminal, but not in the initial IMCD, a process thought to occur through the UT-A1 urea transporter. In the terminal IMCD, UT-A1 is detected as 97 and 117 kDa glycoproteins. However, in the initial IMCD, only the 97 kDa form is detected. During streptozotocin induced diabetes mellitus, UT-A1 protein abundance is increased and the 117 kDa UT-A1 glycoprotein appears in the initial IMCD. We hypothesize that the 117 kDa glycoprotein mediates the vasopressin- and osmolality-induced changes in Purea. Thus in the present study, we measured Purea in in vitro perfused initial IMCDs from diabetic rats by imposing a 5 mM bath-to-lumen urea gradient without any osmotic gradient. Basal Purea was similar in control vs. diabetic rats (3±1 vs. 5±1 x10⁻⁵ cm/sec, n=4, p=NS). Vasopressin (10 nM) significantly increased Purea to 16±5 x10⁻⁵ cm/sec, n=4, p<0.05 in diabetic, but not in control rats. Forskolin (10 μM, adenylyl cyclase activator) also significantly increased Purea in diabetic rats. In contrast, increasing osmolality to 690 mOsm/kg H2O did not change Purea in diabetic rats. We conclude that initial IMCDs from diabetic rats have vasopressin- and forskolin-, but not hyperosmolality-stimulated Purea. The appearance of vasopressin-stimulated Purea in initial IMCDs correlates with an increase in UT-A1 protein abundance and the appearance of the 117 kDa UT-A1 glycoprotein in this region during diabetes. This suggests that the 117 kDa UT-A1 glycoprotein is necessary for vasopressin-stimulated urea transport.
Keywords: diabetes mellitus, inner medullary collecting duct, urea permeability, vasopressin, hyperosmolality
INTRODUCTION
Urea, a polar compound, requires specific transporters for rapid transport across biologic membranes. In the IMCD, urea permeability is mediated by the urea transporter UT-A1 and is important for urine concentrating ability (for review see (17)). In normal rats, urea permeability differs between the initial and terminal segments of the IMCD, both in regard to magnitude and mechanisms of regulation. Urea permeability is low in the initial IMCD and high in the terminal IMCD (18). Moreover, both vasopressin and hypertonicity stimulate urea transport in the terminal IMCD, but not in the initial IMCD (10, 19). The terminal IMCD is located in the inner medullary (IM) tip, and the UT-A1 urea transporter is detected as both 97 and 117 kDa glycoproteins in this region. Conversely, the initial IMCD is located in the IM base, and only the 97 kDa form of UT-A1 is detected in this region (15, 17).
UT-A1 protein abundance changes in both the IM base and tip in rats treated with streptozotocin (STZ) to induce diabetes mellitus (15). In the IM base, 5–20 days of diabetes induces an increase in UT-A1 protein abundance and the appearance of the 117 kDa UT-A1 glycoprotein (in addition to the 97 kDa glycoprotein). In contrast to the IM base, UT-A1 protein abundance changes with the duration of diabetes in the IM tip: it decreases at 3–5 days and increases at 10–20 days of diabetes. However, both the 117 and 97 kDa UT-A1 glycoproteins are detected in the IM tip at every time point in diabetic rats (15). Thus, the glycoprotein forms of UT-A1 that are expressed in the IM base of diabetic rats resemble those in the IM tip of normal rats. The goal of the present study was to test the hypothesis that the appearance of the 117 kDa UT-A1 glycoprotein in the IM base of diabetic rats will correlate with the functional appearance of vasopressin-stimulated urea permeability in the initial IMCD, similar to the terminal IMCD from normal rats. Therefore, we determined if urea permeability in the perfused initial IMCD of diabetic rats was stimulated by vasopressin.
METHODS
Animal preparation
All animal protocols were approved by the Emory University Institutional Animal Care and Use Committee. Male Sprague-Dawley rats (Harlan) weighing 75–100 g had free access to water and standard rodent chow (LabDiet 5001, Brentwood, MO). Rats were injected with STZ (Sigma, St. Louis, MO; 124 mg/kg body wt prepared fresh in 0.1 M citrate buffer, pH 4.0) or vehicle i.p. At 24 hrs after STZ injection, diabetes was confirmed by measuring urinary glucose (Ames-Multistix SG, Miles, Elkhart, IN). 5–7 days after STZ injection, rats were killed by decapitation, blood was assayed for glucose (One Touch Profile Diabetes Tracking Kit, Lifescan, Milpitas, CA), kidneys were removed and prepared either for western blot analysis or for in vitro tubule perfusion.
Western blot analysis
The kidney inner medulla was dissected into the base and the tip, as previously described (15). The pooled tissue from both kidneys of a single rat was placed into an ice-cold isolation buffer (10 mM triethanolamine, 250 mM sucrose, pH 7.6, 1 μg/ml leupeptin, and 0.1 mg/ml PMSF), homogenized, and diluted 1:1 with 1% SDS for Western blot analysis of total cell lysate. Total protein in each sample was measured by the Bradford method (Bio-Rad, Richmond, CA). Proteins (10 μg/lane) were size separated by SDS-PAGE using 10% polyacrylamide gels. Proteins were blotted to polyvinylidene difluoride membranes (Gelman Scientific, Ann Arbor, MI), and Western blot analysis performed as described previously (15). In all cases, parallel gels were stained with Coomassie blue to confirm uniformity of loading (data not shown).
Tubule preparation for in vitro perfusion
Kidneys were placed into chilled (17°C), isotonic, dissecting solution and initial IMCDs were isolated as describe previously (10, 11, 13, 19). The dissecting solution was gassed with 95% air-5% CO2 and contained (in mM) 118 NaCl, 25 NaHCO3, 2 CaCl2, 2.5 K2HPO4, 1.2 MgSO4 and 5.5 glucose. Tubules were transferred into a bath that was continuously exchanged and bubbled with 95% air-5% CO2 gas and perfused using standard techniques (10, 11, 13, 19).
Urea measurement
The urea concentration in perfusate, bath and collected fluid was measured using a continuous-flow ultramicrofluorometer as described (10, 11, 13, 19). This assay is capable of resolving differences of 4% or greater in urea concentration. Urea flux (Jurea) was calculated as: Jurea = C0V0−C1V1, where C0 is urea concentration in the perfusate, C1 is the urea concentration in the collected fluid, V0 is the perfusion rate per unit of length of tubule and V1 is the collection rate per unit length of tubule. V0 is assumed to be equal to V1 because tubules were perfused with no osmotic gradient across the tubule and hence no driving force for water reabsorption. The urea permeability (Purea) was calculated from Jurea as: Purea = Jurea/(πDClm), where Clm is the log-mean urea concentration difference along tubule and D is the tubule inner diameter measured using an eyepiece micrometer.
To study facilitated urea permeability, perfusate and bath solutions were prepared identical to the dissection solution (described above) except that 5 mM urea was added to the bath solution and 5 mM raffinose was added to the perfusate solution to create a 5 mM bath-to-lumen urea gradient without any imposed osmotic gradient. To study active urea transport, perfusate and bath solutions were identical to the dissection solution except that 3 mM urea was added to both solutions.
Effect of vasopressin or forskolin on urea transport
The urea concentration of three to four collections was measured, after which either 10 nM arginine vasopressin or 10 μM forskolin was added to the bath. After a 15 minute equilibration period, three additional collections were obtained.
Effect of changing osmolality
Hyperosmolal solutions (690 mOsm/kg H2O) were prepared by adding NaCl into the standard perfusate and bath solutions (290 mOsm/kg H2O). Osmolality was measured with a vapor-pressure osmometer (model 5500; Wescor, Logan, UT). Urea concentration was measured in three to four collections during which the tubule was perfused with 290 mOsm/kg H2O solutions. After that, both perfusate and bath solutions were changed to hyperosmolal solutions and three to four collections were taken. Then both solutions were changed back to the original solutions, and after a 20 minute washout period, another three to four collections were taken.
Effect of hyperosmolality and vasopressin
Urea concentration was measured under standard conditions, after which both perfusate and bath solutions were changed to hyperosmolal solutions and three to four collections were taken. Then, 10 nM arginine vasopressin was added to the bath and three additional collections were obtained.
Statistics
All data are present as mean ± SE. Data from three to four collections were averaged to obtain a single value from each experimental phase in each tubule. To test for statistical significance between two groups, a Student’s t-test was used. To test more than two groups, an ANOVA was used, followed by Tukey’s protected t-test. The criterion for statistical significance was P<0.05. Paired statistical analysis was used when each tubule was used as its own control. Unpaired statistical analysis was used to compare tubules from STZ-treated vs. untreated rats.
RESULTS
Blood glucose concentration and UT-A1 protein abundance
Blood glucose was 565 ± 10 mg/dl (n = 20) in diabetic and 135 ± 8 mg/dl (n = 4) in control rats. Five days of diabetes mellitus resulted in marked increased abundance of the 97 kDa UT-A1 glycoprotein compared to control rats and in the appearance of the 117 kDa glycoprotein in the inner medullary base (figure 1), consistent with our previous results (15).
Figure 1.
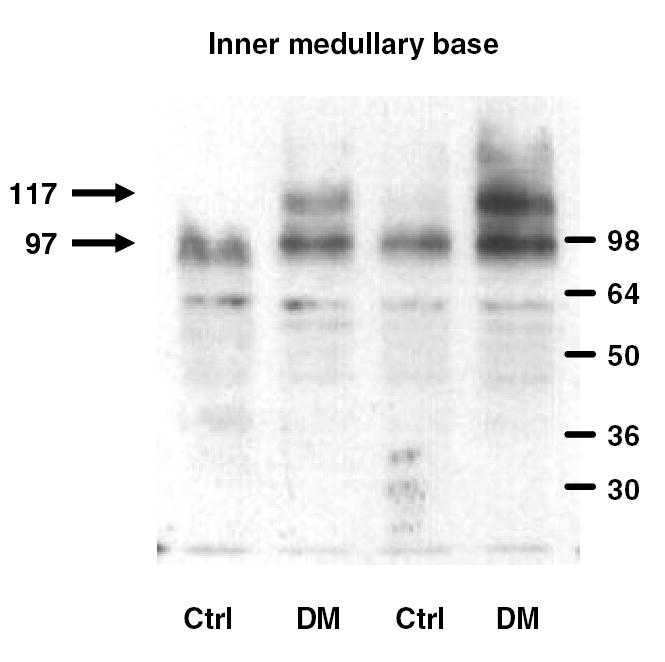
UT-A1 protein in the inner medullary base of control (CTRL) and diabetic (DM) rats. A representative sample of western blot analyses of inner medullary base lysates shows the upregulation of the 97 kDa band and appearance of the 117 kDa band in diabetic rats.
Effect of vasopressin on facilitated urea transport in control and diabetic initial IMCDs
Basal facilitated urea permeability was similar in initial IMCDs isolated from control and diabetic rats (3±1 vs. 5±1 x10⁻⁵ cm/sec, n=4, p=NS; Fig.2). Although vasopressin had no effect on urea permeability in control rats (4±1 x10⁻⁵ cm/sec, n=4, p=NS vs. basal condition), in the rats treated with STZ, 10 nM vasopressin caused a rise in urea permeability to 16±5 x10⁻⁵ cm/sec, n=5, p<0.05 vs. basal condition (figure 2).
Figure 2.
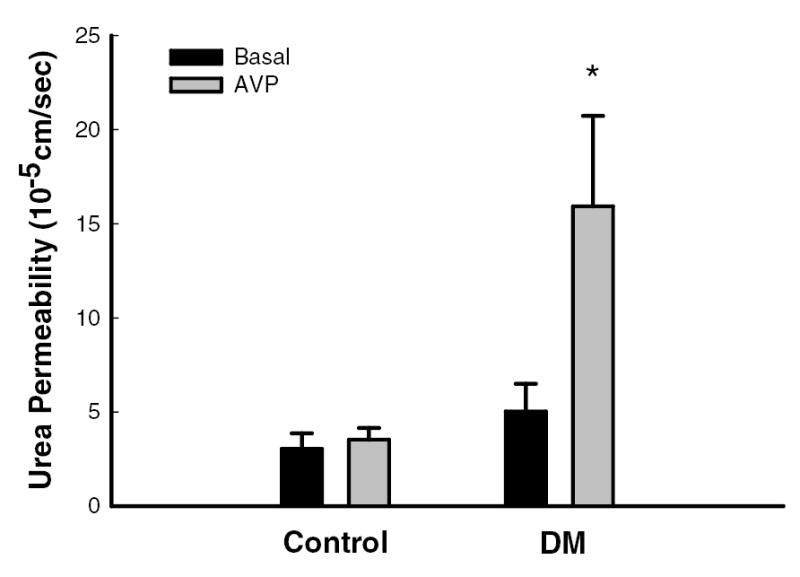
During basal conditions (black bars), facilitated urea permeability in the initial IMCD was similar in tubules isolated from control (n=4) and diabetic (DM, n=5) rats. Vasopressin (AVP, grey bars, 10 nM) significantly augmented urea permeability in tubules from DM rats but not from control rats. Data: mean ± SEM; *, p<0.05 vs. basal conditions.
Effect of forskolin on facilitated urea transport in initial IMCDs from diabetic rats
The effect of forskolin was assessed only in tubules isolated from diabetic rats. Forskolin (10 μM) significantly increased facilitated urea permeability from 6±2 to 13±4 x10⁻⁵ cm/sec, n=5, p<0.05 (figure 3).
Figure 3.
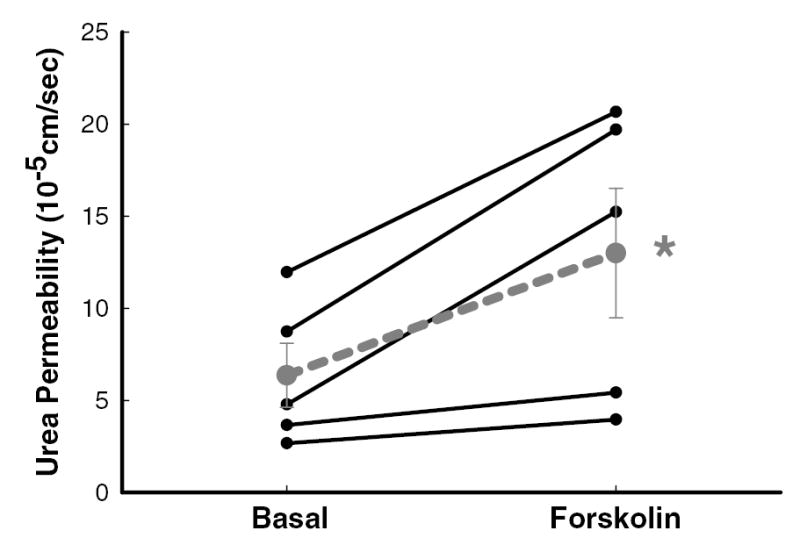
Forskolin (10 μM) significantly augmented urea permeability in the initial IMCD isolated from diabetic rats. Data: full lines – individual tubules (n=5); dashed line – mean ± SEM; *, p<0.05 vs. basal conditions.
Effect of changing osmolality on facilitated urea transport in initial IMCDs from diabetic rats
Changing osmolality had no effect on urea permeability in initial IMCD from diabetic rats. The basal (290 mOsm/kg H2O) urea permeability was 5±2 x10⁻⁵ cm/sec and remained similar, both when the osmolality of perfusion solutions was increased to 690 mOsm/kg H2O (8±2 x10⁻⁵ cm/sec) and when solutions were changed back to the original 290 mOsm/kg H2O solutions (9±3 x10⁻⁵ cm/sec, n=3, p=NS; figure 4).
Figure 4.
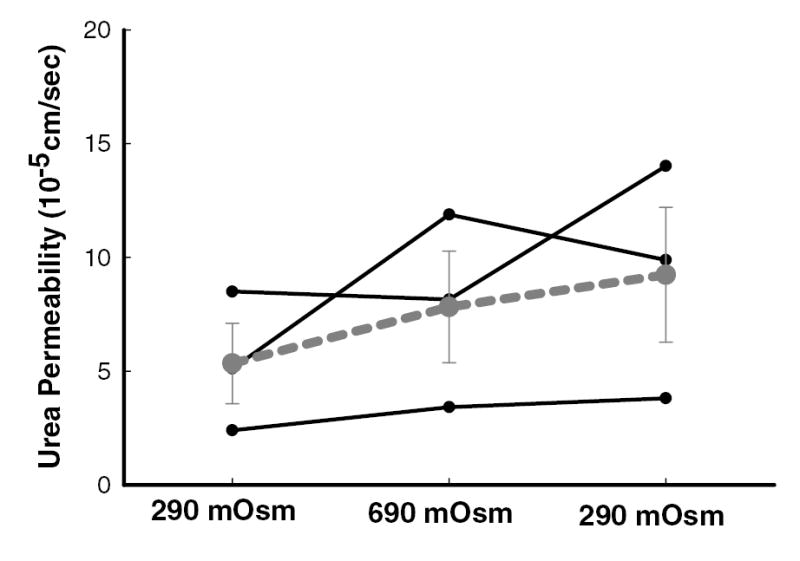
Increasing osmolality of perfusate and bath solutions from 290 to 690 mOsm/kg H2O and then reducing them back to 290 mOsm/kg H2O had no effect on urea permeability in the initial IMCD dissected from diabetic rats. Data: full lines – individual tubules (n=3); dashed line – mean ± SEM; p=NS.
Effect of hyperosmolality and vasopressin on facilitated urea transport in initial IMCDs from diabetic rats
Increasing osmolality of perfusion solutions to 690 mOsm/kg H2O did not significantly change facilitated urea permeability compared to basal condition (7 ± 1 vs. 11 ± 2 x10⁻⁵ cm/sec, n=5, p=NS; figure 5). In contrast, adding 10 nM vasopressin to the 690 mOsm/kg H2O bath solution did increase urea permeability to 27 ± 6 x10⁻⁵ cm/sec, n=5, p<0.05 (figure 5).
Figure 5.
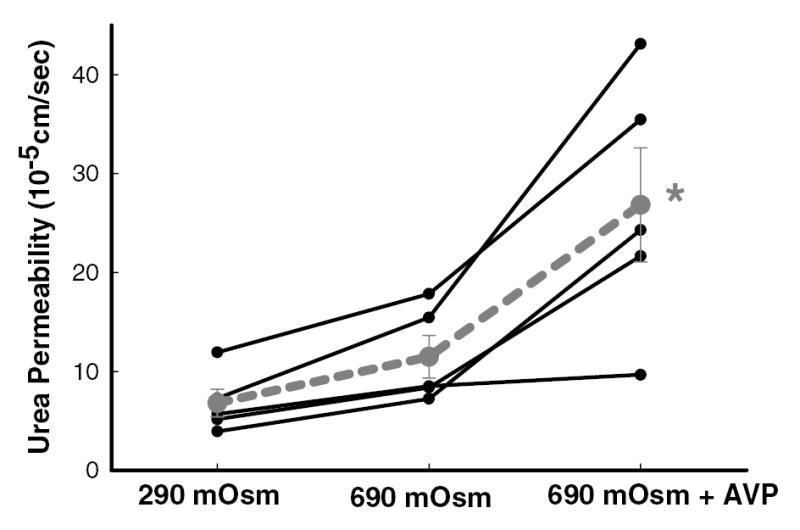
Increasing osmolality of perfusate and bath solutions from 290 to 690 mOsm/kg H2O had no effect on urea permeability in the initial IMCD dissected from diabetic rats. However, adding 10 nM vasopressin into the 690 mOsm/kg H2O bath solution increased urea permeability significantly. Data: full lines – individual tubules (n=5); dashed line – mean ± SEM; *, p<0.05 vs. 290 mOsm/kg H2O and 690 mOsm/kg H2O.
Active urea transport in initial IMCDs from diabetic rats
Active urea transport was measured without and with 10 nM vasopressin in the bath solution. Net urea flux under these conditions would indicate active urea transport. No net urea flux was detected in either condition in the initial IMCD dissected from diabetic rats (figure 6).
Figure 6.
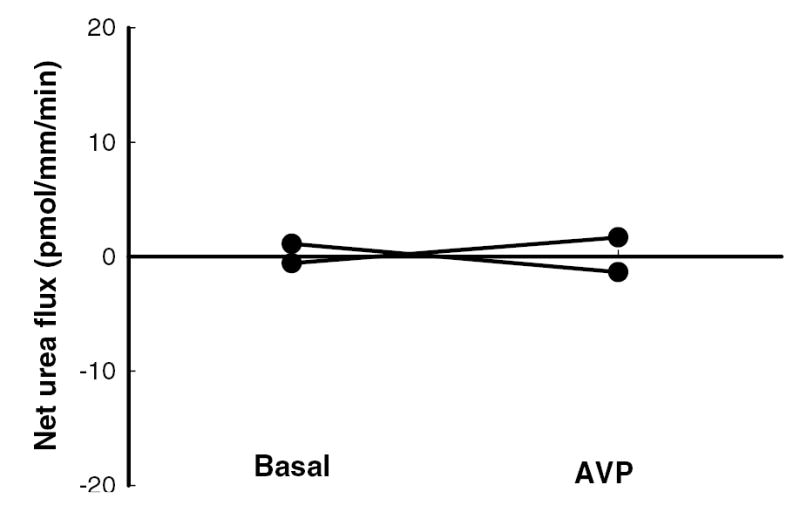
Net urea flux was close to zero in the initial IMCD dissected from diabetic rats, indicating no active urea transport, either during basal conditions (no vasopressin) or in the presence of 10 nM vasopressin (AVP) in the bath solution. Data: full lines – individual tubules (n=2).
DISCUSSION
This is the first study that demonstrates the functional characteristics of urea transport in the initial IMCD obtained from rats with pharmacologically induced diabetes mellitus. We find that in the absence of vasopressin (added to the bath fluid) urea permeability is similar in control and diabetic rats. In contrast, urea permeability is significantly increased upon stimulation with vasopressin or forskolin in diabetic but not in control rats. In vivo, the IMCD is under continuous regulation by vasopressin. Moreover, at least in some studies, diabetes increases plasma vasopressin levels (4, 22). This suggests that urea permeability is enhanced during diabetes mellitus in the initial IMCD in vivo, which may compensate for the ongoing osmotic diuresis (15).
In normal rats, urea permeability and expression of UT-A1, the most important urea transporter in the IMCD, gradually increases from the base to the tip of the IM (17, 18). In normal rats, vasopressin further augments urea permeability in the terminal IMCD. The augmentation is accomplished by activation of the V2 vasopressin receptor coupled to adenylyl cyclase and protein kinase A, which in turn phosphorylates both the 97 and 117 glycoprotein forms of UT-A1 (23). In contrast, in the initial IMCD, only the 97 kDa UT-A1 glycoprotein is detected and vasopressin does not affect the urea permeability (19). The mechanism(s) underlying the lack of vasopressin-stimulation in the initial IMCD from normal rats is not known. However, since V2-receptors are present throughout the IMCD and vasopressin increases water permeability in both the initial and terminal portions of the IMCD through V2-receptors (9, 16, 19), the difference in vasopressin’s ability to stimulate urea permeability in the initial vs. terminal IMCD cannot be explained by an absence of functional V2 receptors.
In contrast to the responses in normal rats, the present study shows that both vasopressin and forskolin increase urea permeability in the initial IMCD from diabetic rats, and that the IM base from diabetic rats expresses both the 97 and 117 kDa UT-A1 glycoproteins. In this, as well as in a previous study, we show that UT-A1 protein abundance enhanced in the IM base at 5 days after STZ injection and remains elevated up to day 20 (15). Moreover, the increment in UT-A1 is mainly due to the appearance of the 117 kDa glycoprotein, which is normally absent in this segment. The 117 kDa glycoprotein is also induced (in whole inner medulla) in rats that are fed a low protein diet, together with the appearance of vasopressin-stimulated urea permeability (2, 13, 21). These results suggest that the 117 kDa UT-A1 glycoprotein is necessary for vasopressin-stimulated urea transport. However, why the 97 kDa UT-A1 glycoprotein does not appear to be sensitive to vasopressin and the mechanisms by which UT-A1 is glycosylated to the 117 kDa form are not known.
We showed that hyperosmolality increases urea permeability in the terminal IMCD from normal rats, independently of vasopressin (20). This effect can be blocked either by buffering intracellular calcium or by inhibiting protein kinase C (11, 14). In contrast to the terminal IMCD, urea permeability in the initial IMCD from normal rats is insensitive to hyperosmolality, as it is to vasopressin (10). However, since vasopressin enhances the urea permeability in the initial IMCD from diabetic rats, we tested if these tubules also become sensitive to changes in osmolality. In two independent sets of experiments, we demonstrated that increasing osmolality of perfusate and bath solutions by adding NaCl has no effect on urea permeability in this segment. These results confirm the independent activation of urea transport by vasopressin and osmolality.
Feeding rats a low protein diet also causes reduced urinary concentrating ability and leads to upregulation of the 117 kDa UT-A1 glycoprotein (in whole inner medulla) and induces sensitivity to vasopressin in the initial IMCD (13, 21); changes similar to those observed during diabetes mellitus. In contrast, in an earlier report from our laboratory, we showed that hyperosmolality significantly stimulates urea permeability in the initial IMCD dissected from rats fed a low protein diet (2). Thus, diabetes mellitus and a low protein diet do not result in identical changes in urea transport in the initial IMCD. Interestingly, a low protein diet alters genes involved in insulin secretion from pancreatic islets (6) and decreases insulin secretion (8). This raises the hypothesis that reductions in circulating insulin levels may be involved in the change in urea transport in the initial IMCD. However, the difference in the response of the initial IMCD to hyperosmolality between diabetic and low-protein fed rats suggests that if reductions in circulating insulin levels are involved, they are not the only factor.
It is possible that we have not observed a significant effect of hyperosmolality in the present study because PKC mediated signaling may be altered during diabetes mellitus (for review see (7)). This conclusion, however, should be made with caution since PKC is rather activated during diabetes and/or by a high concentration of glucose (7), which should have augmented an eventual rise in urea permeability. Activation of PKC has been observed in glomerulus (5), proximal tubule (12) and mesangial cells (3), conversely, differences between specific PKC isoforms do exist (1) and which PKC isoform(s) is/are involved in regulation of urea transport in the IMCD is not known.
Whether the changes in urea permeability in the initial IMCD during diabetes mellitus are caused by hyperglycemia-induced osmotic diuresis as a causative factor or by diuresis in general cannot be determined from the present study. In the IM base of Brattleboro rats, we detect primarily the 97 kDa UT-A1 glycoprotein; a weak 117 kDa band is detected in some rats, but this is not a consistent finding (15). To our knowledge, urea permeability has not been measured in the initial IMCD from Brattleboro rats.
Finally, although no active urea transporters have been cloned, there is functional evidence for the presence of secondary active, Na+ dependent urea reabsorption the initial IMCD in several models of reduced urine concentrating ability (reviewed in (17)). Because induction of active urea reabsorption may improve urine concentrating ability, we also tested if any active urea transport is present in the initial IMCD from diabetic rats. However, we did not observe any active urea transport, either before or after stimulation with vasopressin.
In summary, we demonstrated that vasopressin and forskolin, but not increasing osmolality, enhance urea permeability in the initial IMCD in rats with pharmacologically induced diabetes mellitus type I. These findings support the hypothesis that urea permeability is enhanced during diabetes mellitus in the initial IMCD and also suggest that the 117 kDa UT-A1 glycoprotein is necessary for vasopressin-stimulated urea transport. These changes probably occur as compensatory mechanisms that permit the kidney to absorb water and solutes from the collecting ducts despite the ongoing osmotic diuresis.
Acknowledgments
This work was supported by NIH grants R01-DK41707, R01-DK63657, R01-DK62081, and P01-DK61521.
References
- 1.Amiri F, Garcia R. Renal angiotensin II receptors and protein kinase C in diabetic rats: effects of insulin and ACE inhibition. Am J Physiol Renal Physiol. 2000;278:F603–612. doi: 10.1152/ajprenal.2000.278.4.F603. [DOI] [PubMed] [Google Scholar]
- 2.Ashkar ZM, Martial S, Isozaki T, Price SR, Sands JM. Urea transport in initial IMCD of rats fed a low-protein diet: functional properties and mRNA abundance. Am J Physiol. 1995;268:F1218–1223. doi: 10.1152/ajprenal.1995.268.6.F1218. [DOI] [PubMed] [Google Scholar]
- 3.Ayo SH, Radnik R, Garoni JA, Troyer DA, Kreisberg JI. High glucose increases diacylglycerol mass and activates protein kinase C in mesangial cell cultures. Am J Physiol. 1991;261:F571–577. doi: 10.1152/ajprenal.1991.261.4.F571. [DOI] [PubMed] [Google Scholar]
- 4.Brooks DP, Nutting DF, Crofton JT, Share L. Vasopressin in rats with genetic and streptozocin-induced diabetes. Diabetes. 1989;38:54–57. doi: 10.2337/diab.38.1.54. [DOI] [PubMed] [Google Scholar]
- 5.Craven PA, DeRubertis FR. Protein kinase C is activated in glomeruli from streptozotocin diabetic rats. Possible mediation by glucose. J Clin Invest. 1989;83:1667–1675. doi: 10.1172/JCI114066. [DOI] [PMC free article] [PubMed] [Google Scholar]
- 6.Delghingaro-Augusto V, Ferreira F, Bordin S, do Amaral ME, Toyama MH, Boschero AC, Carneiro EM. A low protein diet alters gene expression in rat pancreatic islets. J Nutr. 2004;134:321–327. doi: 10.1093/jn/134.2.321. [DOI] [PubMed] [Google Scholar]
- 7.Derubertis FR, Craven PA. Activation of protein kinase C in glomerular cells in diabetes. Mechanisms and potential links to the pathogenesis of diabetic glomerulopathy. Diabetes. 1994;43:1–8. doi: 10.2337/diab.43.1.1. [DOI] [PubMed] [Google Scholar]
- 8.Ferreira F, Barbosa HC, Stoppiglia LF, Delghingaro-Augusto V, Pereira EA, Boschero AC, Carneiro EM. Decreased insulin secretion in islets from rats fed a low protein diet is associated with a reduced PKAalpha expression. J Nutr. 2004;134:63–67. doi: 10.1093/jn/134.1.63. [DOI] [PubMed] [Google Scholar]
- 9.Firsov D, Mandon B, Morel A, Merot J, Le Maout S, Bellanger AC, de Rouffignac C, Elalouf JM, Buhler JM. Molecular analysis of vasopressin receptors in the rat nephron. Evidence for alternative splicing of the V2 receptor. Pflugers Arch. 1994;429:79–89. doi: 10.1007/BF02584033. [DOI] [PubMed] [Google Scholar]
- 10.Gillin AG, Sands JM. Characteristics of osmolarity-stimulated urea transport in rat IMCD. Am J Physiol. 1992;262:F1061–1067. doi: 10.1152/ajprenal.1992.262.6.F1061. [DOI] [PubMed] [Google Scholar]
- 11.Gillin AG, Star RA, Sands JM. Osmolarity-stimulated urea transport in rat terminal IMCD: role of intracellular calcium. Am J Physiol. 1993;265:F272–277. doi: 10.1152/ajprenal.1993.265.2.F272. [DOI] [PubMed] [Google Scholar]
- 12.Hise MK, Mehta PS. Characterization and localization of calcium/phospholipid-dependent protein kinase-C during diabetic renal growth. Endocrinology. 1988;123:1553–1558. doi: 10.1210/endo-123-3-1553. [DOI] [PubMed] [Google Scholar]
- 13.Isozaki T, Verlander JW, Sands JM. Low protein diet alters urea transport and cell structure in rat initial inner medullary collecting duct. J Clin Invest. 1993;92:2448–2457. doi: 10.1172/JCI116852. [DOI] [PMC free article] [PubMed] [Google Scholar]
- 14.Kato A, Klein JD, Zhang C, Sands JM. Angiotensin II increases vasopressin-stimulated facilitated urea permeability in rat terminal IMCDs. Am J Physiol Renal Physiol. 2000;279:F835–840. doi: 10.1152/ajprenal.2000.279.5.F835. [DOI] [PubMed] [Google Scholar]
- 15.Kim D, Sands JM, Klein JD. Changes in renal medullary transport proteins during uncontrolled diabetes mellitus in rats. Am J Physiol Renal Physiol. 2003;285:F303–309. doi: 10.1152/ajprenal.00438.2002. [DOI] [PubMed] [Google Scholar]
- 16.Nonoguchi H, Owada A, Kobayashi N, Takayama M, Terada Y, Koike J, Ujiie K, Marumo F, Sakai T, Tomita K. Immunohistochemical localization of V2 vasopressin receptor along the nephron and functional role of luminal V2 receptor in terminal inner medullary collecting ducts. J Clin Invest. 1995;96:1768–1778. doi: 10.1172/JCI118222. [DOI] [PMC free article] [PubMed] [Google Scholar]
- 17.Sands JM. Molecular mechanisms of urea transport. J Membr Biol. 2003;191:149–163. doi: 10.1007/s00232-002-1053-1. [DOI] [PubMed] [Google Scholar]
- 18.Sands JM, Knepper MA. Urea permeability of mammalian inner medullary collecting duct system and papillary surface epithelium. J Clin Invest. 1987;79:138–147. doi: 10.1172/JCI112774. [DOI] [PMC free article] [PubMed] [Google Scholar]
- 19.Sands JM, Nonoguchi H, Knepper MA. Vasopressin effects on urea and H2O transport in inner medullary collecting duct subsegments. Am J Physiol. 1987;253:F823–832. doi: 10.1152/ajprenal.1987.253.5.F823. [DOI] [PubMed] [Google Scholar]
- 20.Sands JM, Schrader DC. An independent effect of osmolality on urea transport in rat terminal inner medullary collecting ducts. J Clin Invest. 1991;88:137–142. doi: 10.1172/JCI115269. [DOI] [PMC free article] [PubMed] [Google Scholar]
- 21.Terris J, Ecelbarger C, Sands J, Knepper M. Long-term regulation of renal urea transporter protein expression in rat. J Am Soc Nephrol. 1998;9:729–736. doi: 10.1681/ASN.V95729. [DOI] [PubMed] [Google Scholar]
- 22.Trinder D, Phillips PA, Stephenson JM, Risvanis J, Aminian A, Adam W, Cooper M, Johnston CI. Vasopressin V1 and V2 receptors in diabetes mellitus. Am J Physiol. 1994;266:E217–223. doi: 10.1152/ajpendo.1994.266.2.E217. [DOI] [PubMed] [Google Scholar]
- 23.Zhang C, Sands JM, Klein JD. Vasopressin rapidly increases phosphorylation of UT-A1 urea transporter in rat IMCDs through PKA. Am J Physiol Renal Physiol. 2002;282:F85–90. doi: 10.1152/ajprenal.0054.2001. [DOI] [PubMed] [Google Scholar]


