

Abstract
In the presence of ATP and the absence of Ca2+, the binding of myosin subfragment-1 to actin is only slightly inhibited by troponin-tropomyosin, while the actin-activated subfragment-1 ATPase rate is 95% inhibited (Chalovich, J. M., Chock, P. B., and Eisenberg, E. (1981) J. Biol. Chem. 256, 575–578). On the other hand, it has been reported the troponin-tropomyosin markedly inhibits the binding of heavy meromyosin (HMM) to actin in the presence of ATP and the absence of Ca2+, providing that the HMM has intact light chain 2 (Wagner, P. D., and Stone, D. (1982) Biochemistry 22, 1334–1342). In the present study, we reinvestigated the binding of HMM with 85% intact light chain 2, to regulated actin. If we assume that only a single population of HMM is present, the binding constant of HMM to regulated actin at 19 mM ionic strength is only about 3 times larger in the presence of Ca2+ than in the absence of Ca2+ (2.4 × 10⁴ m−1 compared to 8.8 × 10³ m−1). On the other hand, if we correct for the population of HMM with degraded light chain 2, the difference in the binding constants in the presence and absence of Ca2+ may be as great as 5-fold. A double binding experiment also suggested that HMM with intact light chain 2 binds at most 5 times more strongly to regulated actin in the presence of Ca2+ than in its absence. We conclude that, just as with subfragment-1, the primary effect of troponin-tropomyosin in regulating the acto · HMM ATPase activity is to inhibit a kinetic step in the ATPase cycle. However, our data with HMM also suggest that, in addition to this primary effect, troponin-tropomyosin may modulate the binding of the cross-bridge to actin in relaxed muscle to a small extent.
Contraction of vertebrate skeletal muscle results from the cyclic interaction of myosin with actin (2, 3) in an ATP-dependent process. Force generation and ATP hydrolysis are regulated by Ca2+ in a cooperative manner with half-maximal activation occurring at about 10−6 m Ca2+ (4, 5). It has been demonstrated in vitro that the protein complex troponin-tropomyosin is responsible for this Ca2+ regulation of the actomyosin ATPase activity (6, 7). The inhibitory effect of troponin-tropomyosin in the absence of Ca2+ both in vivo and in vitro has been postulated to be due to a steric blocking of the binding of myosin to actin (8–10). However, in a test of this model we found that the binding of S-11 (the proteolytic fragment of myosin containing only one of the two catalytic sites) to actin in the presence of ATP is only slightly reduced under conditions where the actin-activated ATPase rate is reduced to 5% of the rate in the presence of Ca2+ (11, 12). This result has been confirmed by Wagner and Giniger (13). On the basis of these data, we suggested that, rather than troponin-tropomyosin acting by sterically blocking the binding of the cross-bridge to actin, its primary effect is to markedly inhibit a step in the ATP hydrolysis cycle which occurs subsequent to the binding of S-1 to actin, perhaps Pi release. Similar results have also been obtained with proteins from smooth muscle (14) and molluscan muscle (15) although the regulatory systems in these muscles are very different from that of skeletal muscle. In support of these in vitro observations, we have found that, in relaxed skinned rabbit psoas fibers at very low ionic strength, a significant number of non-force-producing cross-bridges are attached to actin even in the absence of Ca2+ (16, 17).
In contrast to the in vitro results obtained with S-1, Wagner and co-workers (13, 18) have reported that, with HMM (the proteolytic fragment of myosin containing both catalytic sites), both the binding to actin and a subsequent hydrolytic step are affected by troponin-tropomyosin. At low ionic strength, where the effect of Ca2+ on the binding constant of S-1 to actin-troponin-tropomyosin (regulated actin) is less than 2-fold, Wagner and co-workers originally suggested that the binding constant of HMM may be changed as much as 20-fold. More recently, they have observed a 10-fold effect (19). Although such large effects of Ca2+ on HMM binding have not been observed by others (20) this has been attributed to the manner in which the HMM is prepared. In particular, Wagner and his co-workers have suggested that only HMM with intact light chain 2 associated with both catalytic sub-units shows Ca2+-sensitive binding to regulated actin. Light chain 2 is a noncovalently bound polypeptide of Mr 20,000 which has been found to play a regulatory role in the interaction of actin and myosin, particularly in the case of smooth muscle and scallop muscle myosin.
Because of the importance of determining whether troponin-tropomyosin regulates vertebrate skeletal muscle contraction by affecting both a kinetic step and the binding of the cross-bridge to actin, we have reinvestigated the Ca2+ dependence of the binding of HMM to actin-troponin-tropomyosin in the presence of ATP. We have observed that, although the effect of Ca2+ on the binding constant of HMM to regulated actin is greater than that observed with S-1, there is still only about a 3–5-fold difference in the binding strength of HMM to regulated actin in the presence and absence of Ca2+. Therefore, with HMM, as with S-1, the primary regulatory effect of troponin-tropomyosin is to inhibit the rate of a kinetic step subsequent to the binding of HMM to actin.
MATERIALS AND METHODS
Proteins
Myosin was prepared from rabbit back and leg muscles by the method of Kielley and Harrington (21) except that 1 mm dithiothreitol was added along with ammonium sulfate in place of EDTA. F-actin was prepared by a modification of the procedure of Spudich and Watt (22, 23). Troponin-tropomyosin was prepared according to Eisenberg and Kielley (23). Regulated actin was prepared by mixing actin with troponin-tropomyosin in either of two ways. Usually, regulated actin was prepared by mixing actin with a 50% excess of troponin-tropomyosin in 2 mm MgCl2, 4 mm imidazole, pH 7.0, and was used after overnight dialysis at 5 °C. Alternatively, regulated actin was prepared by a method similar to that used by Wagner et al. (24). Here, equal amounts by weight of actin and troponin-tropomyosin were mixed in 100 mm KCl, 2 mm MgCl2, 2 mm imidazole, pH 7.0, 0.2 mm dithiothreitol. After a 1-h incubation at 25 °C excess troponin-tropomyosin was removed by centrifugation at 100,000 × g for 3 h (24). We found no difference in the regulation by these two types of preparations. All solutions containing HMM or troponin-tropomyosin also contained 0.5 or 1 mm dithiothreitol.
Heavy meromyosin was made from freshly isolated myosin by the method of Weeds and Pope (25) except that digestion was at 25 °C for 2 min with 0.02–0.05 mg/ml chymotrypsin. Undigested myosin was separated from the HMM after dialysis against 20 mm NaCl, 10 mm imidazole, pH 7.0, 1 mm dithiothreitol at 4 °C by centrifugation for 1.5 h at 100,000 × g. This preparation of HMM is similar to that used by Wagner and Giniger (13). Later studies by Wagner and Stone (18) were done with column-purified HMM. Accordingly, most of our HMM preparations were purified by gel filtration on Sephacryl S-300 (superfine, Pharmacia). We never observed any differences in results between the column-purified and the normally purified preparations.
The quality of the HMM was routinely monitored by sodium dodecyl sulfate-polyacrylamide gel electrophoresis according to the Laemmli system (26). For examination of the heavy chains, 7% gels were run while heavily overloaded 13% gels were used to determine the light chain composition. The light chain 2 composition was determined by scanning gels at 590 nm with a Beckman DU-8 spectrophotometer equipped with a slab gel scanning accessory or by eluting the Coomassie Blue-stained protein bands in 20% pyridine and measuring the absorbance at 600 nm (27). The results of these two techniques differed by less than 10%. The amount of protein loaded on the gel was varied to ensure that Beer’s law was obeyed. The amount of intact light chain 2 present in the preparation was estimated by comparing the ratio of light chain 2 to the total light chains present. All studies on a given HMM preparation were completed within 1 week after its purification.
Protein concentrations were determined spectrophotometrically using the following absorption coefficients: 1150 cm2/g at 280 nm for F-actin, 650 cm2/g at 280 nm for HMM, and 380 cm2/g at 278 mm for troponin-tropomyosin. The molecular weights used for actin, HMM and troponin-tropomyosin are 42,000, 350,000, and 150,000, respectively.
ATPase Assays
ATPase rates were measured at 25 °C by determining the rate of liberation of [32P]Pi from [γ-32P]ATP (28) in a 1.5-ml volume. A single assay consisted of four or five time points. Actin-activated ATPase rates were measured in a solution containing 1 mm ATP, 3 mm MgCl2, 0.5 mm EGTA (or 0.5 mm Ca2+-EGTA), 10 mm imidazole, pH 7.0. NH4+-EDTA ATPase assays were also measured at 25 °C in a solution composed of 5 mm ATP, 0.4 M NH4Cl, 35 mm EDTA (Tris salt), 25 mm Tris · HCl, pH 8.0.
Binding Assays
Binding of HMM to regulated actin in the presence of ATP was measured by the centrifugation technique previously described (12). Because we have found some artifacts which resulted from poor mixing of HMM and high concentrations of regulated actin we describe our mixing procedure. The actin-troponin-tropomyosin was added to a 10 × concentrated buffered ATP solution in a 5-ml beaker. The mixture was then stirred with a magnetic stirrer and was checked visually for homogeneity. In cases where the mixture was inhomogeneous (usually when the stock actin-troponin-tropomyosin was greater than 200 μm in actin monomer) the mixture was gently homogenized in a Potter-Elvehjem homogenizer with a Teflon pestle. After the mixture was homogeneous an aliquot of HMM was added (usually 0.1 ml of HMM to 1.4 ml of the actin solution) with constant stirring. The reaction mixture was gently stirred for 2 min prior to centrifugation. The final solution composition was 1 mm ATP, 3 mm MgCl2, 10 mm imidazole, pH 7.0, 0.5 mm EGTA (or 0.5 mm Ca2+-EGTA). After centrifugation of the mixture in a Beckman Airfuge for 25 min, 0.12 ml of the supernatant was removed from each tube (0.2 ml total volume). The concentration of HMM was determined immediately by the NH4+-EDTA ATPase assay described above. Several experiments were also done with the centrifugation in a Beckman L2-65B preparative ultracentrifuge using a type 40 rotor at 40,000 rpm for 30 min. No difference was found between the results of the two methods.
RESULTS
The Ca2+ dependence of HMM binding is reported to depend on the presence of intact light chain 2 on the HMM. We have prepared HMM under mild conditions to ensure that light chain 2 is mostly intact. Fig. 1 shows polyacrylamide gel electrophoretic patterns of myosin and several typical HMM preparations. The amount of light chain 2, relative to the total light chains, is shown beneath each gel lane. Since the ratio of light chain 2 to total light chain is 0.43–0.46 in our column-purified HMM compared to 0.52 for myosin, at most 15% of light chain 2 is degraded in our HMM preparations. On 7% gels (not shown) it was determined that between 2 and 5% of the total protein, even in column-purified preparations, had the same mobility as myosin, indicating incomplete removal of undigested myosin. This slight impurity is not great enough to affect our results. Quantitation of the light chains was also done on urea-10% polyacrylamide gels, where the heavy chains do not enter into the gel matrix, and gave essentially the same results.
Fig. 1. Polyacrylamide gel electrophoresis of myosin and HMM.
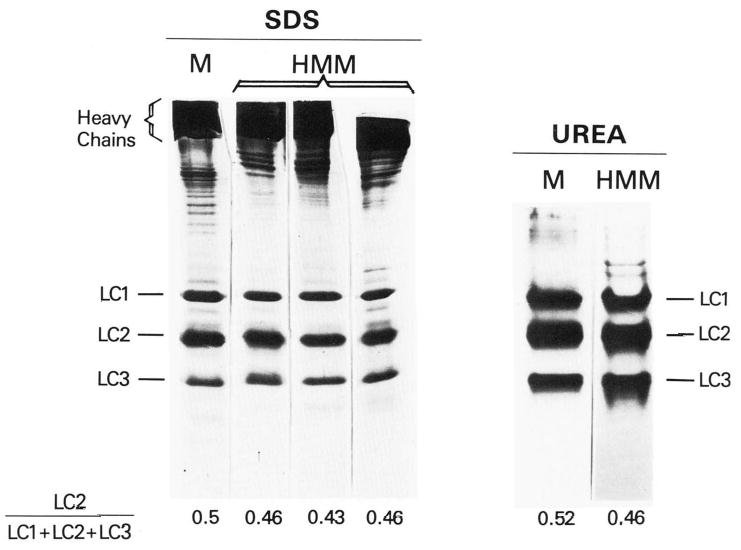
The 13% sodium dodecyl sulfate-polyacrylamide gels were run with 120 μg of myosin (M) or 60 μg of each of three HMM preparations. Gels are heavily overloaded to visualize the light chains. The 10% polyacrylamide-urea gels were run with 230 μg of myosin or 175 μg of HMM. Numbers below the gels are ratios of light chain 2 to the total light chains. LC1, light chain 1; LC2, light chain 2; LC3, light chain 3.
The Ca2+ sensitivity of the actin-activated HMM ATPase activity was 20–25-fold at relatively low regulated actin concentration, and much of this difference was maintained even at 120 μm actin, where the rates in the presence of Ca2+ were typically a factor of 15 greater than in the absence of Ca2+. Fig. 2 is a double-reciprocal plot of the steady-state ATPase rate versus actin concentration for a single HMM preparation. All rates were corrected for the rate of ATP hydrolysis by HMM alone (0.12 s−1) and are expressed as the rate per active site of HMM. The double-reciprocal plot with HMM is similar to that which we previously obtained with S-1 (12). Ca2+ has a large effect on Vmax, increasing it from 0.9 to 11.2 s−1, but has a much smaller effect on KATPase, increasing it from 1.6 × 10⁴ to 2.6 × 10⁴ m−1, only about a factor of 2. Wagner (19) obtained about a factor of 4 when comparing KATPase values with EGTA and Ca2+ on the same HMM preparation. To directly compare his KATPase values with ours, his values must be roughly increased by a factor of 2 because of the higher ionic strength employed in his experiments. On this basis, his KATPase value in Ca2+ would be 4 × 10⁴ m−1, slightly higher than our value, and his KATPpase value in EGTA would be 1.1 × 10⁴ m−1, slightly weaker than our value. It is not clear whether these differences are significant. We obtained similar values for a number of preparations. Therefore on the basis of our data, we conclude that HMM with intact light shows only about a 2–4-fold difference in KATPase values in EGTA and Ca2+.
Fig. 2. Double-reciprocal plot of the actin-activated ATPase activity of HMM.
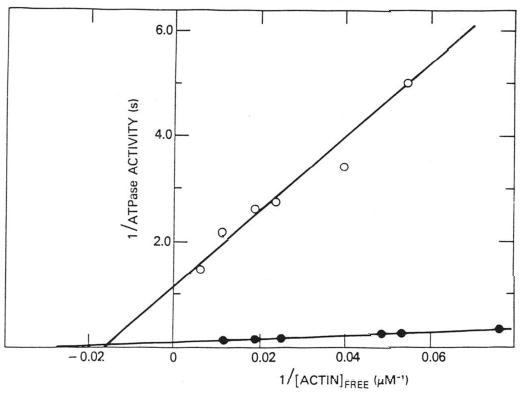
Rates are expressed per active site and are corrected for the rate of hydrolysis at zero actin (0.12 s−1). Reactions were run in the presence of Ca2+ (0.5 mm Ca2+-EGTA) (•) and absence of Ca2+ (0.5 mm EGTA) (○) in solutions containing 1 mm ATP, 3 mm MgCl2, 10 mm imidazole · HCl, 0.5 mm dithiothreitol, 0.15 μm HMM at 25 °C. In the presence of Ca2+, Vmax = 11.2 s−1 and KATPase = 2.6 × 10⁴ m−1; in the absence of Ca2+, Vmax = 0.9 s−1 and KATPase = 1.6 × 10⁴ m−1.
We next studied the binding of HMM to the actin-troponin-tropomyosin complex. We first examined the fraction of HMM bound to regulated actin in the presence of Ca2+ at 25 °C as a function of the free actin concentration. Fig. 3 shows a double-reciprocal plot of the binding data illustrating that the fraction of HMM bound increases toward 1.0 as the actin-troponin-tropomyosin concentration is increased. The best fit to the binding data was determined by using a non-linear least squares routine based on Marquardt’s compromise (29). It was assumed, in this fitting procedure, that all of the HMM was bound as the actin concentration approached infinity. The association constant determined from the least squares fit to the data in Fig. 3 is 2.4 × 10⁴ m−1. This value is similar to the values of the binding constants of S-1 to actin-troponin-tropomyosin of 1.5 × 10⁴ and 2.3 × 10⁴ m−1 reported by us earlier using the stopped-flow absorbance technique and the sedimentation technique, respectively (11, 12). This value is also within a factor of 2 of the binding constant of chymotryptic HMM at 20 °C determined by Wagner and Stone (18) (2–4 × 10⁴ m−1) and is consistent with the fraction of tryptic HMM observed to be bound to 100 μm actin under similar conditions by Inoue and Tonomura (20).
Fig. 3. Double-reciprocal plot of the binding of HMM to regulated actin in the presence of ATP and Ca2+.
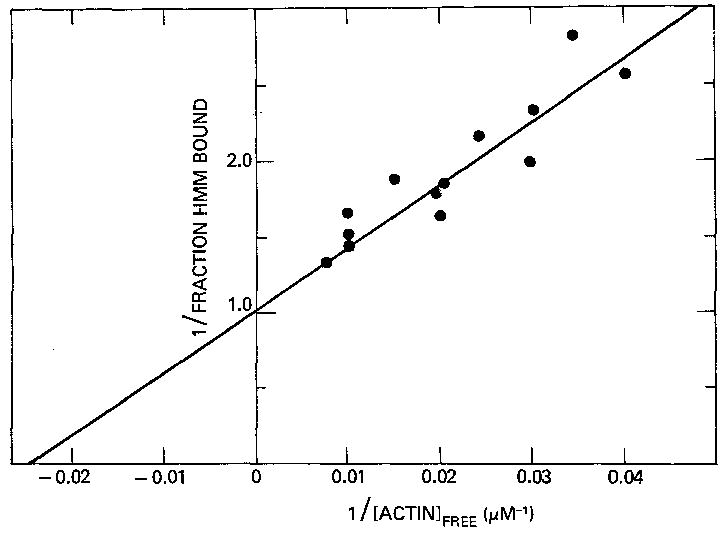
Binding was measured at 25 °C with 0.04 μm column-purified HMM in a solution containing 1 mm ATP, 3 mm MgCl2, 10 mm imidazole · HCl, pH 7.0, 0.5 mm Ca2+-EGTA, 1 mm dithiothreitol. Essentially the same fit (solid line) to the data is obtained whether one assumes a single population of HMM with K = 2.4 × 10⁴ m−1 or two populations of HMM: 70% with K = 2 × 10⁴ m−1 and 30% with K = 4 × 10⁴ m−1.
We next determined how the results of our binding study would be affected if we took into account the presence of HMM with degraded light chain 2. Wagner (19) reported that, in the presence of Ca2+, HMM with degraded light chain 2 binds, at most, twice as strongly to actin as HMM with intact light chain 2. In addition, our gels suggest that, at most 15% of light chain 2 is degraded. Therefore the most extreme assumptions we can make regarding the effect of this degraded light chain on our binding plot is that 30% of the HMM molecules have one degraded light chain and this fraction binds twice as strongly to actin as the remaining 70% of the HMM with intact light chain 2. On this basis, we find that we can fit our data if we assume that the HMM with degraded light chain 2 binds to actin with an association constant of 4 × 10⁴ m−1 and the HMM with intact light chain 2 binds with an association constant of 2 × 10⁴ m−1. Therefore, the theoretical curves for the binding profile are practically identical whether it is assumed that one or two populations of HMM are present.
We next repeated this experiment in the absence of Ca2+. Fig. 4 is a double-reciprocal plot of the fraction of HMM bound to actin as a function of the free actin concentration. The results with several HMM and regulated actin preparations are shown. The binding increases with increasing actin concentration, reaching more than 55% binding at the highest actin concentrations. A total of 21 binding measurements were made above 140 μm actin, representing 13 different HMM preparations; in every case the fraction of HMM bound was near to or greater than 50%. For clarity, these data are shown as a single averaged point in Fig. 4 (solid circle with error bars). These data differ from the data of Wagner and Stone (18), where only 30% of the HMM was observed to be bound at high actin concentrations. More recently Wagner (19) has also observed almost 50% of the HMM bound to actin at the highest actin concentrations he employed.
Fig. 4. Double-reciprocal plot of the binding of HMM to regulated actin in the presence of ATP and absence of Ca2+.
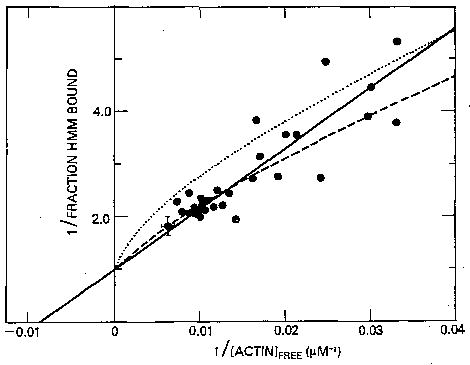
Conditions are the same as in Fig. 3 except that the HMM concentration used was 0.08–0.3 μm, and 0.5 mm EGTA replaced 0.5 mm Ca2+-EGTA. The solid circle with error bars represents 21 measurements with 13 preparations. Theoretical curves are for a single population with K = 8.6 × 10³ m−1 (solid line), for two populations, 70% with K = 4 × 10³ m−1 and 30% with K = 4 × 10⁴ m−1 (dashed line) and for two populations, 70% with K = 2 × 10³ m−1 and 30% with K = 4 × 10⁴ m−1 (dotted line).
The data in Fig. 4 are fit equally well assuming either a single population of HMM with an association constant of 8.6 × 10³ m−1 (solid line) or two populations with the 70% of the HMM with intact light chain 2 having an association constant of 4 × 10³ m−1 and the 30% of the HMM with degraded light chain 2 having an association constant of 4 × 10⁴ m−1 (dashed line). This latter percentage and association constant are the most extreme assumptions we can make regarding the effect of HMM with degraded light chain 2 on our binding plots as we described above for Ca2+. Therefore, since the binding constant of HMM with intact light chain 2 in Ca2+ is 2 × 10⁴ m−1, the Ca2+ sensitivity of binding of intact HMM is about 3-fold assuming a single population of HMM and about 5-fold assuming two HMM populations. Whereas in the presence of Ca2+ the binding constant of HMM to actin-troponin-tropomyosin is similar to the binding constant of S-1, in the absence of Ca2+ the binding constant of HMM is 2–4-fold weaker than the binding constant of S-1 (1.3–1.4 × 10⁴ m−1).
To determine whether the Ca2+ sensitivity of binding could be more than 5-fold, we also did a theoretical fit for two populations of HMM with binding constants of 4 × 10⁴ m−1 for the 30% of the population with damaged light chain 2 and 2 × 10³ m−1 (rather than 4 × 10³ m−1) for the 70% of the population with intact light chain 2 (dotted line). This theoretical curve is a poor fit to the data; the binding at high actin concentrations is consistently greater than the theoretical curve predicts. Therefore, our data suggest that it is unlikely that there is as much as a 10-fold Ca2+ sensitivity in the binding of HMM to regulated actin. A summary of the measured and calculated association constants is given in Table I.
Table I.
Binding constants of HMM to actin-tropomyosin-troponin
| Ca2+ | EGTA | Ca2+/EGTA | Reference |
|---|---|---|---|
| 2.4 × 10⁴ m−1a | 8.6 × 10³ m−1a | 2.8 | This paper |
| 2 × 10⁴ m−1b | 4 × 10³ m−1b | 5 | This paper |
| 2–4 × 10⁴ m−1 | 4 × 10³ m−1 | 5–10 | Wagner (19) |
Values calculated assuming a single population of HMM as described in the text.
Values calculated assuming two fractions of HMM as described in the text.
As another approach to show that the binding constant of intact HMM to actin in the absence of Ca2+ is not less than 4 × 10³ m−1, we did a double binding experiment. HMM was mixed with enough regulated actin to give roughly 50% bound. If there are two populations of HMM, the supernatant should be enriched in the less tightly binding fraction, i.e. the fraction of HMM with intact light chain 2. Repeating the binding with this supernatant fraction of HMM will then give a better estimate of the binding constant of intact HMM in the absence of Ca2+. This double binding experiment was done at 5 °C to reduce the rate of ATP utilization which was increased by the high concentrations of HMM required for this 2-stage experiment. Therefore, it was first necessary to show that the Ca2+ sensitivity of binding is the same at 5 as at 25 °C.
Fig. 5 shows the binding of HMM to actin-troponin-tropomyosin at 5 °C. At this lower temperature, the difference in the association constant between experiments done in the presence and absence of Ca2+ is maintained. Assuming a single population of HMM, the data can be fitted with a binding constant of 2.6 × 10⁴ m−1 in the presence of Ca2+ and 8.4 × 10³ m−1 in the absence of Ca2+. These binding constants are very similar to those measured at 25 °C. Unlike the binding of S-1 to actin in the presence of ATP, which is weaker at 5 than at 25 °C (5.5 × 10³ m−1 compared to 1.4 × 10³ m−1 (16)), the binding of HMM to actin in the presence of ATP apparently is not temperature-dependent.
Fig. 5. Double-reciprocal plot of the binding of HMM to regulated actin in the presence of ATP at 5 °C.
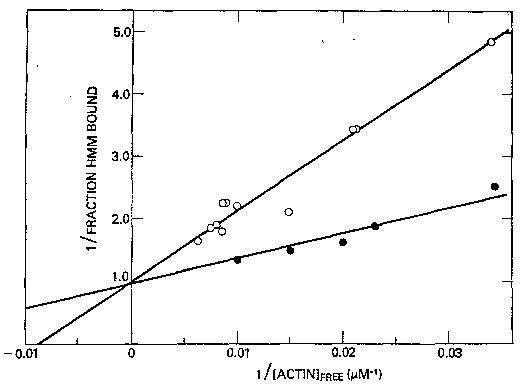
Binding in EGTA (○) fit to a binding constant of 8.4 × 10³ m−1. Binding in Ca2+-EGTA (•) fit with a binding constant of 2.6 × 10⁴ m−1. Conditions are the same as in Fig. 1 except that the HMM concentrations used were 0.2 μm in the presence of Ca2+ and 0.2–1.1 μm in the absence of Ca2+.
Having determined that the binding of HMM to actin is similar at 5 and 25 °C, a double binding experiment was done. The reaction mixture contained 1.1 μm HMM and roughly 100 μm regulated actin; the control contained no actin. Both the reaction mixture and the control were centrifuged simultaneously and the supernatant of each was removed and bifurcated. One aliquot of the experimental solution was analyzed to determine the extent of binding to actin. This value was corrected for the nonspecific sedimentation of HMM in the control. The other aliquot was added back to regulated actin and conditions were made similar to those at the first centrifugation. The supernatant of the control was similarly treated except for the omission of actin. The two aliquots were again centrifuged and the supernatants were analyzed to determine the binding to actin.
Table II summarizes the results of these experiments. During the first centrifugation of experiment A, 45% of the HMM bound to the 111 μm actin, and upon readdition of the supernatant to 138 μm actin, 56% of the HMM bound. If there were a single population of HMM with K = 8.6 × 10³ m−1 the fraction bound in the second binding experiment should be 54%. If there were two populations, 70% with K = 4 × 10³ m−1 and 30% with K = 4 × 10⁴ m−1, the amount bound after the second centrifugation should be 45%. Both of these cases are consistent with the data in Table I. On the other hand, with two populations of K = 2 × 10³ m−1 and K = 4 × 10⁴ m−1, the predicted binding is 29%, which is not in agreement with our data. Experiment B is similar to experiment A except that the second sedimentation was done at 25 °C. Experiment C was done with a different preparation of HMM, actin, and troponin-tropomyosin. In each case the data are inconsistent with the occurrence of a very weakly binding fraction of HMM.
Table II.
Double binding experiment of HMM · ATP to regulated actin
| Sedimentation | [Actin] | Fraction of HMM bound |
|---|---|---|
| μm | ||
| First | 111 | 0.45 |
| Second | 138 | 0.56 |
| First | 111 | 0.45 |
| Second | 138 | 0.54 |
| First | 118 | 0.56 |
| Second | 123 | 0.52 |
DISCUSSION
In the present paper we have extended our previous work with S-1 to the interaction of HMM and regulated actin in the presence of ATP. One point on which there is clear agreement is that, like S-1, HMM shows a marked inhibition of its maximal ATPase activity by troponin-tropomyosin in the absence of Ca2+. This is true for both HMM with intact and digested light chain 2. On the other hand, it has proven to be quite difficult to quantitate exactly how much effect troponin-tropomyosin has on the binding of HMM with intact light chain 2 to regulated actin in the absence of Ca2+. Wagner and Stone (18) originally reported a 20-fold difference between the binding of HMM with intact light chain to regulated actin in the presence and absence of Ca2+. However, more recently Wagner (19) observed only a 5–10-fold difference in this binding, and even more striking, El-Saleh and Potter (30), working at physiological ionic strength, observed almost no difference in this binding.
Based on the data presented in this paper, we would suggest that the major difficulty in obtaining an accurate estimate of the binding strength of HMM with light chain 2 to regulated actin is that, even in the best preparations of HMM, about 15% of the HMM heads have digested light chain 2. Unfortunately, estimates of the Ca2+ sensitivity of the binding of intact HMM to actin depend crucially on the assumptions that are made regarding the amount and strength of the binding of HMM with digested light chain 2 to actin both in the presence and absence of Ca2+. Referring to Table I, Wagner (19) has suggested that there may be a 5–10-fold difference in the binding of HMM with intact light chain 2 to actin in the presence and absence of Ca2+. However, if we ignore the presence of the damaged HMM fraction, then we observe less than a 3-fold difference in the strength of binding of HMM to regulated actin in the presence and absence of Ca2+. This is the case even though our actual binding data are within a factor of 2 of the data obtained by Wagner (19), taking into consideration the small difference in ionic strength in the two studies. On the other hand, if we make the worst possible assumption, i.e. that 15% digested HMM heads means 30% damaged HMM and that this damaged HMM binds twice as strongly to actin as intact HMM in the presence of Ca2+, then we obtain a different result. Our best fit to the data suggests a 5-fold difference in the strength of binding of intact HMM to actin in the presence and absence of Ca2+, and on the basis of the binding data alone, even a 10-fold difference cannot be absolutely ruled out, although it does not fit the data well and is not compatible with the results of our double binding experiment. No doubt, the data of El-Saleh and Potter (30) could also be interpreted very differently if it was assumed that 30% of their HMM preparation showed no Ca2+ sensitivity in binding to regulated actin, since, at the ionic strength where they are working, at most 30% of the HMM binds to regulated actin.
There can be little doubt from the work of Wagner and his co-workers that, in the absence of Ca2+, HMM with damaged light chain 2 binds considerably more tightly to actin than HMM with intact light chain 2. The difficulty is that it is not known if HMM with one or two damaged light chains binds equally well to HMM. Nor is it known if digestion of one of the two light chains makes digestion of the second light chain more likely, in which case HMM with one digested light chain may not occur randomly. Finally, it is not known whether digestion of the light chain has a 2-fold strengthening effect on the binding of HMM to actin in the presence of Ca2+.
The occurrence of these ambiguities means that at the present time we simply do not know for certain whether the difference in the binding of HMM to regulated actin in the presence and absence of Ca2+ is as little as 2–3-fold or as much as 5–10-fold. We would assume from the data presented in this paper that a difference as large as 10-fold is unlikely, particularly in the light of the results of our double binding experiment. However, even a 3-fold difference is somewhat larger than the difference which occurs with S-1. There could be two reasons for this. First, it is possible that, at least to some extent, both heads of HMM are binding to actin under the very low ionic strength conditions of our experiments. To the extent that this occurs, a 2-fold effect observed with S-1 will become a 4-fold effect with HMM. Since it seems unlikely, given the strength of binding which we observe, that all of the HMM is binding with two heads, this explanation might account for a 3-fold difference in the binding strength of intact HMM to actin in the presence and absence of Ca2+, but it could not explain a 5–10-fold difference. It would also not explain why HMM with damaged light chain shows less Ca2+ sensitivity in its binding to actin than HMM with intact light chain.
An alternate explanation for the difference in the Ca2+ sensitivity of S-1 and HMM is that it is a real effect related to the presence of intact light chain on HMM as proposed by Wagner and his collaborators (18, 19). With S-1, Ca2+ sensitivity in binding is only observed for the strong binding states, S-1 and S-1 · ADP, and not for the weak binding states S-1 · ATP and S-1 · ADP · Pi (31). If, in contrast to S-1 · ATP and S-1 · ADP · Pi, the weak binding states, HMM · ATP and HMM · ADP · Pi, show Ca2+ sensitivity in their binding, it opens up the possibility that these states might also bind differently to the two functional forms of the regulated actin filament, the weak S-1 binding state and the strong S-1 binding state (31). If so, in contrast to S-1 · ATP and S-1 · ADP · Pi, HMM · ATP and HMM · ADP · Pi might bind cooperatively to the regulated actin filament. Further work will be required to determine whether such cooperative binding occurs.
In conclusion, our data confirm that, with HMM, as with S-1, the primary effect of troponin-tropomyosin in vitro is to block a kinetic step in the actomyosin ATPase cycle in the absence of Ca2+. However, our data also suggest that there could be a 3–5-fold difference in the binding of HMM · ATP with intact light chains to actin in the presence and absence of Ca2+. Our data, in particular the double binding experiment, do not appear to be consistent with a 10-fold difference in this binding. A 3–5-fold difference in the binding strength of HMM to regulated actin in the presence and absence of Ca2+ may play a modulatory effect in vivo, reducing the number of cross-bridges which are bound to actin in relaxed muscle. However, even a 5-fold effect of troponin-tropomyosin on the binding of the cross-bridge to actin in vivo could not be the primary mechanism of muscle relaxation. It seems more likely that this primary event is inhibition of a kinetic step, e.g. Pi release, which is associated with force production in vivo. A similar primary mechanism of relaxation also seems to occur in smooth muscle (14) and scallop muscle (15).
Footnotes
The abbreviations used are: S-1, myosin subfragment-1; HMM, heavy meromyosin; EGTA, [ethylenebis(oxyethylenenitrilo)]tetraacetic acid.
A preliminary report of this work was presented at the Biophysical Society Meeting, San Antonio, TX, February 19, 1984 (1).
References
- 1.Chalovich JM, Eisenberg E. Biophys. J. 1984;45:221. (abstr.) [Google Scholar]
- 2.Huxley AF, Niedergerke R. Nature. 1954;173:971–973. doi: 10.1038/173971a0. [DOI] [PubMed] [Google Scholar]
- 3.Huxley HE, Hanson J. Nature. 1954;173:973–976. doi: 10.1038/173973a0. [DOI] [PubMed] [Google Scholar]
- 4.Potter JD, Gergely J. J Biol Chem. 1975;250:4628–4633. [PubMed] [Google Scholar]
- 5.Brandt PW, Cox RN, Kawai M. Proc Natl Acad Sci U S A. 1980;77:4717–4720. doi: 10.1073/pnas.77.8.4717. [DOI] [PMC free article] [PubMed] [Google Scholar]
- 6.Ebashi S, Kodama A. J Biochem (Tokyo) 1966;60:733–734. doi: 10.1093/oxfordjournals.jbchem.a128504. [DOI] [PubMed] [Google Scholar]
- 7.Hartshorne DJ, Mueller H. J Biol Chem. 1967;242:3089–3092. [PubMed] [Google Scholar]
- 8.Haselgrove JC. Cold Spring Harbor Symp Quant Biol. 1972;37:341–352. [Google Scholar]
- 9.Huxley HE. Cold Spring Harbor Symp Quant Biol. 1972;37:361–376. [Google Scholar]
- 10.Parry DAP, Squire JM. J Mol Biol. 1973;75:33–55. doi: 10.1016/0022-2836(73)90527-5. [DOI] [PubMed] [Google Scholar]
- 11.Chalovich JM, Chock PB, Eisenberg E. J Biol Chem. 1981;256:575–578. [PMC free article] [PubMed] [Google Scholar]
- 12.Chalovich JM, Eisenberg E. J Biol Chem. 1982;257:2432–2437. [PMC free article] [PubMed] [Google Scholar]
- 13.Wagner PD, Giniger E. J Biol Chem. 1981;256:12647–12650. [PubMed] [Google Scholar]
- 14.Sellers JR, Eisenberg E, Adelstein RS. J Biol Chem. 1982;257:13880–13883. [PubMed] [Google Scholar]
- 15.Chalovich JM, Chantler PD, Szent-Gyorgyi AG, Eisenberg E. J Biol Chem. 1984;259:2617–2621. [PMC free article] [PubMed] [Google Scholar]
- 16.Brenner B, Schoenberg M, Chalovich JM, Greene LE, Eisenberg E. Proc Natl Acad Sci U S A. 1982;79:7288–7291. doi: 10.1073/pnas.79.23.7288. [DOI] [PMC free article] [PubMed] [Google Scholar]
- 17.Schoenberg, M., Brenner, B., Chalovich, J. M., Greene, L. E., and Eisenberg, E. (1984) in Contractile Mechanisms in Muscle (Sugi, H., and Pollack, G. H., eds) Vol. 1, pp. 269–284, Plenum Publishing Corp., New York
- 18.Wagner PD, Stone D. Biochemistry. 1983;22:1334–1342. doi: 10.1021/bi00275a003. [DOI] [PubMed] [Google Scholar]
- 19.Wagner PD. Biochemistry. 1984;23:5950–5956. doi: 10.1021/bi00320a010. [DOI] [PubMed] [Google Scholar]
- 20.Inoue A, Tonomura Y. J Biochem (Tokyo) 1982;91:1231–1239. doi: 10.1093/oxfordjournals.jbchem.a133807. [DOI] [PubMed] [Google Scholar]
- 21.Kielley WW, Harrington WF. Biochim Biophys Acta. 1960;41:401–421. doi: 10.1016/0006-3002(60)90037-8. [DOI] [PubMed] [Google Scholar]
- 22.Spudich JA, Watt S. J Biol Chem. 1971;246:4866–4871. [PubMed] [Google Scholar]
- 23.Eisenberg E, Kielley WW. Cold Spring Harbor Symp Quant Biol. 1972;37:145–152. [Google Scholar]
- 24.Wagner PD, Slater CS, Pope B, Weeds AG. Eur J Biochem. 1979;99:385–394. doi: 10.1111/j.1432-1033.1979.tb13267.x. [DOI] [PubMed] [Google Scholar]
- 25.Weeds AG, Pope B. J Mol Biol. 1977;111:129–157. doi: 10.1016/s0022-2836(77)80119-8. [DOI] [PubMed] [Google Scholar]
- 26.Laemmmli UK. Nature. 1970;227:680–685. doi: 10.1038/227680a0. [DOI] [PubMed] [Google Scholar]
- 27.Fenner C, Traut RR, Mason DT, Wikman-Coffelt J. Anal Biochem. 1975;63:595–602. doi: 10.1016/0003-2697(75)90386-3. [DOI] [PubMed] [Google Scholar]
- 28.Chock SP, Eisenberg E. J Biol Chem. 1979;254:3229–3235. [PubMed] [Google Scholar]
- 29.Bevington, P. R. (1969) Data Reduction and Error Analysis for the Physical Sciences, pp. 235–250, McGraw-Hill, New York
- 30.El-Saleh SC, Potter JD. Biophys J. 1985;47:308a. [Google Scholar]
- 31.Chalovich JM, Greene LE, Eisenberg E. Proc Natl Acad Sci U S A. 1983;80:4909–4913. doi: 10.1073/pnas.80.16.4909. [DOI] [PMC free article] [PubMed] [Google Scholar]