

Abstract
RNA localization and regulation are critical for cellular function, yet many live RNA imaging tools suffer from limited sensitivity due to background emissions from unbound probes. Here, we introduce conditionally stable variants of MS2 and PP7 coat proteins (which we name dMCP and dPCP) designed to decrease background in live-cell RNA imaging. Using a protein engineering approach that combines circular permutation and degron masking, we generated dMCP and dPCP variants that rapidly degrade except when bound to cognate RNA ligands. These enhancements enabled the sensitive visualization of single mRNA molecules undergoing differential regulation within various sub-compartments of live cells. We further demonstrate dual-color imaging with orthogonal MS2 and PP7 motifs, allowing simultaneous low-background visualization of distinct RNA species within the same cell. Overall, this work provides versatile, low-background probes for RNA imaging, which should have broad utility in the imaging and biotechnological utilization of MS2- and PP7-containing RNAs.
INTRODUCTION
The regulation of messenger RNA (mRNA) abundance, localization, and translation is crucial for many cellular behaviors.1,2 These include ensuring correct targeting of proteins for secretion,3 controlling cell motility in response to external stimuli,4 and facilitating synaptic plasticity between connected neurons.5 Knowing where and when these processes occur is critical for understanding the causes and effects of mRNA regulation. As such, methods that allow researchers to visualize the localization and dynamics of single mRNAs have become valuable tools for investigating RNA biology.
User-friendly imaging probes that can be readily implemented in living specimens are especially important for tracking mRNA dynamics in real time,6 with the most widely used tools being bacteriophage-derived components: the MS2 and PP7 coat proteins (MCP and PCP) and their cognate MS2 and PP7 RNA hairpins.7–9 By expressing fluorescent protein (FP)-fused MCP or PCP, researchers can track single transcripts tagged with MS2 and/or PP7 arrays. An additional benefit of this strategy is that FPs can be readily substituted with new sequences for e.g. multicolor imaging.
However, selectively visualizing tagged RNAs with these probes can be challenging due to background emissions from unbound coat proteins, which can hinder detection of RNA-bound species. To overcome this challenge, researchers have exploited nuclear localization signals (NLSs) to direct and sequester unbound coat proteins within the nucleus, allowing mature mRNAs to be visualized with increased contrast in the cytoplasm.7 Alternatively, RNA-specific contrast can be enhanced by increasing the number of fluorophores targeted to a given RNA.10–12 While these strategies can enhance the detectability of tagged RNAs, they do not offer a solution to the broader challenge of mismatched coat protein-stem loop stoichiometries, a primary limiting factor in the specificity and utility of MS2- and PP7-based technologies.
Recently, RNA-responsive reporter systems, such as fluorogenic aptamers13–15 and RNA-templated protein complementation,16–18 have been developed as alternatives to traditional coat protein-based strategies. In these approaches, signal generation is made RNA-dependent, thus allowing users to track tagged RNAs and quantify their levels throughout cells. However, practical limitations make implementing these probes challenging in certain contexts. For example, aptamer-based systems require exogenous chromophores, which can be challenging to supply and maintain in certain cells and model systems. These methods can be further restricted due to the limited brightness and availability of their associated chromophores. Overall, an ideal system would combine the versatility of direct protein fusions with the reduced background and RNA-dependent signals of fluorogenic systems.
In more recent work, a labeling strategy that meets these criteria was developed based on so-called ‘fluorogenic proteins.’ In this approach, a conditionally stable RNA-binding protein is designed to be degraded unless bound to its target RNA, thereby reducing the levels of unbound proteins while rendering tagged RNAs visible via binding-induced reporter protein preservation.19 To develop such a probe, a virally-derived Tat peptide was modified to contain a C-terminal degron,20 resulting in a 19 amino acid sequence (called ‘tDeg’), which renders proteins unstable while maintaining the ability to bind TAR-like RNA sequences (called ‘Pepper’). Critically, binding to Pepper-tagged RNAs induces the selective stabilization of tDeg-tagged proteins, an effect that is facilitated via Pepper-mediated shielding of the degron, which in turn neutralizes its recognition by cellular machinery.
Recognizing the utility of multicolor RNA imaging and motivated by a growing need for improved RNA-binding tools, we set out to complement the tDeg strategy by developing destabilized versions of MCP and PCP. In natural contexts, MCP and PCP bind their cognate hairpins via orientations in which their N- and C-termini are solvent-exposed. Thus, to render them conditionally stable, we implemented a two-step approach in which (1) circular permutation was used to reorient their termini to RNA-adjacent locations, followed by (2) the attachment and positional optimization of RNA-maskable C-degrons (Fig. 1a). Using this approach, we generated a conditionally stable MCP that is efficiently degraded by cells while undergoing a >50-fold stability enhancement in response to MS2 binding. We confirmed the versatility of the domain by testing diverse fusions in fluorescence and bioluminescent assays. Furthermore, we exploited its RNA-dependent nature to sensitively visualize and record single mRNA dynamics throughout various subcellular locales, including within the nucleus and cytoplasm, and on the surfaces of mitochondria and the endoplasmic reticulum (ER).
Figure 1. Design of an RNA-dependent conditionally stable MS2 coat protein.
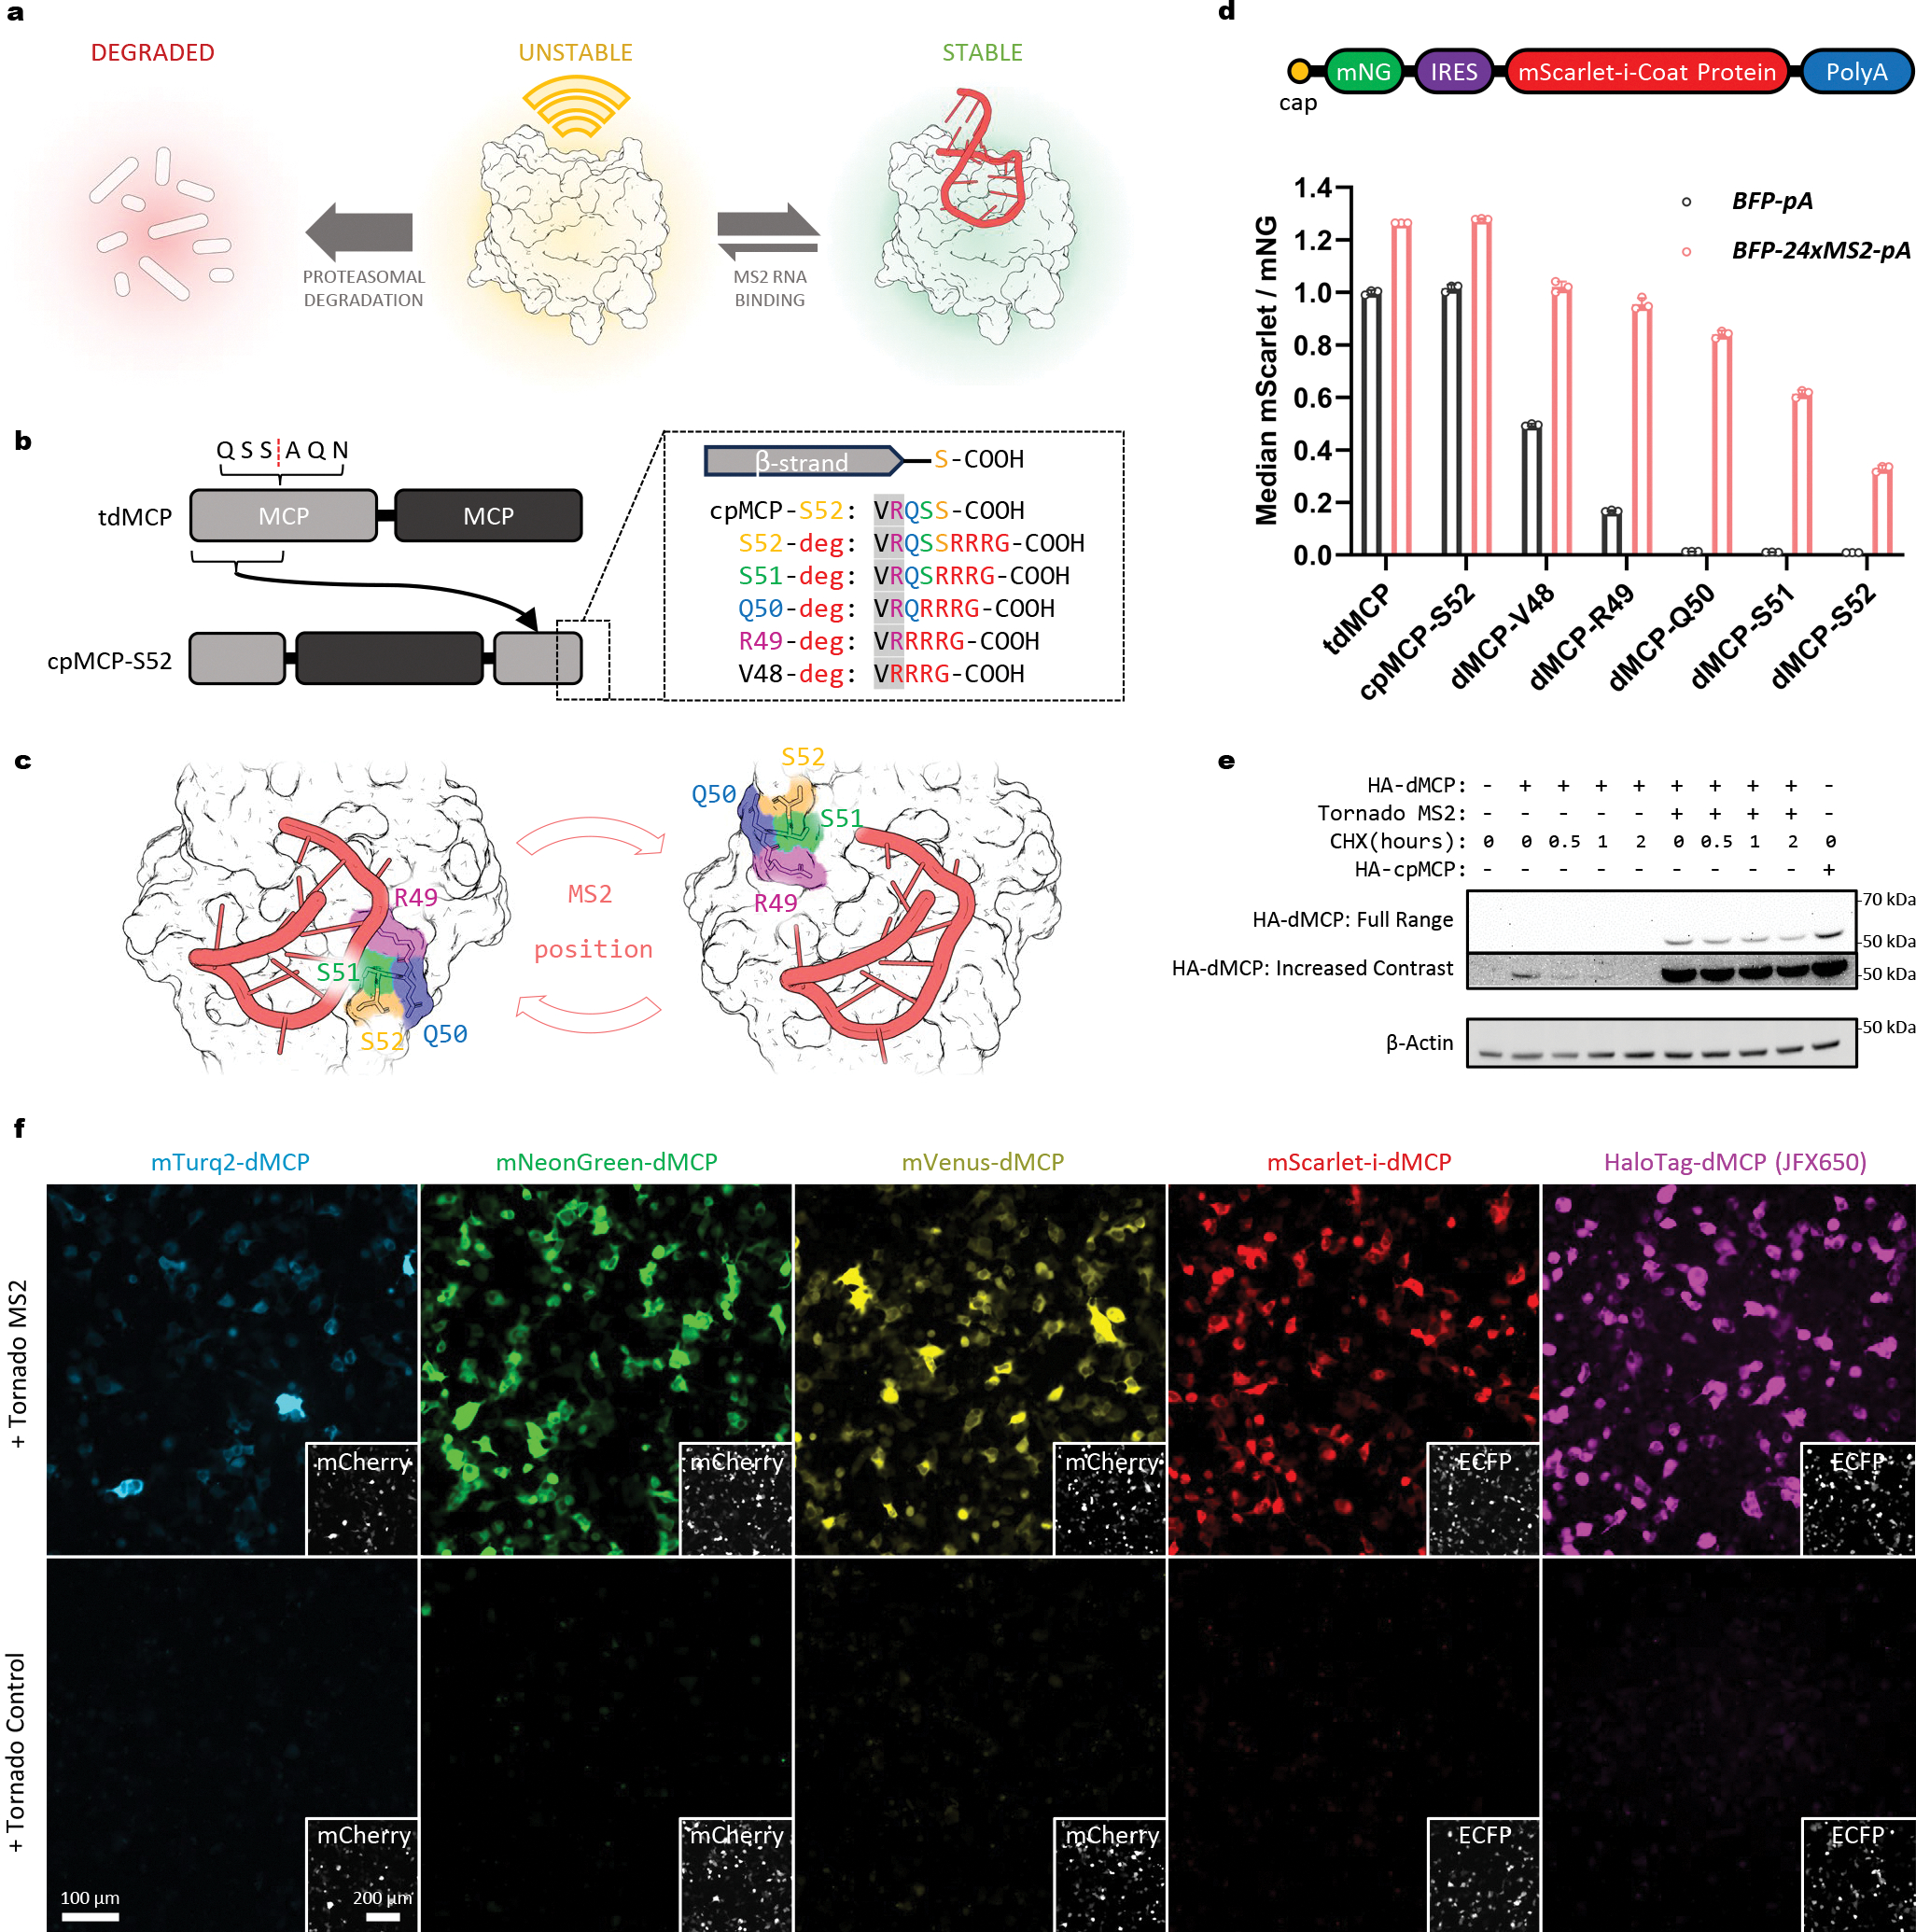
(a) Schematic depicting the RNA-dependent stability of an engineered MS2 coat protein. Unbound coat protein units are degraded within cells unless bound by MS2 hairpins. (b) Diagram showing the circular permutation strategy used on tdMCP. Attachment sites used to append the -RRRG C-degron to candidate sequences are also shown. (c) Structure of MCP showing the degron attachment sites indicated in (b) with juxtaposition to a bound MS2 hairpin RNA, as rendered using coordinates of a MS2-bound dimeric MCP complex (PDB: 1ZDH). Renders generated with PyMol (http://pymol.org). (d) Design of the bicistronic gene construct used to quantify relative coat protein stabilities. Emissions from a mNG (mNG) reporter were used to normalize levels of IRES-driven mScarlet-coat proteins across cells and conditions. Below, mNG-normalized mScarlet levels are shown for the indicated tagged coat protein sequences, as measured via flow cytometry of transfected HEK-293FT cells co-expressing a BFP-24xMS2 mRNA (red bars) or a BFP control mRNA (black bars). Individual points, bars, and error bars represent the individual median intensities per sample, the mean, and the S.D. of three independent transfections (n=3). (e) Cycloheximide chase of an mNG-fused HA-dMCP, as co-expressed in HEK293FT with either tornado-MS2 or MS2-lacking tornado-control. dMCP concentration and half-life under CHX treatment are visibly increased by the presence of MS2 RNA. (f) Widefield fluorescence images of HEK293FT cells expressing the indicated dMCP fusions and RNAs. Insets depict the expression of a co-transfection marker. Emissions from fluorescent dMCP fusions were visible only in tornado-MS2 expressing cells.
Finally, using a similar approach, we also generated a conditionally stable PCP. Equipped with two orthogonal and destabilized coat proteins, we exploited our new tools to simultaneously visualize distinct RNAs under low-background settings together in live cells. Overall, our approach combines the advantages of RNA-dependent signal generation, the versatility of genetic fusion, and the well-characterized properties of RNA-binding coat proteins to enable sensitive and multicolor imaging of multiple distinct RNA species.
RESULTS
Design of a circularly permuted and destabilized MS2 coat protein (dMCP).
We first sought to create an MCP variant with a C-terminus that would become inaccessible upon MS2 binding. To do so, we used a tandem dimeric MCP (tdMCP)21 to create a circular permutant containing new termini within the RNA-adjacent EF loop (Fig. 1b,c). Since the resulting permutant terminated at the Ser52 position, we designated the construct “cpMCP-S52.” We confirmed that cpMCP-S52 retained its ability to bind MS2 RNA in mammalian cells by imaging the RNA-dependent relocalization of NLS-tagged cpMCP-S52 into the cytoplasm (Extended Data Fig. 1a,b).
Having verified its MS2-binding, we next appended a C-degron tetrapeptide (-RRRG)20 to cpMCP-S52, producing “destabilized MCP-S52,” or “dMCP-S52,” which we expected to degrade rapidly in cells without MS2 hairpins. Consistent with this expectation, dMCP-S52 levels were depleted compared to that of cpMCP-S52 when expressed in HEK293FT cells without tagged mRNAs (Extended Data Fig. 1c). In contrast, in cells containing MS2-tagged transcripts, dMCP-S52 levels were elevated. Together, these results indicate that the degron-mediated elimination of dMCP-S52 is curtailed in response to its specific binding to MS2-based ligands.
Optimization of degron positioning.
Minor adjustments in degron positions, or changes in their flexibilities and sequence contexts, can substantially affect their recognition by E3-ligases and, as a result, the degradability of their fused proteins.22 Thus, we asked whether the coat protein’s MS2-induced preservation could be optimized by adjusting the C-degron’s position on dMCP-S52. To evaluate this possibility, we varied the degron’s attachment position by deleting amino acids between the C-degron and the β-strand preceding it. These manipulations produced dMCP-S51, dMCP-Q50, dMCP-R49, and dMCP-V48, named based on the penultimate residues preceding their fused C-degrons and in which the degron tetrapeptide was positioned increasingly closer to the coat protein core (Fig. 1b,c).
To quantify the performance of these variants, we used bicistronic constructs to co-express a mNeonGreen (mNG) marker in combination with mScarlet-fused coat protein variants via an internal ribosome entry site (IRES). With this system, it is possible to normalize mScarlet-dMCP fluorescence across constructs and samples by comparing emissions from mNG. Flow cytometry was used to measure the relative expression of mScarlet-coat proteins in co-transfected HEK293FT cells, with comparisons between cells co-expressing an MS2-tagged transcript (BFP-24xMS2) or an untagged control (BFP).
Quantitative analyses of the variants revealed improved sequences, with the 1- and 2-amino acid deletion mutants exhibiting enhanced MS2-induced stability in BFP-24xMS2 cells (Fig. 1d). Specifically, levels of MS2-preserved dMCP-Q50 were increased by 2.5-fold compared to that of the original dMCP-S52 design, with the deletion mutant maintaining minimal background levels in control cells. In BFP-24xMS2-containing cells, normalized dMCP-Q50 levels were elevated by an average of 63-fold compared to cells with the BFP-pA control. Further analysis of our flow cytometry data indicated a positive correlation between preserved coat protein levels and emissions from BFP, in which high BFP-expressing cells (>70th percentile) exhibited a 100-fold enhancement in dMCP-Q50 levels in cells with BFP-24xMS2 (Supplementary Fig. 1b–d). These results provide evidence for the MS2-specific preservation of dMCP-Q50, further suggesting proportionality between stabilized dMCP-Q50 levels and the amounts of MS2-tagged mRNAs.
Mutants with 3 and 4 deleted residues (dMCP-R49 and dMCP-V48, respectively) were also stabilized by MS2, but with elevated background stabilities in BFP cells (Fig. 1d). As a result, these sequences had reduced ability to report selectively on MS2-tagged transcripts. Together, these results indicate that degron positioning is a critical and tunable parameter for producing conditionally stable RNA-binding coat proteins. Overall, we identified dMCP-Q50 as an optimal sequence, exhibiting marginal stability under basal conditions while being stabilized by up to two orders of magnitude in cells with MS2-containing RNA. Given these results, we thus proceeded with dMCP-Q50, hereafter designating it simply as ‘dMCP’ for ‘destabilized MCP’.
MS2-binding extends dMCP’s half-life within cells.
With our design finalized, we next aimed to characterize the mechanism and dynamics of dMCP stabilization and degradation. First, we confirmed that dMCP’s low basal levels arise due to its active degradation by proteasomes. Indeed, fluorescence levels in cells expressing an mNG-fused dMCP were substantially elevated following proteasome inhibition with lactacystin and MG-132 (Supplementary Fig. 2).
Next, we evaluated dMCP’s half-life in cells with and without MS2. Here, we co-expressed an HA-tagged dMCP (HA-dMCP) with long-lived circular RNAs,23 comparing a sequence containing a single inserted MS2 loop (tornado-MS2) against an MS2-lacking control (tornado-control). We used co-transfected HEK293FT cells to conduct cycloheximide (CHX)-based chase analyses and western blotting was performed to assess dMCP’s stability in the presence and absence of MS2 (Fig. 1e). What little HA-dMCP background could be detected in control cells was rapidly depleted upon CHX exposure (Supplementary Fig. 3a). By contrast, HA-dMCP was abundant in tornado-MS2 cells, with levels that persisted during CHX treatment, suggesting an extended half-life for the coat protein in its MS2-bound form. We also conducted pulse-chase measurements to approximate dMCP’s stability without subjecting cells to global translation inhibition. Here, pulse-chase dye labeling was used to label temporally-defined copies of a HaloTag24-fused dMCP (2xHalo-dMCP), with subsequent fluorescent detection suggesting a multi-hour (>24 h) persistence for the coat protein in U2OS cells containing tornado-MS2 (Supplementary Fig. 3b). Together, these results show that dMCP is rapidly eliminated by proteasomes and that its lifetime is extended upon binding MS2 hairpins within cells.
Diverse dMCP-reporter fusions enable robust and selective RNA detection.
To evaluate dMCP’s versatility as an RNA imaging probe, we tested dMCP constructs fused with different FPs and reporter domains. FPs from distinct lineages and of diverse colors were fused to dMCP’s N-terminus and co-expressed in cells with and without tornado-MS2. Imaging of co-transfected cells confirmed the conditional stability of the generated constructs, verifying dMCP’s compatibility with diverse FPs while also providing a multicolor toolset for imaging MS2-containing RNAs (Fig. 1f, Extended Data Fig. 2a).
We further tested dMCP using HaloTag and NanoLuciferase (NLuc) fusions. For cells expressing a 1xHaloTag-dMCP, bright emissions from a JaneliaFluorX-65025 (JFX650)-based ligand were observed only upon staining cells co-expressing tornado-MS2 (Fig. 1f, Extended Data Fig. 2a). The bioluminescent activity of NLuc-dMCP was also similarly MS2-responsive (Extended Data Fig. 2b). These results highlight dMCP’s versatility, confirming its compatibility with diverse reporters of distinct colors and modalities.
dMCP enables high-contrast imaging of single mRNAs.
Next, we evaluated the efficiency and accuracy of dMCP as a single mRNA probe. To ensure tagged transcripts could be sensitively detected, we generated a 4xmNG-dMCP and co-expressed the protein alongside an H2B-mCherry-24xMS2 transcript in U2OS cells. Imaging of fixed cells by spinning disc confocal microscopy revealed distinct 4xmNG-dMCP intensities, which were visible in H2B-mCherry-positive cells with a signal-to-noise ratio (SNR) of 25 against cytoplasmic backgrounds (Fig. 2a,b, Extended Data Fig. 3a–d). To confirm that the visualized puncta accurately represented the locations of MS2-tagged transcripts, we used fluorescence in situ hybridization (FISH) to label fixed cells with antisense probes against mCherry. Following signal amplification by hybridization chain reaction (HCR)26, two color imaging revealed consistent co-registration between 4xmNG-dMCP puncta and emissions from AlexaFluor647 (AF647)-conjugated HCR probes. Quantification of these intensities showed that 92 ± 5% of the AF647 puncta also exhibited emissions from 4xmNG-dMCP (Extended Data Fig. 3f), with 4xmNG-dMCP labeling producing signals of relatively uniform dimensions and intensities, suggesting its consistent binding stoichiometry with MS2 arrays (Fig. 2b,c Extended Data Fig. 3d,e). We also used a 1xHaloTag-dMCP stained with a JFX650-based ligand in photobleaching spot analysis, calculating a ~50% binding occupancy for the protein against a 16xMS2 array (Supplementary Fig. 4), consistent with values previously reported for tdMCP.21
Figure 2. Single mRNA detection of MS2-tagged transcripts in cells co-expressing 4xmNG-dMCP.
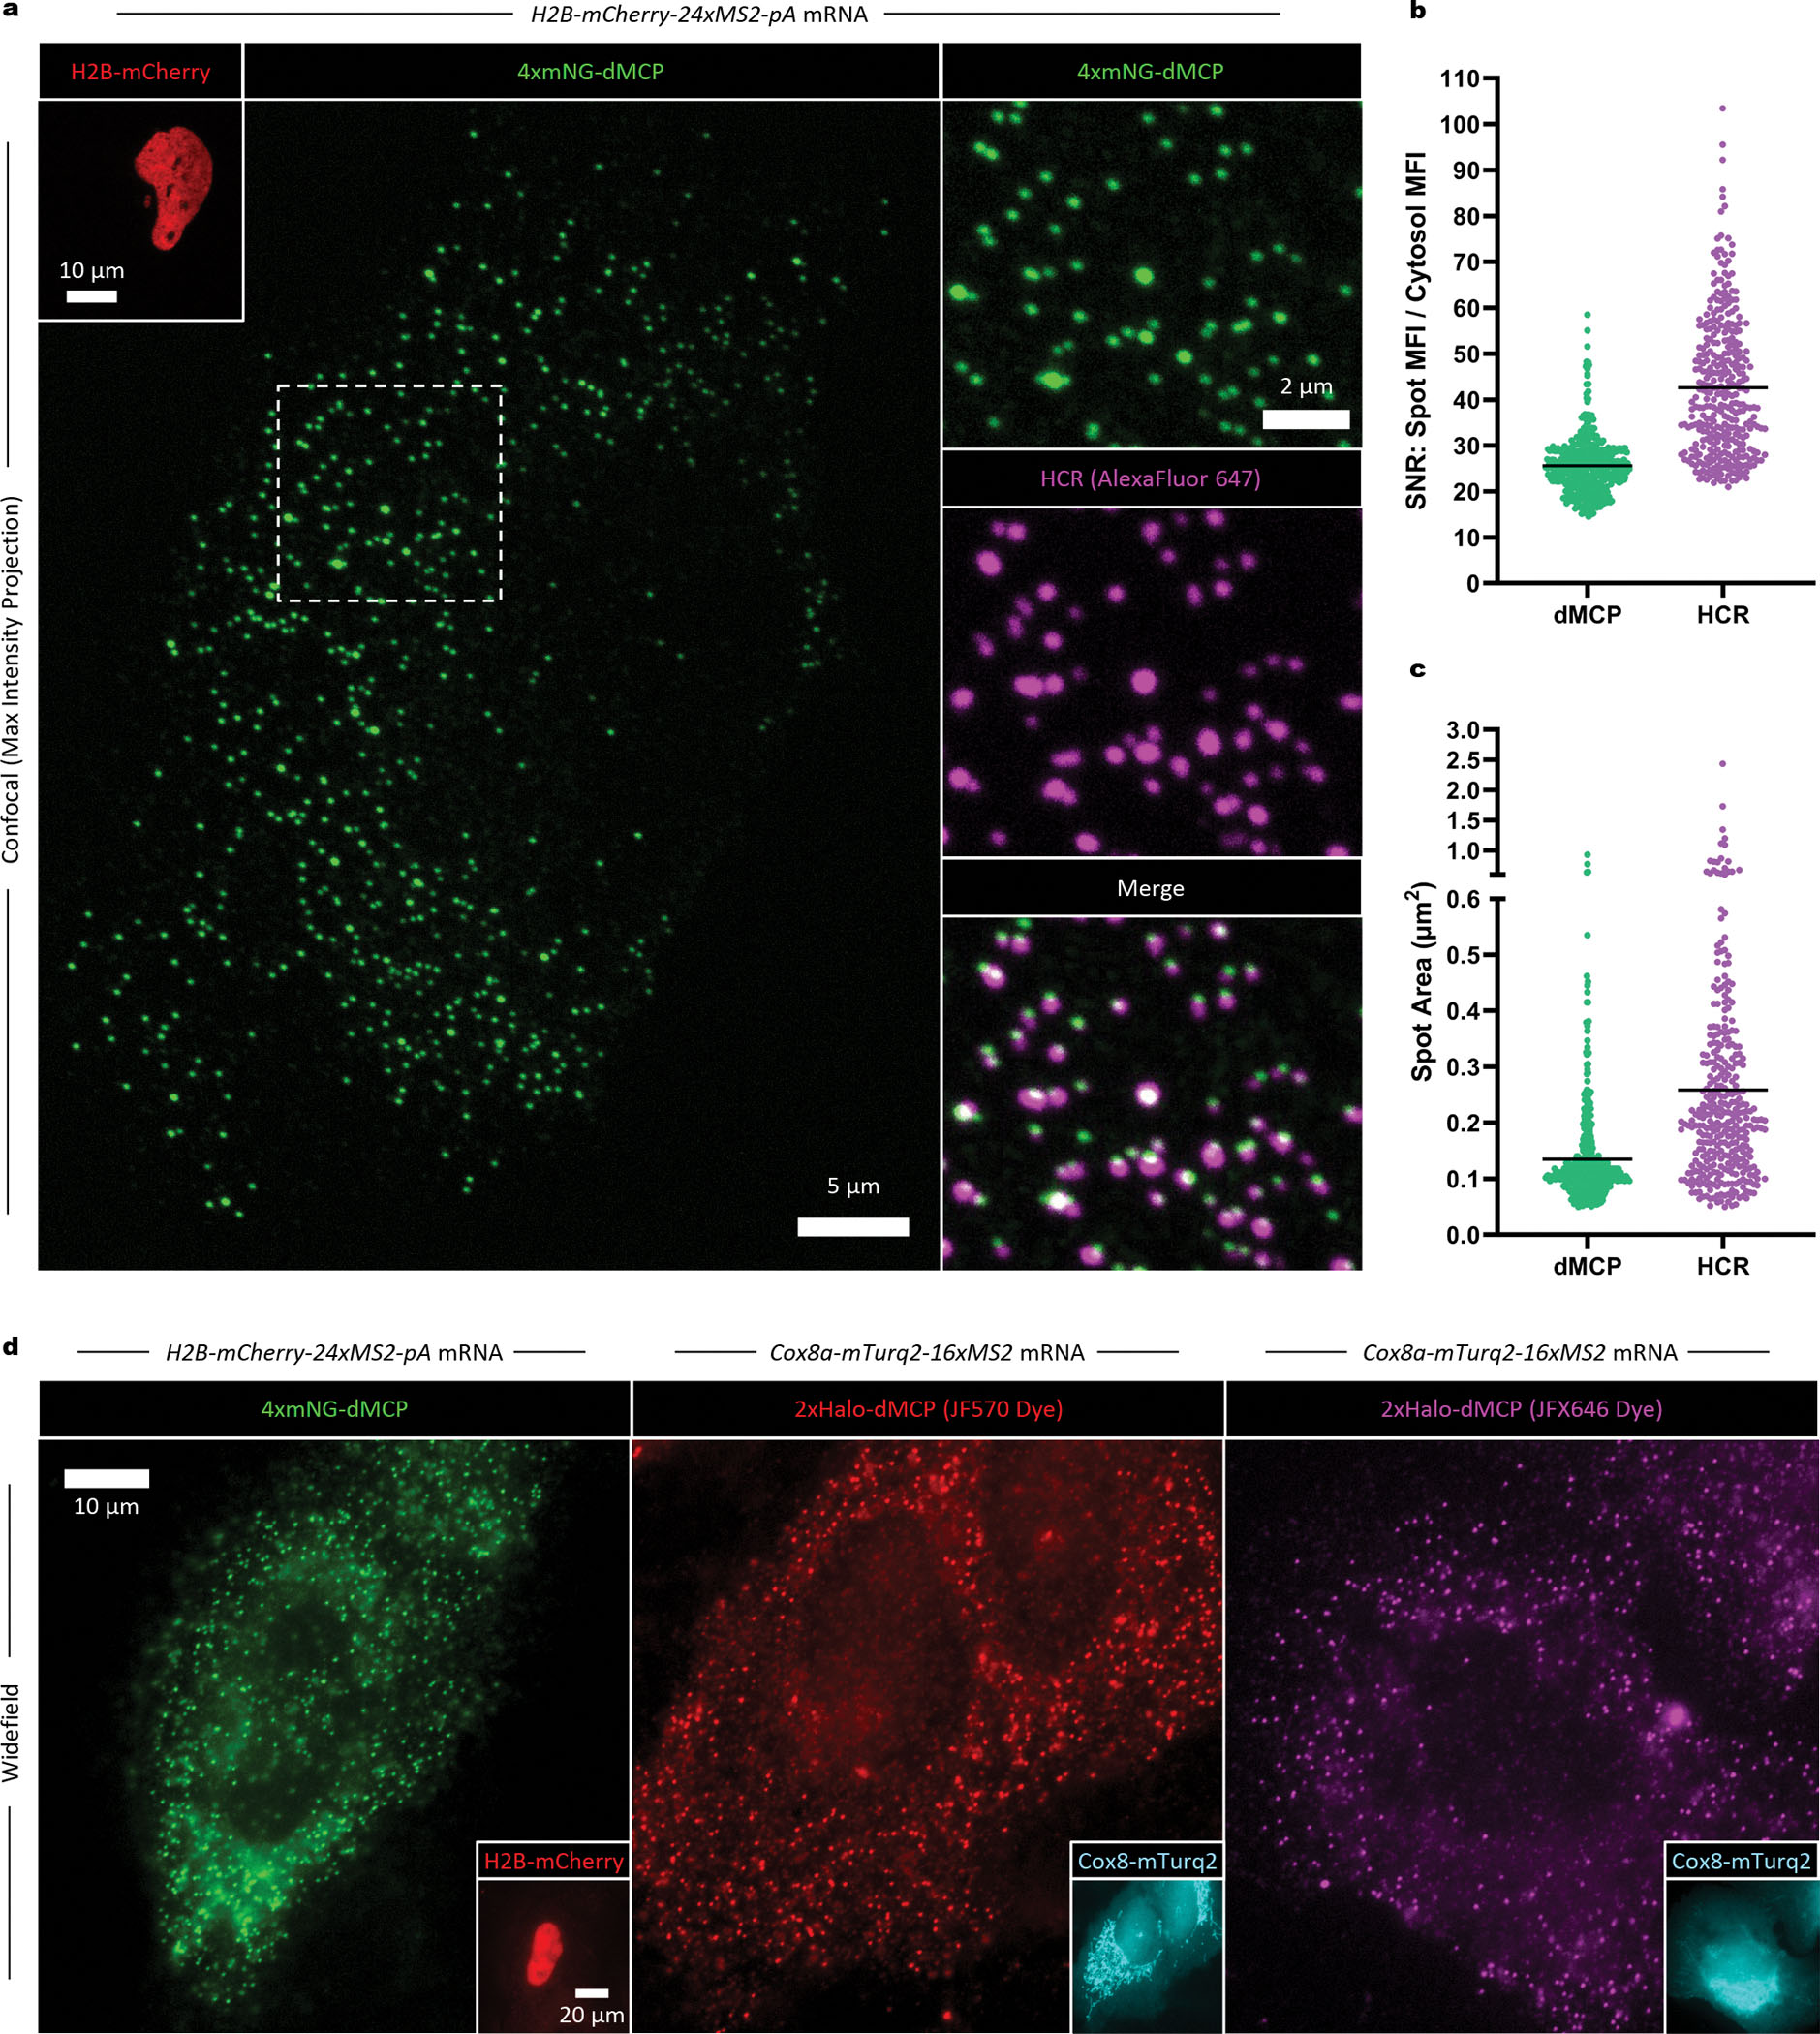
(a) Images of a fixed U2OS cell expressing 4xmNG-dMCP and H2B-mCherry-24xMS2-pA transcripts. Co-localization of 4xmNG emissions with mCherry transcripts was confirmed via HCR-FISH using AF647-conjugated DNA probes. Maximum intensity projections from confocal microscopy are shown. (b) Signal-to-noise ratio (SNR), and (c) average size of individual 4xmNG-dMCP and HCR puncta within the imaged cell. SNR values in (b) are shown as mean intensities of individually measured punctae divided by the mean cytosolic intensity (excluding puncta). Black bars represent the mean for each population, with n=447 puncta for 4xmNG-dMCP and n=345 puncta for AF647. Larger HCR spot sizes resulted in reduced spot counts, such that certain individual AF647 puncta correspond to multiple 4xmNG-dMCP punctae. Images and data depict a single cell representative of tens of cells from three independent experiments, with additional images depicted in Extended Data Fig. 3. (d) Widefield images of fixed U2OS cells co-expressing the indicated dMCP fusions and MS2-tagged mRNAs. Insets represent detection of the protein fusions encoded by the corresponding MS2-tagged mRNAs.
To evaluate dMCP under more challenging imaging conditions, we imaged cells using widefield microscopy, where minimized background fluorescence is essential for accurately detecting single molecules, given the expanded illumination depth across thicker z-planes. Under widefield imaging, 4xmNG-dMCP labeled transcripts yielded distinct single-mRNA intensities within co-transfected cells (Fig. 2d, left). Single transcripts labeled with 2xHaloTag-dMCP were also distinctly visible upon staining with various fluorescent ligands, including one based on the photosensitizing JF570 chromophore,27 used previously in visualizing HaloTag fusions by correlative light and electron microscopy (Fig. 2d, center). Furthermore, staining 2xHaloTag-dMCP with the fluorogenic JFX646 enabled clear imaging of single transcripts via far-red emissions (Fig. 2d, right)25.
To better image nuclear RNA, use of lower mass fusion proteins, such as HaloTag-dMCP (‘1xHalo-dMCP’), can be advantageous due to increased nuclear accessibility via passive translocation across nuclear pores. Accordingly, imaging of JFX650-stained HaloTag-dMCP in HEK293FT cells revealed bright cytoplasmic and nuclear intensities, the latter of which likely represent nascent RNAs at sites of bursting transcription (Supplementary Fig. 5). Furthermore, co-expression of 1xmNG-dMCP was sufficient to render single H2B-mCherry-24xMS2 transcripts visible in U2OS cells, with dMCP-labeled puncta exhibiting improved contrast compared to those of the same mRNA in cells containing 1xmNG-NLS-tdMCP (SNRs of 23.7 for 1xmNG-dMCP versus 11.1 for 1xmNG-NLS-tdMCP, Extended Data Fig. 4). Together, these results validate dMCP as an accurate and sensitive probe for localizing MS2-tagged single mRNAs within cells.
dMCP facilitates accurate detection of subnuclearly localized transcripts.
Many RNAs are retained in the nucleus, where they can participate in processes such as splicing regulation, ribosome production, and transcriptional control.28,29 Additionally, mRNAs with ‘detained’ introns can be blocked from nuclear export, with such blockage serving as a quality control mechanism to prevent translation of incompletely spliced transcripts.30 Detained introns can also serve as regulatory elements, with specific detained sequences becoming spliced from pre-existing transcripts to facilitate their maturation and export in response to external stimuli.31
Given the diverse roles of nuclear RNAs, we asked whether dMCP could be used to selectively image such transcripts, the visualization of which is challenging to do using conventional NLS-fused coat proteins. For these analyses, we exploited the lncRNA-derived nuclear retention element (NRE) from Maternally Expressed Gene 3 (MEG3, shown previously to facilitate the nuclear confinement of chimeric transcripts).32,33 We inserted the MEG3NRE sequence into the 5’ region of BFP-24xMS2 and β-Globin-24xMS2 to produce MEG3NRE-BFP-24xMS2 and MEG3NRE-β-Globin-24xMS2, respectively. We then used a 1xmNG-dMCP to visualize these transcripts, comparing the subcellular distributions of the NRE-containing and NRE-lacking mRNAs. Upon imaging of co-transfected HEK293FT cells, we observed strong nuclear retention of MEG3NRE-β-Globin-24xMS2, whereas the NRE-lacking BFP-24xMS2 and β-Globin-24xMS2 transcripts were predominantly cytoplasmic, both as expected (Fig. 3a, Extended Data Fig. 5). Surprisingly, the MEG3NRE-BFP-24xMS2 transcript exhibited a predominantly cytoplasmic localization, despite containing the MEG3NRE within its 5’ region (Fig. 3a, Extended Data Fig. 5, Supplementary Fig. 6). Such localization suggests that the nuclear retention of mRNAs may depend on specific sequence contexts, as suggested by previous work where spliceosome-based components were identified as required factors in NRE-mediated nuclear sequestration.32 Thus, these data suggest that MEG3NRE-BFP-24xMS2 is exported from the nucleus in a manner that involves the bypassing of spliceosomes, potentially facilitated by its intronless nature.
Figure 3. dMCP-based imaging nuclear retention element (NRE)-containing mRNA transcripts.
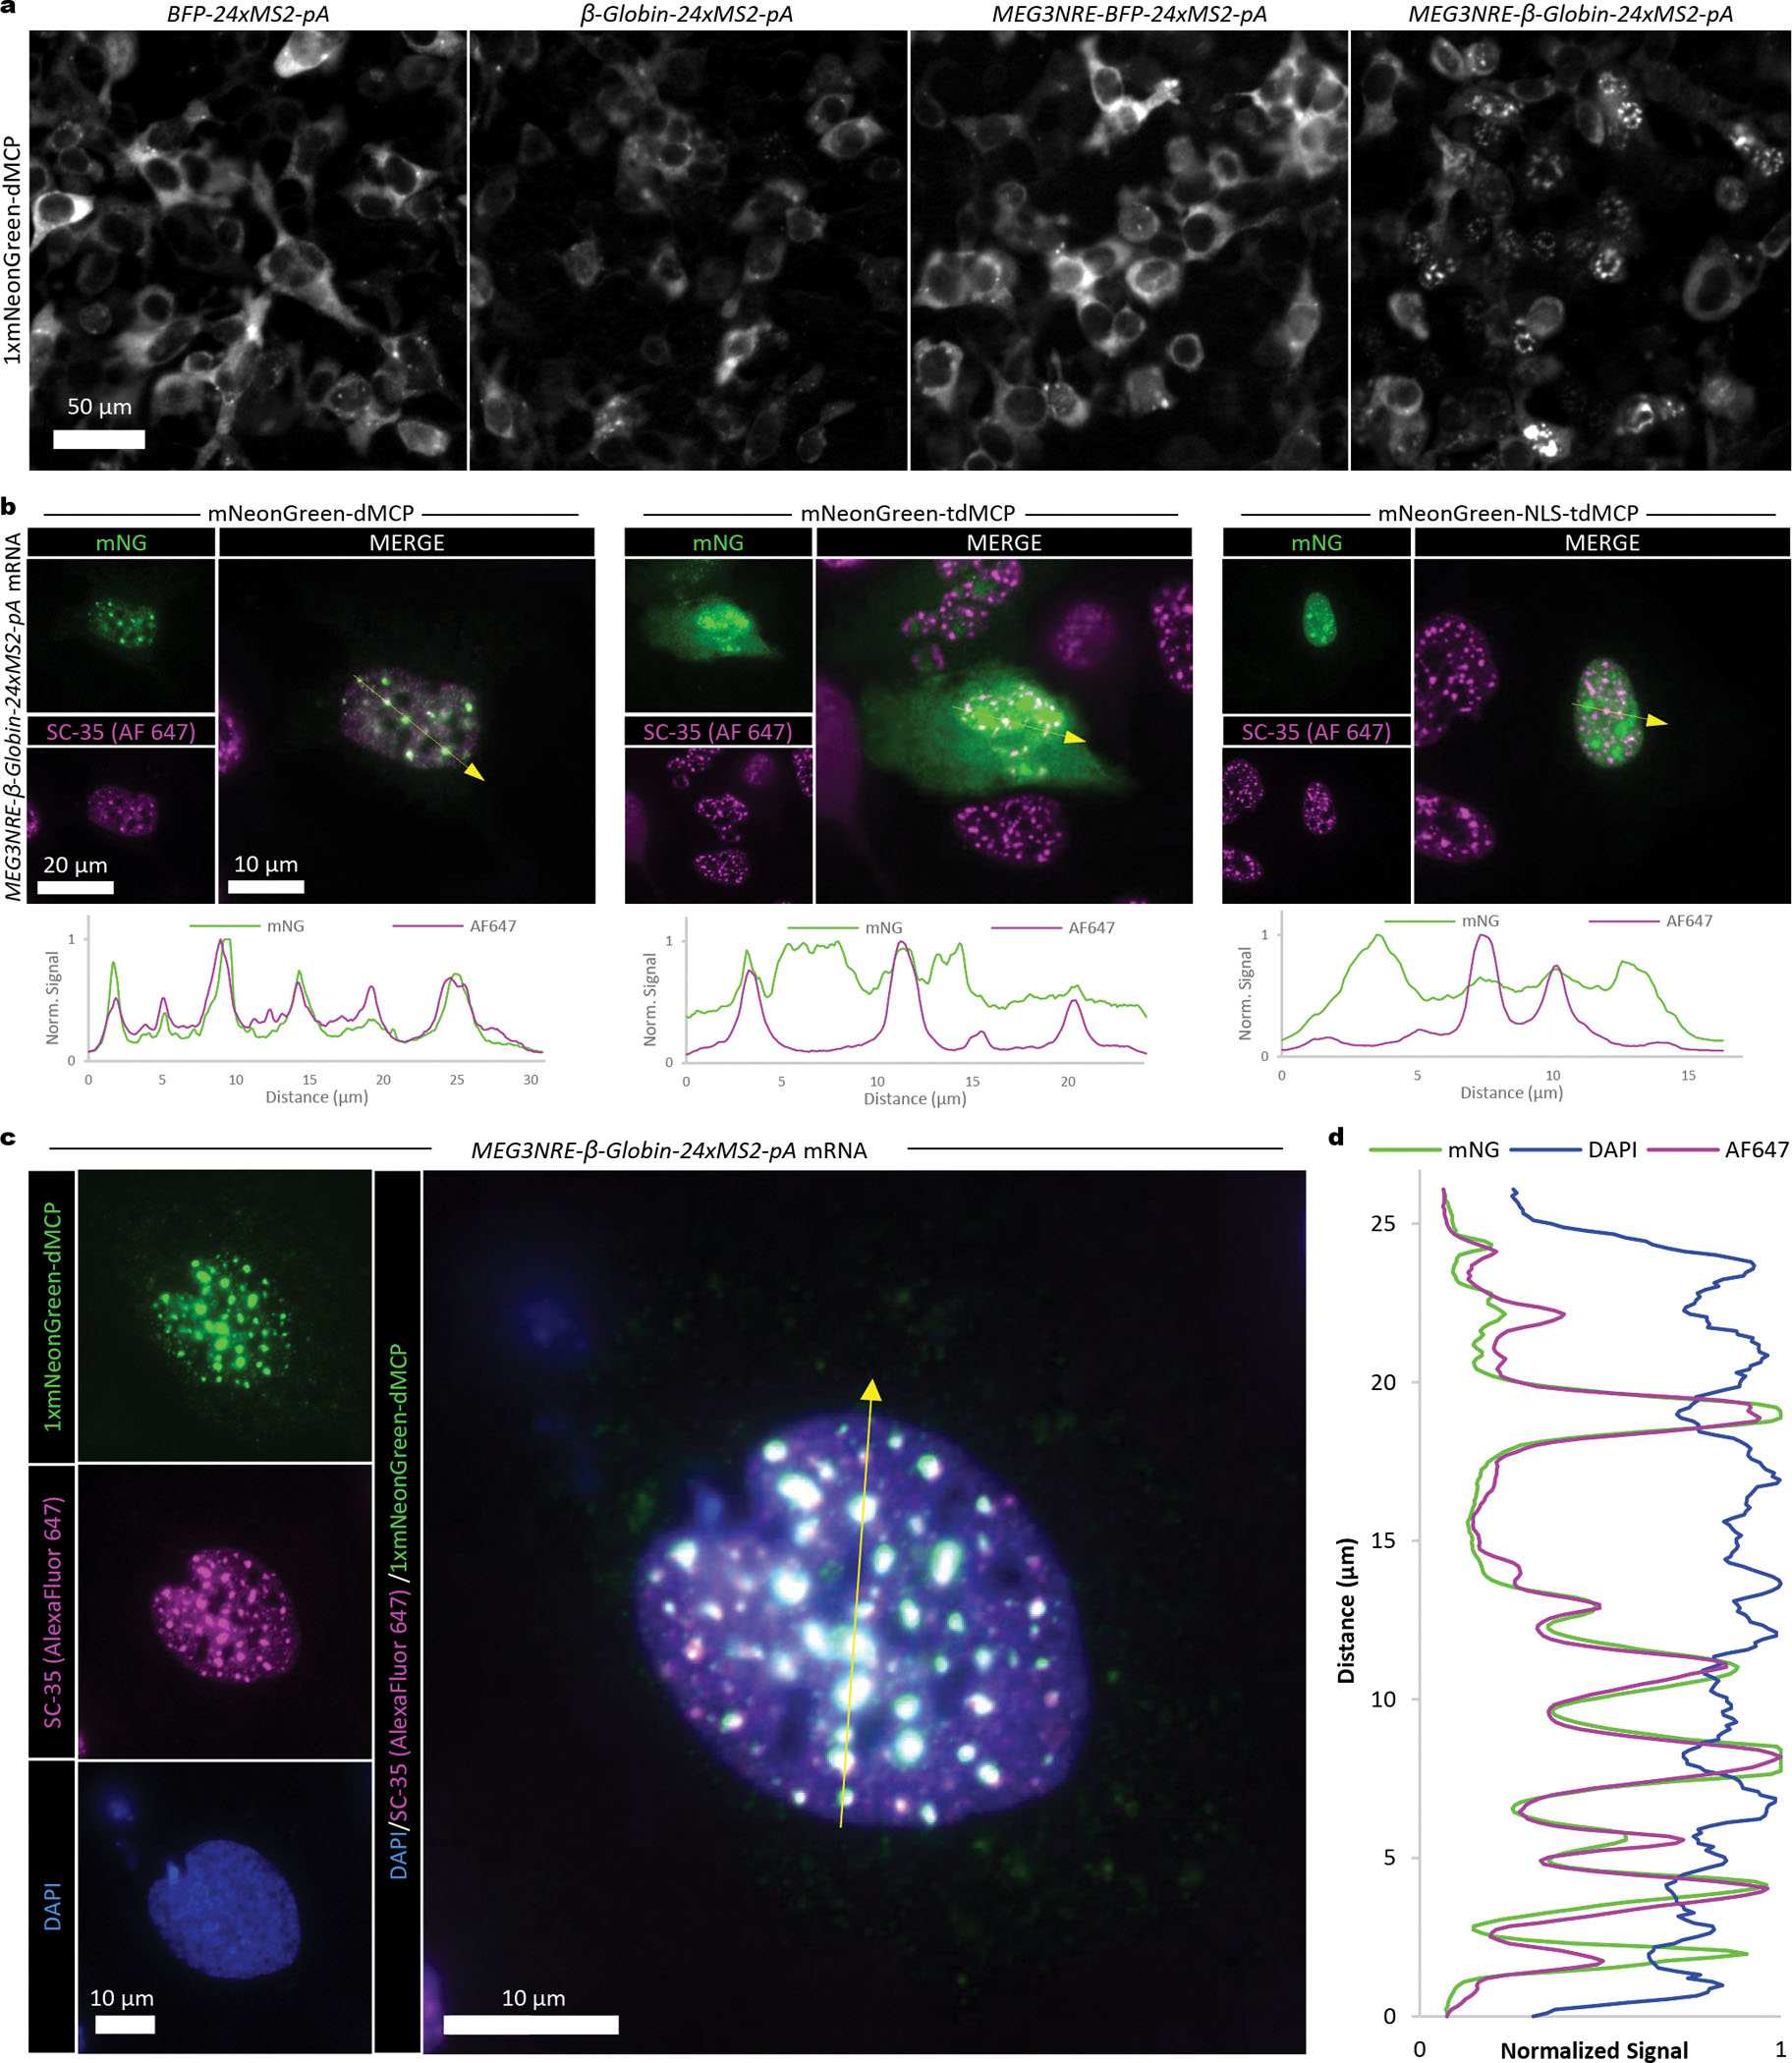
(a) Widefield images of transfected HEK293FT cells co-expressing 1xmNG-dMCP in combination with the indicated MS2-tagged mRNAs. NRE-containing and NRE-lacking transcripts encoding BFP or β-Globin are compared. (b) Widefield fluorescence images of U2OS cells co-expressing MEG3NRE-β-Globin-24xMS2-pA mRNA with 1xmNG fused versions of dMCP, tdMCP, or NLS-tdMCP (displayed in green). Nuclear speckles are visualized with an SC-35 immunostain (magenta), and fluorescence intensity traces along the indicated yellow lines are displayed below. Signal values are normalized to the maximum value for each individual trace. (c) Widefield fluorescence image of a U2OS cell co-expressing 1xmNG-HA-dMCP (displayed in green) and MEG3NRE-β-Globin-24xMS2-pA. Nuclear speckles are visualized with an SC-35 immunostain (magenta), and nuclear boundaries are visualized with DAPI DNA staining (blue). (d) Signal trace over the region indicated by the yellow arrow in (c). Signal values are normalized to the maximum value for each individual trace. Regions enriched for dMCP and SC-35 are also depleted for DAPI.
In addition to visualizing retained transcripts, we also examined whether dMCP is advantageous in imaging nuclear RNAs compared to its tdMCP and NLS-tdMCP predecessors. To do so, we co-expressed MEG3NRE-β-Globin-24xMS2 in U2OS cells alongside 1xmNG-tagged dMCP, tdMCP and NLS-tdMCP. Since nuclearly-retained MEG3NRE-containing mRNAs reside within nuclear speckles in U2OS cells,33 we examined the locations of the tagged coat proteins with respect to the nuclear speckle marker SC35.34 In immuno- and DAPI-labeled cells, 1xmNG-dMCP emissions matched closely with intensities from anti-SC35 staining, confirming dMCP’s ability to accurately highlight the mRNA within its associated subnuclear domain (Fig. 3b–d, Extended Data Fig. 6). In contrast, 1xmNG-tdMCP and 1xmNG-NLS-tdMCP exhibited diffuse nucleoplasmic and strong nucleolar backgrounds, consistent with previously reported results35, and together obscuring the identification of nuclear speckle-associated mRNA copies.
1xmNG-dMCP is a sensitive and versatile single mRNA label.
Having validated dMCP in fixed cells, we next investigated its ability to track live single mRNA movements in real-time. As a first analysis, we conducted side-by-side comparisons of dMCP, tdMCP, and NLS-tdMCP, using them to visualize H2B-mCherry-24xMS2 transcripts in live U2OS cells via widefield microscopy. dMCP facilitated the clearest puncta visibility among the evaluated probes (Extended Data Fig. 7, Supplementary Movie 1), agreeing with our fixed cell analyses, where 4xmNG-dMCP and 2xHaloTag-dMCP intensities remained sharply defined, despite the expanded illumination depths across widefield z-sections.
In addition to distinct coat protein configurations, we also compared the sensitivity of dMCP constructs fused with differing numbers of mNG domains, anticipating that dMCP’s reduced background could render single mRNAs visible in live cells via a 1xmNG-dMCP fusion. Indeed, single H2B-mCherry-24xMS2 transcripts were readily detected in live cells containing 1xmNG-dMCP (Extended Data Fig. 7, Supplementary Movie 1). As expected, side-by-side comparisons of 1xmNG-dMCP against 2xmNG-dMCP and 4xmNG-dMCPshowed that tandem mNG units augmented mRNA detection sensitivities (Supplementary Movie 2).
In addition to transfected cell lines, single mRNAs were also visible in primary neonatal human dermal fibroblasts (HDF-Neo) upon transduction with lentiviral constructs encoding 2xmNG-dMCP and an ECFP-24xMS2-pA mRNA (Supplementary Movie 3).
While most of our analyses involve hairpins based on high-affinity (‘C-variant’) MS2 sequences, dMCP was also useful in detecting mRNAs tagged with reduced-affinity ‘U-variant’ hairpin repeats,36 including in live imaging recordings at the single molecule level (Extended Data Fig. 8, Supplementary Movie 4). Together with those above, these results highlight dMCP as a sensitive and versatile RNA imaging probe, capable of revealing single mRNAs across whole live cell volumes, including in primary cells.
Bipartite complexes can direct coat protein-bound mRNAs to specific subcellular sites.
Coat proteins fused with targeting motifs can be used to direct hairpin-tagged mRNAs to specific subcellular locations. In one such example, MCP units tagged with C-terminal ‘CAAX’ prenylation motifs are used to direct mRNAs to the plasma membrane, where their translation dynamics can be monitored via total internal reflection fluorescence (TIRF) imaging.37 However, signals requiring C-terminal positioning are likely incompatible with dMCP, as the RRRG degron is recognized by fewer E3 ligases when located internally38. Predicting that this could be overcome via ‘bipartite’ targeting, we combined mVenus-dMCP with a CAAX-tagged mVenus-binding nanobody39 (VHHGFP4-CAAX), finding that single mRNA trajectories were curtailed in nanobody-expressing cells, likely due to their membrane recruitment (Supplementary Movie 5). This result shows that dMCP can be used to direct MS2-tagged mRNAs to specific subcellular locations, and that bipartite interactions can facilitate such targeting while maintaining low cytosolic background fluorescence.
Single mRNA dynamics can be sensitively tracked via dMCP.
Having confirmed its utility in live imaging, we next exploited dMCP to characterize the dynamics of distinct single mRNAs. Using U2OS cells co-expressing an H2B-mCherry-16xMS2 transcript in combination with 4xmNG-dMCP, we used widefield microscopy to record the trajectories of tagged mRNAs in real time. Recorded movies revealed MCP-labeled transcripts as bright intensities undergoing diffusive Brownian motions within the U2OS cytoplasm (Fig. 4a,b, Supplementary Fig. 7a,b, Supplementary Movie 6). Analysis of these trajectories showed that most transcripts remained visible over the recorded durations.
Figure 4. Live-cell tracking of MS2-tagged single mRNAs in 4xmNG-dMCP-expressing U2OS cells.

(a) Single-frame captures from video recordings of 4xmNG-dMCP emissions in cells expressing the indicated 16xMS2-tagged mRNAs (left). RNA trajectories from recordings are shown as color-graded single mRNA particle traces before (middle) and after (right) harringtonine (HT)-induced translation inhibition. Only traces lasting at least 3 frames (0.26 seconds at 0.085 sec/frame) are displayed and analyzed. Traces are color-graded based on apparent diffusion coefficients, calculated using mean squared displacement (MSD) values with a time delay of 1 frame. (b) Apparent diffusion coefficients for the tracked single RNA before and after HT treatment. Statistical significances were determined via unpaired two-tailed Student’s t-test. From top to bottom, ****P=1.8 × 10−84, ****P=2.0 × 10−54, ****P=6.1 × 10−68. Trace counts: H2B n=899, H2B +HT n=814, LSS n=681, LSS +HT n=605, TOM20 n=519, TOM20 +HT n=829. (c) Images of a U2OS cell containing 4xmNG-dMCP labeled mCherry-encoding transcripts bearing an inserted 3’UTRβ-actin. Outward redistribution of transcripts towards cell edges can be observed following serum stimulation. Insets display mCherry emissions.
To investigate the relationship between the observed diffusive motions and translation activity, we imaged cells before and after treatment with the translation inhibitor harringtonine (HT). Apparent diffusion coefficients (Dapp) of single H2B-mCherry-16xMS2 transcripts were significantly increased upon HT treatment, consistent with their expected mass reductions due to HT-mediated polysome dissociation (Fig. 4a,b, Supplementary Fig. 7a,b, Supplementary Movie 6). This result agrees with previous TIRF imaging studies.40 Mean Squared Displacement (MSD) analysis produced a calculated diffusion coefficient of 0.13 μm2/s for dMCP-tagged H2B-mCherry-16xMS2 mRNA under normal conditions (Supplementary Fig. 7c,d), in line with previously reported values for MS2-tagged mRNAs labeled by conventional MCP.14,41
Next, we used dMCP to investigate differential mRNA dynamics for transcripts that encode organelle-targeted or secreted model proteins. We first evaluated an mRNA encoding a secreted protein containing the lysozyme secretion signal and a KDEL endoplasmic reticulum retention motif (LSS-mCherry-KDEL-16xMS2). In live recordings, labeled mRNAs were visualized as static intensities, consistent with their expected docking on the surface of the rough ER (Extended Data Fig. 9, Supplementary Movie 7). Treatment with HT converted the static puncta into rapidly diffusing intensities (Fig. 4a,b, Supplementary Fig. 8, Supplementary Movie 8), with the transcripts returning to their static states following HT washout (Supplementary Fig. 9). Collectively, these results provide a clear and direct visualization of co-translational protein secretion, during which ribosome-bound mRNAs dock to translocon complexes as they undergo translational elongation.3
We also applied dMCP to visualize mRNAs encoding a protein targeted to mitochondria via the N-terminal mitochondrial targeting sequence (MTS) from the Tom20 subunit of the outer-membrane translocase (TOM) complex (MTSTom20-mCherry-16xMS2). Recording of 4xmNG-dMCP-labeled mRNAs revealed distinct transcript populations, including highly mobile and relatively immobile particle populations (Supplementary Movie 9). Spatial mapping of particle velocities showed distinct subcellular localizations for these populations, with the slow-moving transcripts predominantly distributed perinuclearly and often co-localizing with TOM20-mCherry labeled mitochondria (Extended Data Fig. 10). Treatment with HT resulted in the conversion of MTSTom20-mCherry-16xMS2 transcripts into distributed and freely diffusing intensities, indicating that their prior static states were dependent on active translational elongation (Fig. 4a,b, Supplementary Fig. 10, Supplementary Movie 10). These results suggest that a subset of mRNAs encoding proteins with TOM20’s 33-amino acid MTS may transiently associate with mitochondria via a translation-dependent mechanism, possibly through interactions between nascent targeting peptides and MIM1 complexes on mitochondrial outer surfaces.42
To test whether dMCP could visualize transcripts expressed at near-native levels, we used 4xmNG-dMCP to visualize CRISPR-tagged TOMM20 mRNAs using knock-in HEK293FT cells bearing an inserted mCherry-10xMS2 cassette at the endogenous TOM20-encoding locus (Supplementary Fig. 11).43 Tagged transcripts in knock-in cells were clearly visible through transient 4xmNG-dMCP expression, with a fraction of labeled intensities appearing to co-localize with TOM20-mCherry mitochondria, agreeing with our observations using co-transfected U2OS cells (Supplementary Movie 11).
In addition to co-translational regulation, many mRNAs are targeted to subcellular locations through direct transport via RNA-based sorting signals within 3’-UTRs. A well-characterized example of such transport is that of β-actin transcripts, which contain a 3’ element (3’-UTRβ-actin) that is recognized by zipcode binding protein-1 (ZBP-1, also called IGF2BP1)44 to facilitate directed mRNA transport along cytoskeletal filaments.45 To visualize such trafficking, we used dMCP to track a mCherry transcript containing an inserted 3’UTRβ-actin signal upstream of an MS2 array (mCherry-3’UTRβ-actin-16xMS2). In cells co-expressing 4xmNG-dMCP, we observed the previously characterized effect of serum-induced redistribution of the 3’UTRβ-actin-containing transcript to distal cellular regions46 (Fig. 4c, Supplementary Fig. 12). Together, these data highlight the utility of dMCP in studying the dynamics and regulated targeting of mRNAs across subcellular regions, including those that undergo targeting via translation-dependent and -independent processes.
Generation of a destabilized PP7 coat protein (dPCP) for two-color imaging.
Given our success in developing dMCP, we next asked whether we could design a destabilized version of the PP7 coat protein (PCP), which binds orthogonally to a cognate PP7 RNA hairpin.47 Structural analyses have shown that PCP and MCP share similar folds and RNA-binding characteristics despite limited sequence conservation8. Given these orientations, we generated a circularly permuted tdPCP21 with new termini at the RNA-adjacent EF loop (Fig. 5a). Initial tests of the resulting permutant, cpPCP-G48, confirmed its binding and nuclear co-export with a PP7-containing tornado RNA (tornado-PP7). However, imaging of cpPCP-G48 also revealed visible protein aggregates formed in both tornado-PP7 and control cells (Supplementary Fig. 13). Hypothesizing that these aggregates may be due to homomeric oligomerization, we introduced mutations to disrupt cis-interactions between cpPCP-G48 units, producing a ‘solubilized cpPCP-G48,’ or ‘sol-cpPCP-G48,’ which lacked visible aggregation while retaining its PP7-binding activity in transfected HEK293FT cells (Supplementary Fig. 13).
Figure 5. Design of destabilized PP7 coat protein and two-color RNA imaging using dMCP and dPCP.

(a) Schematic showing the circular permutation strategy used to design dPCP; tdPCP permutation sites and degron attachment locations are displayed. A solubilized tdPCP circular permutant (“sol-cpPCP-G48”) was used to generate the candidate degron-tagged proteins. (b) Structures depicting the degron attachment positions as indicated in (a) and rendered using coordinates from native PP7-bound PCP (PDB: 2QUX). Renders generated with PyMol (http://pymol.org). (c) Schematic of the bicistronic gene construct used to quantify relative degron-tagged permutant stabilities (top). Analyses were performed similarly to those for dMCP, with use of mNG emissions to normalize levels of IRES-driven mScarlet-coat proteins fusions (bottom) in cells co-expressing tornado-PP7 (red bars) or tornado-control (black bars). Individual points, bars, and error bars represent the individual median intensities per sample, the mean, and the S.D. of three independent transfections (n=3). (d) Widefield images of HEK293FT cells co-expressing mScarlet-dMCP and mNG-dPCP with the indicated MS2-tagged, PP7-tagged, or untagged circular ‘tornado’ RNAs. (e) Distinct subcellular distributions of MS2- and PP7-tagged RNAs in transfected HEK293FT cells. Nuclearly-retained MS2 mRNA (MEG3NRE-β-Globin-24xMS2-pA) is labeled by mScarlet-dMCP (magenta), in juxtaposition to nuclearly-exported tornado-PP7 RNA labeled by mNG-dPCP (green). (f) Live cell multi-channel tracking of orthogonally tagged single mRNAs in a U2OS cell. Single transcripts corresponding to H2B-mCherry-24xMS2-pA (left) and LSS-mTurq2–18xPP7-pA (right) were detected via 2xHalo-dMCP labeled by JFX650 dye and 4xmNG-dPCP, respectively. Detection of the independently tagged transcripts are shown in grayscale as single-frame captures; insets represent detection of the corresponding transcript-encoded proteins. Bottom panels represent magnified views of the areas within the dashed lines. Top right panels represent single RNA trajectories as color-graded traces. Traces lasting at least 3 frames (0.68 seconds at 0.226 seconds/frame) are shown. Color scales depict the apparent diffusion coefficients, as calculated using mean squared displacement (MSD) with time delays of 1 frame. (g) Calculated apparent diffusion coefficients for the indicated RNA transcripts. Statistical significances were determined by unpaired two-tailed Student’s t-test: ****P=5.4 × 10⁻¹². Trace counts: dMCP/MS2 n=507, dPCP/PP7 n=132.
Next, the -RRRG C-degron was fused to sol-cpPCP-G48, with variation of the precise attachment positioning as before, resulting in dPCP-G48, dPCP-N47, dPCP-Q46, dPCP-R45, and dPCP-L44 (Fig. 5a,b). We then assessed the stability of these sequences in cells with and without tornado-PP7 RNA. These analyses identified dPCP-Q46 (hereafter designated ‘dPCP’) as an optimal variant, exhibiting a 19-fold stability enhancement in cells containing tornado-PP7 RNA (Fig. 5c, Supplementary Fig. 14).
With dMCP and dPCP in hand, we next sought to confirm orthogonality in their hairpin-dependent stabilities. As expected, dMCP and dPCP were selectively stabilized by their cognate RNA ligands in co-transfected HEK293FT cells without observable crosstalk, confirming that their coat protein-hairpin selectivities were maintained (Fig. 5d). To exploit their orthogonality, we then applied the coat proteins to visualize the nuclearly-retained MEG3NRE-β-Globin-24xMS2 transcript alongside the exported tornado-PP7 circular RNA (Fig. 5e). Upon fluorescence imaging by widefield microscopy, the tagged coat proteins exhibited distinct distributions agreeing with the expected subcellular distributions of their targeted RNAs.
To assess its utility in single molecule imaging, we compared dPCP with tdPCP and NLS-tdPCP, evaluating the relative capabilities of each variant in visualization of single H2B-mCherry-18xPP7 transcripts in live U2OS cells. Under widefield imaging, single mRNAs were detectable via each of the tested probes, with 4xmNG-dPCP permitting clear transcript detection without the intense nuclear backgrounds seen when using NLS-tdPCP (Supplementary Fig. 15, Supplementary Movie 12). While cytoplasmic dPCP background emissions remained visible, such emissions were reduced compared to those seen in tdPCP-containing cells. Together, these data confirm the single molecule sensitivity of dPCP, with our comparisons suggesting an advantageous utility of the probe in imaging mRNA around the nucleus, a region that is often obscured by excessive nuclear signal when imaging with NLS-PCP.
Finally, having demonstrated dPCP’s sensitivity, we next combined 2xHaloTag-dMCP and 4xmNG-dPCP to simultaneously visualize H2B-mCherry-24xMS2 and LSS-mTurq2–18xPP7 together via two-color imaging within the same cell. In live cell recordings, dMCP-bound H2B-mCherry-24xMS2 transcripts were observed as mobile cytoplasmic intensities, with dPCP-labeled LSS-mTurq2–18xPP7 intensities exhibiting curtailed mobilities consistent with their association with the ER, both as expected (Fig. 5f,g, Supplementary Movie 13). Overall, our results highlight dMCP and dPCP as sensitive probes for tracking hairpin-tagged mRNAs via multicolor imaging in live cells.
DISCUSSION
In summary, dMCP and dPCP are coat proteins that are stable when bound to their corresponding RNA hairpins but otherwise rapidly degraded within cells. Using these proteins, one can sensitively visualize MS2- and PP7-tagged mRNAs under reduced background due to proteasomal elimination of RNA-unbound coat proteins.
To create dMCP and dPCP, we implemented a C-degron insertion strategy that builds on previously implemented techniques.19 As the native ends of these coat proteins are located at non-maskable positions, we used circular permutation to relocate their C-termini to RNA-adjacent locations. By fusing the -RRRG degron to the permutants and screening positional variants, we created constructs with optimal RNA-dependent stabilities. Characterization of dMCP showed RNA-induced stabilization led to a 63-fold increase in intracellular concentration, with the coat protein becoming stabilized via a mechanism that extends its half-life within cells. We further demonstrated the robustness of this strategy by developing dPCP in an analogous way. However, preliminary protein engineering was required to prevent aggregation of PCP-based constructs. Additionally, dPCP’s performance is more modest compared to that of dMCP (with dPCP exhibiting a ~19-fold signal enhancement in response to PP7 RNA). Nonetheless, dPCP was suitable for visualizing single mRNAs, both independently and in combination with dMCP via two-color imaging.
Using dMCP and dPCP, we tracked the localization and live cell dynamics of diverse RNAs via widefield imaging. Such RNAs included circular RNAs, nuclearly-retained transcripts, and single mRNAs encoding secreted, mitochondrial, or locally translated proteins. Side-by-side comparisons with tdMCP and NLS-tdMCP showed that dMCP was advantageous in single mRNA imaging. Additional tests revealed that dMCP is also stabilized by reduced affinity (‘U-variant’) MS2 loops. Experiments in CRISPR-modified lines and transduced primary cells show that dMCP will be useful in imaging RNA under varying cellular contexts, which we anticipate will facilitate its adoption in future biological studies. By using dMCP and dPCP together, we showed that two differentially regulated transcripts could be simultaneously tracked within the same cells. Overall, we expect dMCP and dPCP to be readily combined with existing systems utilizing MS2 and/or PP7 RNA motifs.
Future users of dMCP and dPCP should be mindful of potential cellular effects arising from expression of these proteins, which may occur due to their competition against endogenous degradation substrates. To minimize such burdens, we recommend expressing dMCP and dPCP fusions at low levels by using weak promoters or IRES-mediated expression. Such efforts may serve to minimize cellular effects while also ensuring maintenance of low background levels. Additionally, since the background-suppressing degradation mechanism is a kinetic process, users should consider the stability of target RNAs when applying these probes, as short-lived RNA transcripts may degrade too quickly for effective target binding, stabilization, and chromophore maturation.
In parallel to this work, additional destabilized coat proteins were described in preprints by others, which also utilize degron sequestration.48,49 Our work, together with these, underscore the importance of -RRRG degron positional optimization in identifying highly degradable and efficiently-preserved RNA binding proteins.
All results presented in this work were obtained in human-derived cell lines or primary cells, but the -RRRG degron has demonstrated effectiveness across a range of animal cell types, including various mammalian cells50 and in vivo within flies,51 zebrafish,52 and mice.53 However, dMCP and dPCP are not predicted to function in prokaryotes or fungi, which lack the specific degradation machinery necessary to recognize the -RRRG degron.38 Given that both termini of the circularly permuted variants are positioned adjacent to their RNA-binding sites, it may be feasible to screen additional C- or N-terminal degrons to develop dMCP and dPCP variants functional in other kingdoms and domains of life. For optimal performance, new degron candidates should be short, maskable motifs that are recognized by constitutively expressed and broadly distributed cellular degradation machinery.
Finally, we anticipate that these conditionally stable proteins could enhance performance for many RNA-based systems. In additional imaging applications, dMCP and dPCP could serve as high-contrast agents for genomic loci imaging using dCas9-sgRNA scaffolds.35,54,55 RNA adaptor systems may also enable the detecti1on of endogenous RNA expression through dMCP and dPCP.56 Additionally, dMCP and dPCP may help reduce off-target background in proximity labeling applications.57,58 Finally, pairing dMCP or dPCP with effector domains, such as RNA59–63 or DNA64,65 modifying enzymes, could improve on-target effector performance while minimizing nonspecific targeting. Often, these applications already use MS2 or PP7 as their RNA handle, and thus dMCP and dPCP are anticipated to be directly adaptable to these systems.
MATERIALS AND METHODS
General cloning
New DNA constructs were generated using standard cloning procedures via either T4 DNA Ligase or Gibson Assembly reactions. Restriction enzymes, ligases, and assembly mixtures were obtained from New England Biolabs (NEB). Plasmids containing repeating DNA sequences (including those with MS2 or PP7 repeat arrays), plasmids encoding the described circular RNAs, and lentiviral transfer vectors were transformed and prepped using a recombination-deficient NEB Stable E. coli strain (NEB) as the transformation host. Transformed NEB Stable cells were grown on agar plates or in liquid cultures at 30 °C. Plasmids were confirmed via Sanger sequencing before use.
Cloning of circular RNA encoding plasmids
Plasmids encoding the circular tornado-MS2, tornado-PP7, and tornado-control RNA sequences were generated by modification of pAV-U6+27-Tornado-F30-TAR Variant-1 (AddGene Plasmid #129406). Briefly, the parent vector was digested at NheI and KpnI sites and dephosphorylated using Quick CIP (NEB) before isolation of the cleaved backbone by DNA gel extraction. Inserts based on annealed oligonucleotide pairs (Integrated DNA Technologies, IDT) were phosphorylated using T4 Polynucleotide Kinase before ligation into the cleaved plasmid backbone using T4 DNA Ligase. The resulting plasmids contain the following indicated DNA sequences inserted between the NheI and KpnI sites of the original tornado-encoding backbone (lowercase letters correspond to the indicated hairpin-forming sequences):
| tornado-MS2: | 5’-AAAgcacgagcatcagccgtgcCGA-3’ |
| tornado-PP7: | 5’-AAAggagcagacgatatggcgtcgctccCGA-3’ |
| tornado-control: | 5’-ATTAGCTCCGAGCCCGA-3’ |
Mammalian cells
Mammalian cells were maintained in a humidified incubator at 37 oC with 5% CO2. HEK293FT (Thermo Fisher, R70007) and U2OS (Sigma-Aldrich, 92022711–1VL) cells were grown in media based on high-glucose (4.5 g/L) Dulbecco’s Modified Eagle Medium (DMEM) containing sodium pyruvate (Cytiva, SH30285.01) supplemented with 10% (v/v) fetal bovine serum (FBS, typically either Cytiva Characterized Fetal Bovine Serum, Canadian Origin (Cytiva, SH30396.03), or Corning Regular Fetal Bovine Serum (Corning, 35010CV)), along with nonessential amino acids (LifeTechnologies), Glutamax (LifeTechnologies), and penicillin-streptomycin (Thermo Fisher).
Primary neonatal human dermal fibroblast cells (HDF-Neo, Lonza CC-2509, Lot# 0000670357) were grown in Fibroblast Growth Medium-2 containing complete supplements associated with the FGM-2 BulletKit (Lonza, CC-3132). Early passage HDF-neo cells used (passage 5 or earlier).
DNA transfections
Transfections were performed using the Lipofectamine 3000 reagent (Thermo Fisher). Transfection complexes were prepared according to the supplier’s protocol. Amounts of DNA and levels of co-transfected plasmids were varied based on individual experimental applications as described in the sections below.
MS2-binding validation using NLS-cpMCP-S52 and initial test of dMCP-S52 degradation
HEK293FT cells were grown on fibronectin (FN)-coated 18-well chambered coverglass slips (Cellvis, C18SB-1.5H). Coating was performed using 10 μg/ml FN in phosphate buffered saline (PBS) for 1 h at room temperature, followed by rinsing three times with PBS before adding cells. HEK293FT cells were seeded into the glass plates at 50,000 cells per well and transfected with 100 ng of vector encoding mVenus-NLS-HA-cpMCP-S52, mVenus-HA-cpMCP-S52, or mVenus-HA-dMCP-S52 driven by a minCMV promoter, along with 100 ng of a vector encoding H2B-mCherry-pA or H2B-mCherry-16xMS2-pA transcripts driven via CMV promoters. Cells were transfected in suspension by combining transfection complexes with cells at the time of cell seeding. Cells were imaged by widefield microscopy at two days post-transfection.
Flow cytometry
Flow cytometry analyses were performed using an Attune-NxT Flow Cytometer (Thermo Fisher). Transfected cells were analyzed at ~48 hours post-transfection. For cells grown in 96 well plates, cell suspensions were prepared by aspiration of the growth medium followed by incubation in 50 μL of EDTA-containing 0.25% Trypsin solution (Thermo Fisher). Trypsinization proceeded at 37 °C for no longer than 5 min, after which the reaction was quenched by the addition of 200 μL of complete growth medium. The resulting cell suspension was used in flow cytometry analyses. Detection voltages were adjusted on an experiment-by-experiment basis. A representative example of the implemented gating procedures is provided in Supplementary Fig. 1. Live cells were identified by FSC-A and SSC-A gating. Singlet cells were identified via gating based on FSC-A versus FSC-H. Transfection-positive cells were defined as those exhibiting mNG and BFP emission at intensities above that of the top 99.9% of non-transfected control cells. FlowJo™ v10 Software was used for all flow cytometry analyses.
Optimization of degron-positionings
Transfected HEK293FT cells were used in the dMCP and dPCP optimization screens. Cells were seeded into tissue culture (TC)-treated 96-well plates at 80,000 cells per well. Levels of mNG, mScarlet-i, and BFP were quantified by flow cytometry at two days post-transfection.
For MCP-based coat proteins, cells were transfected with plasmid mixtures containing pcDNA3-based bicistronic constructs encoding a CMV-driven cap-dependent mNG in combination with encephalomyocarditis virus (EMCV) IRES driven mScarlet-i-fused coat protein sequences. Cells were co-transfected with 10 ng of bicistronic plasmid in combination with 100 ng of plasmid encoding either BFP-24xMS2-pA or BFP-pA, both driven from CMV promoters. Unless otherwise indicated, high-affinity (C-variant) MS2 loop sequences were utilized throughout, except in Extended Data Fig. 8, in which transcripts containing reduced-affinity U-variant MS2 loops were analyzed (derived from AddGene Plasmid #104391).
For PCP-based coat proteins, a CMV promoter-driven mNG was co-expressed in combination with mScarlet-i-fused coat protein sequences, also via an EMCV-IRES and the pcDNA3 backbone. Cells were co-transfected with DNA mixtures containing three plasmids, including: 10 ng of bicistronic plasmid, 100 ng of plasmid encoding either tornado-PP7 or tornado-control driven from U6 promoters, and 100 ng of a BFP-encoding plasmid as a cotransfection marker.
Analysis of fluorescent protein (FP)-dMCP fusions
HEK293FT cells were grown on FN-coated 8-well chambered coverglass slips as described above. Cells were transfected in suspension by combining 200,000 cells per well with Lipofectamine 3000 transfection complexes. For imaging FP-dMCP fusions stabilized by tornado-MS2 (as shown in Fig. 1f and Extended Data Fig. 2a), transfection mixtures were prepared by mixing 200 ng of plasmid encoding a minimal CMV promoter (minCMV)-driven reporter-dMCP fusion, 200 ng of plasmid encoding a U6 promoter-driven tornado construct (tornado-control or tornado-MS2, as indicated in the figures), and 50 ng of plasmid encoding a fluorescent cotransfection marker expressed from a UBC promoter (mCherry or ECFP, selected based on spectral compatibility and as indicated in the figures). Cells were imaged at two days post-transfection under live conditions in FluoroBrite imaging media (Thermo Fisher, A1896702) containing the same supplements as cell growth media.
Proteasome inhibition
HEK293FT cells were transfected with bicistronic constructs encoding mNG in combination with IRES-regulated mScarlet-dMCP. Transfections were performed in 96-well plates using 100,000 cells per well. The day after transfection, cells were treated with MG-132 (Selleck Chemicals) or lactacystin (Santa Cruz Biotechnology), each using 10 μM treatment concentrations. Proteasome inhibition proceeded by incubation with each drug for 6 hours prior to analyzing mNG and mScarlet levels using flow cytometry as described above.
Half-life analyses using cycloheximide
HEK293FT cells were transfected with 30 ng of plasmid encoding a UBC promoter-driven mNG-HA-dMCP in combination with 300 ng of plasmid encoding U6 promoter-driven tornado-MS2 or tornado-control. DNA mixtures were combined with 270 ng of salmon sperm DNA as filler prior to preparing transfection complexes using Lipofectamine 3000. Transfections were performed using cell suspensions, with cells seeded into 48-well TC-treated plates at 250,000 cells per well. Cycloheximide (CHX) pulse treatments were performed at one day post-transfection using CHX at a dose of 15 μM, with treatment durations of 0, 30, 60, and 120 minutes. Cells were lysed using 1X NuPAGE LDS sample buffer (Thermo Fisher) and lysates were stored frozen until analysis by western blotting (see below).
Fluorescent pulse-chase analyses
U2OS cells were seeded into a 48-well plate at 50,000 cells per well and co-transfected with 100 ng plasmid encoding 2xHaloTag-HA-dMCP (driven from UBC promoter) in combination with 100 ng of a plasmid encoding tornado-MS2 or tornado-control (driven from U6 promoters). Pulse-chase labeling was initiated at 2 days post-transfection by exchanging cells into growth media containing 200 nM of either a JF552- or JF669-based HaloTag ligand. Staining with the initial ligand proceeded for 1 h at 37 °C, after which cells were washed 3×5 min with fresh growth media before being subjected to chase labeling with probes distinctly colored from the pulse label. Chase durations proceeded for the times indicated in figures and figure captions. Cells were lysed using 1xLDS sample buffer and proteins were separated via SDS-PAGE as described below. Fluorescence emissions from the covalently stained proteins were recorded via direct in-gel detection using an iBright Imaging System (Thermo Fisher). Note that JF552- and JF669-based ligands were selected on the basis of their spectral compatibility and also due to their non-fluorogenic nature (permitting the detection of denatured protein conjugates in SDS-PAGE gels). Proteins were transferred to nitrocellulose membranes after fluorescence detection. Blocked membranes were then probed with antibodies against 2xHaloTag-HA-dMCP (using anti-HA, for detection of total 2xHaloTag-HA-dMCP levels) and GAPDH (using anti-GAPDH-HRP). Details for blotting procedures and the utilized antibodies are provided in the subsequent section.
SDS-PAGE and western blotting
Cell lysates were prepared by aspiration of growth media from individual culture wells followed by rinsing cells once with PBS before direct lysis in 1X NuPAGE LDS Sample Buffer (Thermo Fisher). Lysates were sonicated to shear genomic DNA and reduce sample viscosity, then stored frozen at −20 °C until use. Sample aliquots were reduced by adding NuPAGE Sample Reducing Agent (Thermo Fisher) and heat denatured at 70 °C for 5–10 minutes. Reduced and denatured samples were separated by SDS-PAGE. Transfer to nitrocellulose membranes was carried out using an iBlot2 transfer device (Thermo Fisher). Membranes were blocked using a blocking buffer based on PBS containing 0.05% Tween-20 (v/v, PBS-T) containing nonfat dry milk, dissolved at 5% (w/v).
Blocked membranes were probed with a mouse monoclonal anti-HA antibody (Clone 6E2, Cell Signaling Technologies) using a 1:1,000 volumetric dilution in blocking buffer. Probing with anti-HA proceeded overnight at 4 °C, with rocking. Membranes were washed three times with PBS-T (for 5 min per wash) prior to probing with a horse anti-mouse secondary HRP-conjugate (Cell Signaling Technologies, 4047) in PBS-T at a dilution of 1:3,000. Probing with the secondary antibody proceeded for 1 h in blocking buffer at room temperature prior to washing again three times with PBS-T. Signals from HRP conjugates were developed using freshly prepared SuperSignal West Pico PLUS Chemiluminescent Substrate mixtures (Thermo Fisher), with chemiluminescent recording using an iBright Imaging System (Thermo Fisher). Probed membranes were stripped using Pierce Restore Western Blot Stripping Buffer (Thermo Fisher) and re-blocked with blocking buffer prior to detecting loading control proteins, via either a rat anti-GAPDH HRP conjugate (BioLegend, 607903) using 1:10,000 dilution in PBS-T, or a mouse anti-β-actin-HRP conjugate (BioLegend, 643808) at a 1:3,000 dilution, also in PBS-T. Probing with loading control antibodies proceeded for 1 hour at room temperature before washing and chemiluminescent development as described.
Preparation of cells for single-molecule RNA imaging under live or fixed conditions
U2OS cells were seeded into FN-coated glass-bottom 8-well imaging dishes at 50,000 cells per well. Cells were co-transfected with plasmid encoding the indicated MCP or PCP-fusion protein variants driven from UBC promoters. In most cases, cells were transfected with 100 ng of coat protein-encoding plasmid; 50 ng of plasmid was used when transfecting plasmids encoding 1xmNG- or mVenus-fused coat protein variants. Coat protein-encoding plasmids were co-transfected with 100 ng of plasmid encoding the indicated MS2- or PP7-tagged transcripts (also expressed from UBC promoters). Cells were imaged two days post-transfection. HDF-neo cells were prepared for single-molecule imaging using lentiviral transduction (see below). Transduced cells were passaged twice before transfer to FN-coated glass-bottom 8-well dishes (at 50,000 cells per well) and treatment with 200 ng/μL doxycycline; cells were imaged after two days following doxycycline exposure.
Imaging of MS2-tagged mRNAs via 4xmNG-dMCP and smHCR
U2OS cells were prepared as described above. At two days post-transfection, cells were rinsed once with PBS prior to fixation using a pre-warmed 4% paraformaldehyde (PFA) solution. Working solutions of the fixative were prepared by diluting methanol-free PFA from 16% (w/v) solution stocks (Thermo Fisher, 28906) into PBS. Fixation proceeded for 20 minutes at 37 °C before removing the fixative and rinsing once with tris-buffered saline (TBS)-glycine buffer (to quench residual PFA) followed by an additional two rinses with PBS. FISH was performed using an smHCR protocol based on that described by Choi et al.26 First, cells were permeabilized using PBS containing 0.2% Triton-X 100 (v/v). Next, cells were washed twice using 2X Saline-Sodium Citrate (SSC) buffer (Fisher Scientific, BP1325–1) at room temperature for 5 min per wash, then pre-hybridized in 30% probe hybridization buffer (Molecular Instruments) for 30 min at 37 °C. Probe hybridization buffer was then exchanged for fresh probe hybridization buffer containing 4 nM of antisense probes against mCherry mRNA (Molecular Instruments). Cells were incubated with the probes overnight at 37 °C. Next day, cells were washed four times for five minutes with 30% probe wash buffer (Molecular Instruments) at 37 °C, then two times with 5X SSC buffer containing 0.1% Tween 20 (v/v, 5X-SSCT) at room temperature. Cells were then pre-amplified in amplification buffer (Molecular Instruments) for 30 min at room temperature. Hairpin solution was prepared by first snap-cooling aliquots of AF647-conjugated “B1” HCR amplifier hairpins (Molecular Instruments), then combining and diluting snap-cooled hairpins in amplification buffer to a final concentration of 60 nM for each hairpin. Amplification buffer was exchanged for hairpin solution and cells were incubated at room temperature in the dark for 45 min. Excess hairpins were then removed with five washes of 5X-SSCT, each lasting five minutes. Finally, HCR-labeled cells were imaged using a spinning disk confocal microscope (described below).
Confocal imaging of dMCP- and HCR-labeled transcripts
Confocal images were taken on an Andor Dragonfly 505 spinning disk confocal microscope equipped with a Zyla 4.2 plus sCMOS Camera with a 2x zoom lens and a 100x/1.45 numerical aperture oil objective lens. Signals from 4xmNG-dMCP were detected through a Chroma ET525/50m emission filter using 488 nm laser excitation at 1000 ms excitation time. Signals from H2B-mCherry were detected through a Chroma ET620/60x emission filter using 561 nm laser excitation at 1000 ms excitation time. Signals from AF647-conjugated HCR hairpins were detected through a Semrock FF01–698/70 emission filter using 641 nm laser excitation at 200 ms excitation (timed shorter to limit the photobleaching of AF647 chromophores). Z-stack recordings were carried out using a 200 nm step size; maximum intensity projections involved combining between 10–30 individual Z-slices, depending on sample dimensions.
Image analysis for SNR, particle area, and particle colocalization
Z-stack images from the Dragonfly Microscope were converted to maximum intensity projections for ImageJ analysis of SNR, particle area, and particle colocalization. The ‘Analyze Particles’ function was used to identify dMCP and HCR spots, their mean intensities, and their areas. The cytosolic intensity was measured as the mean intensity of pixels within the cytosol, excluding pixels in the nucleus and pixels in spots. Background intensity was measured as the mean intensity of pixels in a large rectangular region of unoccupied space outside the cell. Signal-to-noise was calculated as the difference between spot intensity and background intensity divided by the difference between cytosolic intensity and background intensity. Spot colocalization was calculated as the portion of dMCP spots whose perimeter was within a one-pixel radius of the HCR spot perimeter and vice versa.
Widefield imaging
Widefield images were taken with a Zeiss AxioObserver Z1 microscope equipped with an HXP 120V halogen lamp as the excitation source. Images were recorded using a Prime95B sCMOS camera (Teledyne Photometrics) and the ZEN imaging software (Black Edition, Zeiss). Images were recorded through a 10x/0.3-NA air objective lens, a 20x/0.8-NA air objective lens, or a 63x/1.4-NA oil objective lens. mTurquoise2 and ECFP were visualized under ‘ECFP’ filter cube settings (Chroma 49001; ET436/20x, T455lp, ET480/40m); mNG and mVenus under ‘EYFP’ settings (Chroma 49003; ET500/20x, T515lp, ET535/30m); mCherry, mScarlet-i, JF570, and JF585 under ‘mCherry’ settings (Chroma 49008; ET560/40x, T585lpxr, ET630/75m); JFX646 and JFX650 under ‘narrow-excitation Cy5’ settings (Chroma 49009; ET640/30x, T660lpxr, ET690/50m). Exposure times of 50 ms were used for live imaging single-RNA dynamics with 4xmNG-dMCP; 100 ms exposures were used for live imaging of 2xmNG-dMCP; 200 ms exposures were used for imaging JFX650-stained 2xHaloTag-dMCP; 200 ms exposures were used in capturing the 4xmNG-dPCP intensities shown in Fig. 5. Live imaging of 1xmNG-tagged MCP and PCP variants, as shown in Supplementary Movies 1 and 12, Extended Data Fig. 7, and Supplementary Fig. 15, were collected using 50 ms exposure times and 2×2 binning for increased sensitivity. For consistency, the 4xmNG-tagged variants in the aforementioned movies and figures were also imaged using 50 ms exposure and 2×2 binning. Additionally, Supplementary Movie 2 depicts 1xmNG-tagged dMCP imaged using a 200 ms exposure and with 1×1 binning. For any other imaging, the exposure times were set individually, with times ranging between 2 and 2000 ms depending on the reporter and imaging context.
Staining and imaging of HaloTag-dMCP fusions
JaneliaFluor (JF)-containing HaloTag ligands based on chloroalkane-modified dyes were gifts from Dr. Luke Lavis of Janelia Farm. Cells expressing HaloTag-fused proteins were stained under live conditions at 37 °C. Cells were stained in growth media containing 200 nM dye. To ensure their full dissolution, dyes were diluted into pre-warmed media aliquots and mixed vigorously by pipetting and brief vortexing prior to application to cells. For imaging under live conditions, cells were stained in dye-containing media for 40 minutes with incubation at 37 °C prior to removing the staining solution and rinsing with fresh, pre-warmed media (3×5 min). For cells imaged under fixed conditions, cells were fixed using 4% PFA immediately after removal of cell staining media. PFA fixation and subsequent rinsing was carried out as described above. Stained live cells were imaged live in fully supplemented FluoroBrite-based media. Fixed cells were imaged in PBS.
Bioluminescence measurements
For the bioluminescent assay, 100,000 HEK293FT cells were transfected in suspension and plated on a 96-well white flat-bottom TC-treated microwell plate. Transfection mixtures were prepared using the following DNA amounts for each transfected well: 10 ng of plasmid encoding the indicated NLuc-MCP variant driven by minCMV promoters, 50 ng of plasmid encoding CMV-driven H2B-mCherry (either with or without an inserted 16xMS2 array), and 50 ng of a plasmid encoding a CMV-driven Firefly Luciferase (FLuc) as a transfection control. End point luminescence values were obtained two days after transfection using Nano-Glo Dual-Luciferase Reporter (NanoDLR) Assay System (Promega) according to the manufacturer’s instructions. Briefly, growth media from individual wells was replaced with 40 μL of Opti-MEM (Thermo Fisher) before adding 40 μL of ONE-GLO EX substrate. After incubating at room temperature for 5 min, FLuc luminescence values were measured with a SpectraMax M5 Multimode Microplate Reader (Molecular Devices) using one read area and a one-second integration time per well. NanoDLR Stop & Glo Substrate was diluted 1:100 into Stop & Glo Buffer before adding 40 μL to each well to quench FLuc luminescence and induce NLuc luminescence. After incubating at room temperature for 15 min, NLuc luminescence values were measured using the microplate reader with the same acquisition settings as FLuc. Relative luminescence values were obtained by dividing NLuc luminescent values by the FLuc values for each well.
Imaging of nuclear transcripts using 1xHaloTag-dMCP
For imaging nuclear-localized transcripts (as in Supplementary Fig. 5), HEK293FT cells were seeded into FN-coated glass bottom 8-well imaging dishes at 100,000 cells per well. Cells were transfected with 200 ng of plasmid encoding 1xHaloTag-dMCP expressed from a minCMV promoter in combination with 200 ng of plasmid encoding Cox8-mTurq2–16xMS2-pA, also via a minCMV promoter. The next day, cells were stained with JFX650 HaloTag ligand using media containing the dye at 200 nM. Staining proceeded for 40 min, followed by one rinse with PBS before immediately fixing cells using 4% PFA solution as described in the preceding sections. Cells were rinsed with PBS three times before imaging in PBS.
Step photobleaching analysis
U2OS cells were seeded into FN-coated glass bottom 8-well imaging dishes at 50,000 cells per well. Cells were transfected in suspension using transfection complexes prepared with 100 ng each of plasmid DNA encoding 1xHaloTag-dMCP and Cox8-mTurq2–16xMS2-pA, both driven from UBC promoters. Two days after transfection, cells were stained with a JFX650-based HaloTag ligand prior to rinsing with PBS and fixation with 4% PFA, both as described above. JFX650-stained dMCP spots were recorded by spinning disc confocal microscopy using 1000 ms exposure times. Photobleaching proceeded via continuous excitation at maximum laser intensity over a 5 minute duration, with continuous recording of signal. TrackMate, via ImageJ, was used to identify centroids of each spot. The quickPBSA python library was then used to generate photobleaching traces from the trackmate centroid coordinates and the photobleaching videos. QuickPBSA was also used for automated filtering and subsequent analysis of these traces.
Imaging of nuclearly retained mRNAs
Images in Fig. 3a and Extended Data Fig. 5 are widefield microscopy images of transfected HEK293FT. Cells were plated on an FN-coated glass-bottom 8-well imaging dish at 200,000 cells per well and co-transfected with plasmid mixtures containing 200 ng of plasmid encoding mNG-HA-dMCP in combination with 200 ng of plasmid encoding the indicated transcripts. In these analyses, mNG-dMCP was expressed from a minCMV promoter, with expression of the indicated MS2-tagged transcripts driven by UBC promoters.
Images in Fig. 3b–c and Extended Data Fig. 6 are of U2OS cells, also grown in FN-coated imaging wells, with cells seeded at a density of 50,000 cells per well. Cells were transfected with 50 ng of plasmid encoding 1xmNG-dMCP in combination with 100 ng of plasmid encoding MEG3NRE-β-Globin-24xMS2-pA, both expressed from UBC promoters. Two days after transfection, cells were prepared and stained for nuclear speckles as described by Ilik et. al. 2023.34 Briefly, cells were rinsed once with PBS before fixation by treatment with a 4% PFA solution for 10 minutes at room temperature. Fixed cells were then washed three times with PBS for 5 min per rinse. Cells were then permeabilized by treatment with a PBS solution containing 0.5% Triton-X 100 (v/v) for 10 minutes at room temperature, followed by rinsing three times using PBS containing 0.1% Triton-X 100 (v/v) for 5 min per rinse. Rinsed cells were then blocked via treatment with a PBS solution containing 3% BSA (w/v, PBS-BSA) for 30 min at room temperature before exchanging cells into a staining solution containing anti-SC-35 mouse primary antibody (Santa Cruz Biotechnology, sc-53518) diluted 1:100 (v/v) into PBS-BSA. Staining proceeded overnight at 4 °C. Next day, stained cells were washed three times using PBS containing 0.1% Triton-X 100 (v/v), with each wash proceeding for 5 min each at room temperature. Washed cells were then stained using a secondary staining solution based on PBS-BSA containing 30 nM DAPI and an AlexaFluor-647 (AF647)-conjugated rabbit anti-mouse secondary antibody (Thermo Fisher, A-21239) at a dilution of 1:500 (v/v). Secondary staining proceeded for 1 hour at room temperature and was protected from light, followed by three washes using PBS containing 0.1% Triton-X 100 (v/v) for 5 min per wash. Stained and washed cells were imaged in PBS. ImageJ was used to generate intensity traces for the plots displayed in Fig. 3b–d and Extended Data Fig. 6.
RT-PCR and Microscopy Analysis of MEG3NRE-BFP-24xMS2-pA RNA Expression
For RT-PCR and microscopy analysis of MEG3NRE-BFP-24xMS2-pA, HEK293FT cells were seeded into 12-well TC-treated plates at a density of 800,000 cells per well. Cells were transfected with 100 ng of plasmid encoding MEG3NRE-BFP-24xMS2-pA or BFP-24xMS2-pA as a control, both regulated from UBC promoters. Transfections were performed with 700 ng of salmon sperm DNA as filler. BFP expression was recorded by fluorescence microscopy two days after transfection before extracting total RNAs as described below.
For RNA extraction, the plate was placed on ice, all media was quickly removed by aspiration, and 500 μL of TriZol (LifeTechnologies) was directly added to all wells. Wells were scraped and gently mixed by pipetting and then cell lysates in TriZol well were transferred to individual tubes on ice for each well. Chloroform phase separation was then performed by adding 100 μL of chloroform (Fisher Chemical) to each tube and mixing by inverting, returning to ice for 4 min, then mixing a second time. Tubes were then spun down at 4 °C and 17,000 × g for 20 min. 50 μL of fluid was removed from the clear top layer of each spun tube and transferred to fresh RNAse-free tubes, then 50 μL of 70% ethanol prepared using RNAse-free water and 100% ethanol was added to these tubes. These solutions were then added to RNeasy Mini spin columns (Qiagen) and RNA purification proceeded according to the manufacturer’s instructions. Purified RNAs were stored at −80 °C until use.
For cDNA synthesis, the RNA extracts were first enzymatically digested to eliminate genomic and plasmid DNA using dsDNAse (Thermo Scientific). Digestions were carried out on 3000 ng of total RNA in 10 μL reaction volumes, with incubations proceeding for 30 min at 37 °C. The digested reactions were then divided into 5 μL aliquots and used in cDNA generation or “no reverse transcriptase” (no-RT) control reactions via the ThermoFisher Maxima H Minus cDNA Synthesis Master Mix kit (Thermo Scientific, M1661) according to the manufacturer’s instructions. The generated cDNAs and controls were then used as PCR templates as described below.
Two sets of primers were used to amplify target sequences from the generated cDNA and no-RT control samples. The first set was designed to amplify a region spanning from the transcription start site of the UBC promoter to a 3’-region of the BFP-encoding gene (5’-GATTTGGGTCGCGGTTCTTG-3’ and 5’-GTGCTCAGGTAGTGGCTGTC-3’). A second primer set based on previously described sequences was used to amplify GAPDH (5’-TTGGCTACAGCAACAGGGTG-3’ and 5’-GGGGAGATTCAGTGTGGTGG-3’; Kwon et. al. 2021).66
Amplifications were performed with Taq 2X Master Mix (NEB, M0270L) using 20 μL reaction volumes containing 1 μL of cDNA or no-RT control template solutions (or 1 ng of plasmid DNA for positive control reactions). Forward and reverse primers were added to the reactions to final concentrations of 250 nM each. Thermal cycles proceeded with an annealing temperature of 58 °C and an extension time of 1 min. Reactions were performed using 25 cycles for the first UBC/BFP primer set and 28 cycles for the GAPDH set. Amplicons were separated by DNA electrophoresis using 1.5% agarose gels. Gels were stained in ethidium bromide-containing running buffer for 30 min and rinsed in DI water for 10 min before recording band intensities on an iBright Imaging System (Thermo Fisher). Product lengths were assessed using the GeneRuler Plus 1 kb DNA Ladder (Thermo Fisher, FERSM1333).
Lentiviral transduction
Lentiviral particles were produced using a second-generation vector system. HEK293FT cells were grown to 90% confluence in a six-well dish and transfected with 7503 ng of a pLV-based transfer plasmid encoding a UBC-driven 2xmNG-dMCP in combination with a constitutively expressed TetOn3G transactivator protein and a doxycycline-inducible (TRE3G-driven) CFP-24xMS2-pA transcript sequence (encoded in the reverse direction). The transfer plasmid was co-transfected with 1.25 μg of the psPAX2 packaging plasmid and 1.25 μg of the pVSVG envelope plasmid. Transfection media was replaced with fresh media the next day. Virus-containing supernatants were harvested 24 h and 48 h later. Supernatants were filtered through a low-protein binding 0.45 μm filter before immediate use in cell transduction or storage at −80 °C. Primary neonatal human dermal fibroblast cells were transduced by direct addition of filtered supernatant into culture samples.
Harringtonine treatment
Single mRNAs were visualized in live cells pre- and post-treatment with the translation inhibitor harringtonine (HT; HY-N0862, MedChemExpress). In these analyses, U2OS cells were prepared as described above and imaged first in pre-warmed FluoroBrite media to record transcript trajectories under translationally-active conditions. Cell positions were recorded for repeated viewing at later time points. Translation inhibition was facilitated by treatment with HT at a 4 μM final concentration, with incubation for 30 min at 37 °C before recording transcript trajectories again.
For experiments involving HT withdrawal, cells were treated with 0.4 μM HT and incubated for 30 min at 37 °C. HT withdrawal was facilitated by rinsing cells three times with prewarmed and HT-free FluoroBrite media. We were unable to image the same cells before and after washout due to disruption of plate position from media replacement steps. Instead, cells were located and initial RNA trajectories were recorded within 10 min after harringtonine washout, and continued to be recorded at 40-minute and 80-minute timepoints following the initial recording period for each region.
Analysis of particle movements
TrackMate (via ImageJ) was used to detect and analyze particle movements from live-cell dMCP recordings of single RNA molecules. Videos of 4xmNG-dMCP emissions were recorded for 40 frames at 0.085 sec/frame using a 50 ms exposure time and with pixel width of 109 nm. The videos shown in Fig. 5f, taken with 2xHaloTag-dMCP and 4xmNG-dPCP, are both 20 frames at 0.2255 sec/frame (200 ms exposure) and 218 nm pixel width (these pixels are larger because 2×2 binning was used to increase sensitivity). Single particles were detected using TrackMate’s LoG detector for 3-pixel diameter spots and filtered for quality. Tracking was performed with a simple LAP tracker. Maximum particle displacement over one frame for 4xmNG-dMCP videos was set to 5 pixels (0.55 μm). For 2xHaloTag-dMCP and 4xmNG-dPCP, this displacement was set to 3 binned pixels (0.65 μm). Gaps were closed over a maximum of 3 frames and either 5 pixels or 3 binned pixels as described above. Only tracks with at least 3 localizations were included in the analysis. Note that setting minimum track durations at too high a value (above 5) biases track detection towards slower moving particles, as they remain in focus for longer durations compared to faster moving particles (with the latter tending to diffuse out of the detectable z-dimension).
Data from trackmate analyses was exported in XML format and the MSDanalyzer matlab package was used to calculate mean-squared displacement values from the exported files. The calculated diffusion coefficients () shown in the bottom sections of Supplementary Fig. 7, 8, and 10 were calculated from the combined MSD curves of all traces involved. Apparent diffusion coefficients () of single traces were calculated as described in previous works (Katz et. al. 2016)40, using the mean squared displacement at a time delay of one frame, dimensionality () of two, and the time delay () in seconds per single frame, according to the following formula:
Individual particle traces were plotted as vector graphics and color coded by apparent diffusion coefficient using an in house Python script.
Serum stimulation
U2OS cells were co-transfected with plasmids encoding 4xmNG-dMCP and mCherry-3’UTRβ-actin-16xMS2-pA in preparation for live single molecule imaging as described above. The next day, cells were starved of serum by exchange into serum-free growth media (prepared in a similar manner as standard growth media but with omission of FBS). After 24 hours under serum starvation, cells were imaged with visualization of the labeled transcripts and recording of cell locations as 2D coordinates within imaging wells. The serum starved cells were then stimulated by direct addition of FBS to the medium to a final concentration of 10% FBS (v/v). Transcript locations were then imaged via widefield microscopy at 40 and 80 minute timepoints. Drift correction was applied to the resulting image sets using ImageJ to compensate for significant drift that occurred when pipetting serum into the imaging dish.
Generation of and characterization of CRISPR-tagged cells
Donor DNA containing homology arms corresponding to the human TOMM20 locus was a gift from the Allen Institute for Cell Science (AICSDP-8:TOMM20-mEGFP, AddGene, Plasmid #87423). The plasmid was modified by replacing the GFP insert with a sequence corresponding to mCherry-10xMS2. The donor was integrated into HEK293FT cells using guide RNAs targeting the endogenous TOMM20 locus (at annealing sites 5’-AATTGTAAGTGCTCAGAGCT-3’ and 5’-TGGTAGTTGAGCAGCTCTGGGGG-3’) and on-target genomic integration was confirmed using PCR and Sanger sequencing. Integration resulted in the translation of TOM20-mCherry protein from 10xMS2-tagged mRNA. The correct localization of TOM20-mCherry protein was confirmed through immunostaining with a mouse monoclonal anti-TOM20 antibody (clone F-10; sc-17764, Santa Cruz Biotechnology). For immunostaining, cells were fixed in 4 % PFA (as described above) and permeabilized by treatment with PBS containing Triton-X 100 (0.2%, v/v) for 5 min at room temperature. Immunostaining was then performed overnight at 4 °C via incubation in Immunofluorescence Blocking Buffer (Cell Signaling Technology, 12411S) containing diluted primary antibody at a 1:1,000 dilution. Primary-stained samples were then washed three times in PBS containing 0.05% Tween-20 (v/v, 5 min per rinse) before secondary detection using an AlexFluor488 (AF488)-conjugated anti-mouse secondary antibody (Thermo Scientific, A-11001) at a 1:2000 dilution. Secondary antibody staining proceeded at room temperature for one hour in PBS with 0.05% Tween-20 (v/v) before rinsing three times using PBS containing 0.05% Tween-20 for 5 min per rinse. Cells were then imaged in rinse solution.
Two-color imaging using dMCP and dPCP
The fluorescence images displayed in Fig. 5d and 5e represent co-transfected HEK293FT cells. Cells were plated on an FN-coated glass bottom 8-well imaging dish at 200,000 cells per well and co-transfected with plasmids encoding the indicated proteins and RNAs in the following amounts: 100 ng for plasmids encoding minCMV-driven mScarlet-dMCP or mNG-dPCP, in combination with 100 ng of an RNA-encoding plasmid based on a U6-driven circular tornado RNA or the CMV-driven MEG3NRE-β-Globin-24xMS2-pA transcript.
For the dual RNA imaging results shown in Fig. 5f, U2OS were seeded into FN-coated 8-well imaging dishes at 50,000 cells per well and co-transfected with plasmids encoding the indicated proteins and RNAs. Transfection mixtures contained 100 ng each of four plasmids: one encoding 2xHalo-dMCP, one encoding 4xmNG-dPCP, one encoding H2B-mCherry-24xMS2, and one encoding LSS-mTurq2–18xPP7, all driven by UBC promoters.
Bipartite membrane-targeting of mVenus-dMCP via a nanobody-CAAX fusion
Targeting of mVenus-dMCP to the plasma membrane was facilitated by co-expression with an anti-GFP nanobody bearing a C-terminal CAAX tag (KMSKDGKKKKKKSKTKCVIM) to facilitate farnesylation-mediated membrane-targeting (VHH-GFP4-CAAX). U2OS cells were plated on an FN-coated glass bottom 8-well imaging dish at 50,000 cells per well and co-transfected with 50 ng of plasmid encoding a UBC-driven mVenus-dMCP, 100 ng of plasmid encoding a UBC-driven H2B-mCherry-24xMS2-pA, and either 100 ng of plasmid encoding a UBC-driven VHH-GFP4-CAAX or 100 ng of salmon sperm DNA as a control. Cells were imaged in FluoroBrite media two days after transfection.
Statistics and reproducibility
Statistical analyses were conducted using GraphPad Prism (ver 10.1.2). All displayed microscopy images are representative of results from at least three independent replicate experiments, each with similar outcomes. All displayed western blot, protein gel, and DNA gel images are representative of results from at least two independent replicate experiments, each with similar outcomes.
Data availability
The datasets generated during and/or analyzed during the current study are available from the corresponding author upon reasonable request. Plasmid DNA and detailed sequence information for selected constructs are available through AddGene.
Extended Data
Extended Data Fig. 1. MS2-binding analysis using NLS-cpMCP-S52.

(a) Schematic depicting the RNA binding-mediated nuclear export of NLS-cpMCP-S52, which is imported into and retained within the nucleus in its unbound form. Upon overexpression and nuclear export of MS2-tagged mRNA, protein-RNA binding leads to translocation of NLS-cpMCP-S52 to the cytoplasm. (b) Widefield fluorescence microscopy images of HEK293FT cells co-transfected to express mVenus-NLS-cpMCP-S52 and either H2B-mCherry-pA or H2B-mCherry-16xMS2-pA transcripts show that expression of MS2-tagged mRNA leads to nuclear exclusion of NLS-cpMCP-S52, indicating that it is capable of binding to MS2 loops. Insets in the bottom right display H2B-mCherry expression (c) HEK293FT cells were transfected to express mVenus-cpMCP-S52 (with no NLS) or the degron-appended mVenus-dMCP-S52 (both lacking an NLS). These cells were cotransfected to express H2B-mCherry-pA or H2B-mCherry-16xMS2-pA transcripts. The images show that the fluorescence of mVenus-dMCP-S52 is heavily reduced in the absence of MS2 RNA, and that the fluorescence is partially recovered in the presence of MS2 RNA.
Extended Data Fig. 2. Extended data of dMCP with various fluorescent and bioluminescent fusion partners.

(a) Full-well views of the HEK293FT cells shown in Fig. 1f display dMCP’s sustained performance across a large population of transfected cells. Tiled fluorescence microscopy images of five dMCP fusion proteins are shown, with fluorescence emissions ranging from cyan to far-red wavelengths. The signal from mCherry or mTurq2 cotransfection markers are shown in the bottom right windows. (b) MS2-RNA stabilization of an NLuc-dMCP fusion construct. Relative NLuc fluorescence was normalized to Fluc co-transfection marker and quantified by plate reader. HEK293FT cells were co-transfected with NLuc-MCP variants and either H2B-mCherry-pA (gray circles) or H2B-mCherry-16xMS2-pA (red circles). Individual points, bars, and error bars represent the measured intensity, mean and S.D. of n = 3 independent transfections.
Extended Data Fig. 3. Extended data comparing dMCP and HCR single-molecule RNA puncta.

(a-c) Maximum intensity projection confocal microscopy images of fixed U2OS cells expressing H2B-mCherry-24xMS2 RNA tagged by 4xmNG-HA-dMCP and HCR probes targeting mCherry. dMCP signal is shown on the leftmost column (green), HCR signal shown left-of-center (magenta), merged images are shown right-of-center, and an overlay with digitally-labeled cytosolic spots as determined by ImageJ’s particle analysis plug-in is shown on the rightmost column. In the overlayed images, green spots are dMCP spots that do not overlap HCR, magenta spots are HCR spots that do not overlap dMCP, and white spots are spots from both channels which overlap. H2B-mCherry signal is shown in the bottom right. (d) Signal-to-noise ratio (SNR) of dMCP spots compared with HCR spots across three cells. SNR is measured as the average intensity of a spot divided by the average intensity of the entire cytosolic region excluding spots. Both values are calculated with the average background intensity of the local culture medium, calculated as the MFI of a large boxed region in each image in which no cells were detected, subtracted. Bars represent the mean of each population. (c) Area in square micrometers of dMCP spots in comparison to HCR spots. Bars represent the mean of each population. (d) Tabulated values for co-localization between dMCP and HCR spots. dMCP spot counts per cell are a; n = 182, b: n = 299, c: n = 447. HCR spot counts per cell are a: n = 138, b: n = 269, c: n = 345. The lower HCR spot count is primarily due to closely spaced, large puncta that were collectively counted as single foci because they could not be individually resolved.
Extended Data Fig. 4. Confocal images and spot analysis comparing 1xmNG-dMCP to 1xmNG-NLS-tdMCP.
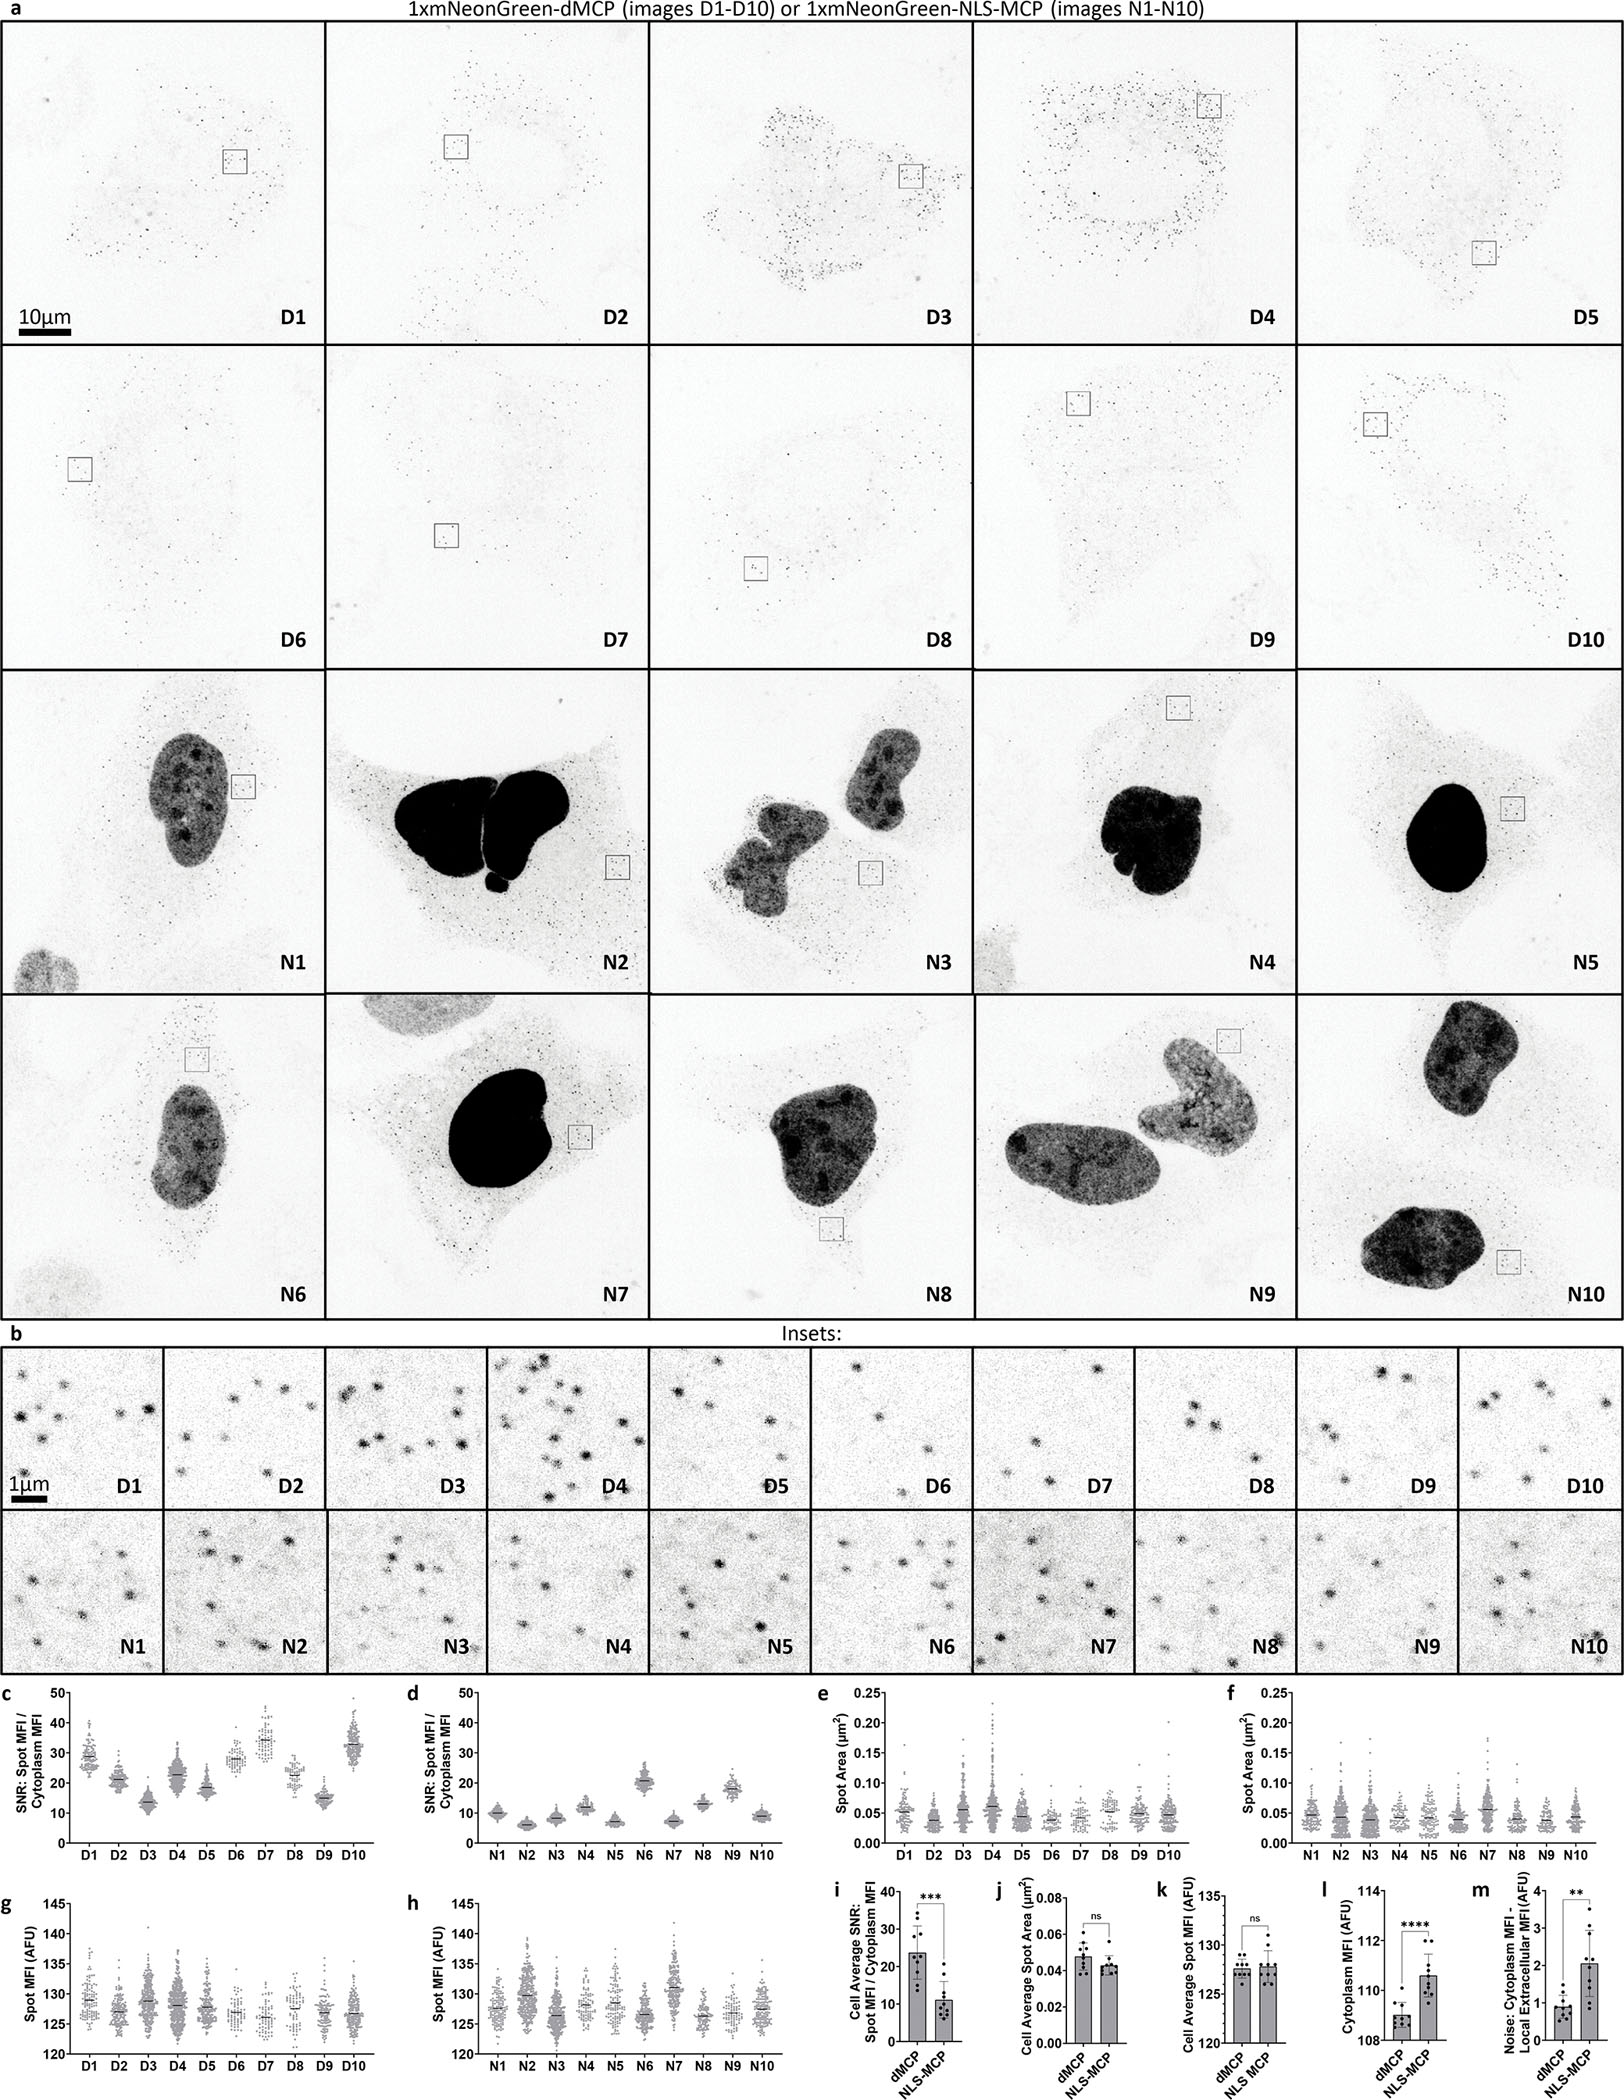
(a) Maximum intensity projection confocal microscopy images of fixed U2OS cells expressing H2B-mCherry-24xMS2-pARNA tagged by 1xmNG-HA-dMCP (top two rows, images D1-D10) or 1xmNG-HA-NLS-tdMCP (bottom two rows, images N1-N10). Images are displayed with signal inverted to better preserve visibility of spots after image compression below original 2046-pixel width. (b) Zoomed images displaying regions outlined by boxes in (a). These images more accurately display the intensity and size of spots as they appear in the original images. (c,d) Signal-to-Noise Ratio (SNR) of spots in all displayed (c) dMCP and (d) NLS-MCP cells. SNR is measured as the Mean Fluorescent Intensity (MFI) of pixels within a spot divided by the mean fluorescent intensity of the entire cytosolic region excluding spots and the nucleus (see Supplementary Fig. 6 for a portrayal of how this region is defined). Both values are calculated with the average background intensity of the local culture medium (calculated as the MFI of a large boxed region in each image in which no cells were detected) subtracted. Bars represent the mean of each population. (e,f) Area in square micrometers of (e) dMCP and (f) NLS-MCP spots. Bars represent the mean of each population. (g,h) MFI of (e) dMCP and (f) NLS-MCP spots. Bars represent the mean of each population. (i) Comparison of mean SNR between the ten dMCP and ten NLS-MCP images. Statistical significance determined by unpaired two-tailed Student’s t-test: *** P = 0.0002. (j) Comparison of mean spot area between the ten dMCP and ten NLS-MCP images. Statistical significance determined by unpaired two-tailed Student’s t-test: ns P = 0.1073. (k) Comparison of mean spot MFI between the ten dMCP and ten NLS-MCP images. Statistical significance determined by unpaired two-tailed Student’s t-test: ns P = 0.7412. (l) Comparison of MFI for cytosol (as described above) between the ten dMCP and ten NLS-MCP images. Statistical significance determined by unpaired two-tailed Student’s t-test: ****P = 8.9 × 10⁻⁵. (m) Comparison of noise- calculated cytosol MFI minus average background intensities of local culture medium (as described above) between the ten dMCP and ten NLS-MCP images. Statistical significance determined by unpaired two-tailed Student’s t-test: ** P = 0.0010. Spot counts for each image are D1: n = 111, D2: n = 165, D3: n = 284, D4: n = 444, D5: n = 192, D6: n = 70, D7: n = 70, D8: n = 69, D9: n = 115, D10: n = 177, N1: n = 132, N2: n = 308, N3: n = 320, N4: n = 88, N5: n = 116, N6: n = 191, N7: n = 209, N8: n = 109, N9: n = 86, N10: n = 150.
Extended Data Fig. 5. Expanded images of mRNAs exhibiting varying degrees of nuclear retention as revealed by dMCP.
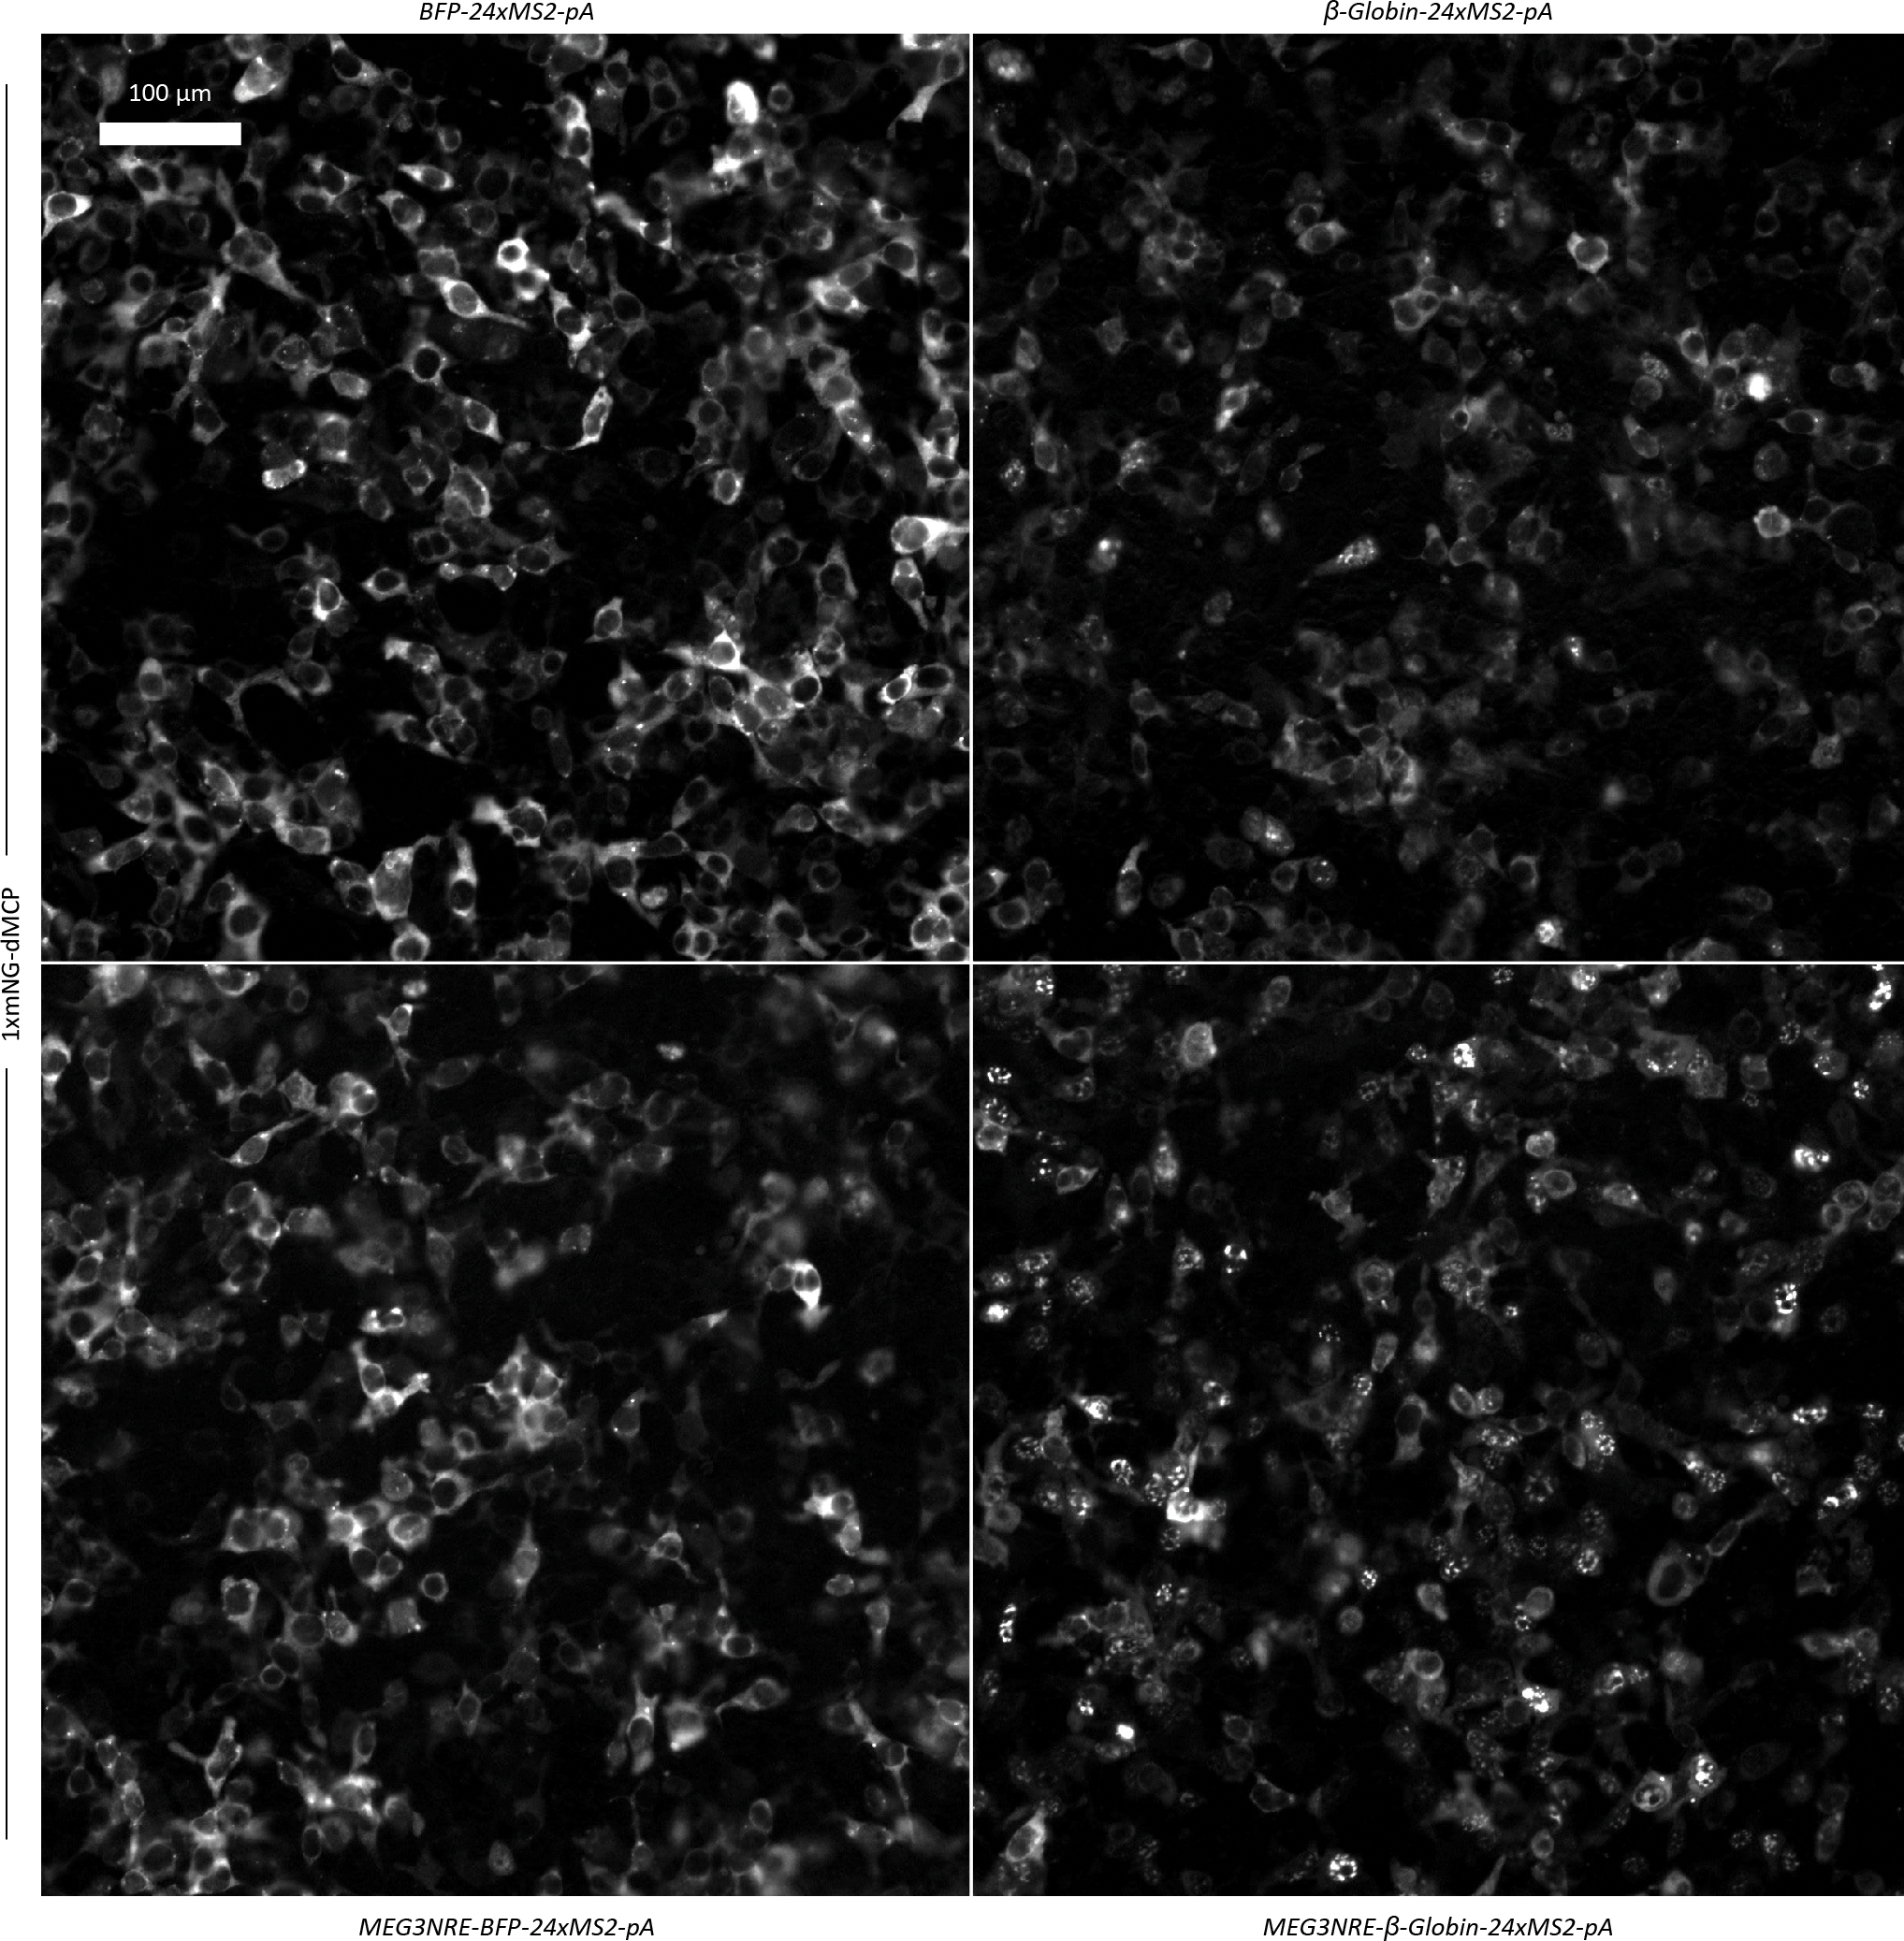
Here, expanded views of the samples in Fig. 3a. are shown in order to display a larger population of cells with dMCP-labeled mRNA. HEK293FT were transfected to express mNG-HA-dMCP and mRNAs that show differing levels of nuclear retention depending on the presence of a MEG3 Nuclear Retention Element and/or introns.
Extended Data Fig. 6. Nuclear speckle co-localization analysis of MEG3NRE-β-Globin-24xMS2-pA mRNA tagged with mNG-HA-dMCP, mNG-HA-tdMCP, or mNG-HA-NLS-tdMCP.

Widefield fluorescence microscopy images of fixed U2OS cells transfected to express MEG3NRE-β-Globin-24xMS2-pA mRNA and (a) 1xmNG-HA-dMCP, (b) 1xmNG-HA-tdMCP, or (c) 1xmNG-HA-NLS-tdMCP. Nuclear speckles were stained using anti-SC35 primary antibody and an AlexaFluor-647 (AF647)-conjugated rabbit anti-mouse secondary antibody. Signals from mNG-tagged MCP variants are displayed in green, and signals from AF-647 stained nuclear speckles are displayed in magenta. The intensity profiles below each image are measured for the regions indicated by yellow arrows, with values normalized to the maximum intensity of each individual trace.
Extended Data Fig. 7. Widefield live single-molecule RNA imaging comparison of MCP variants.
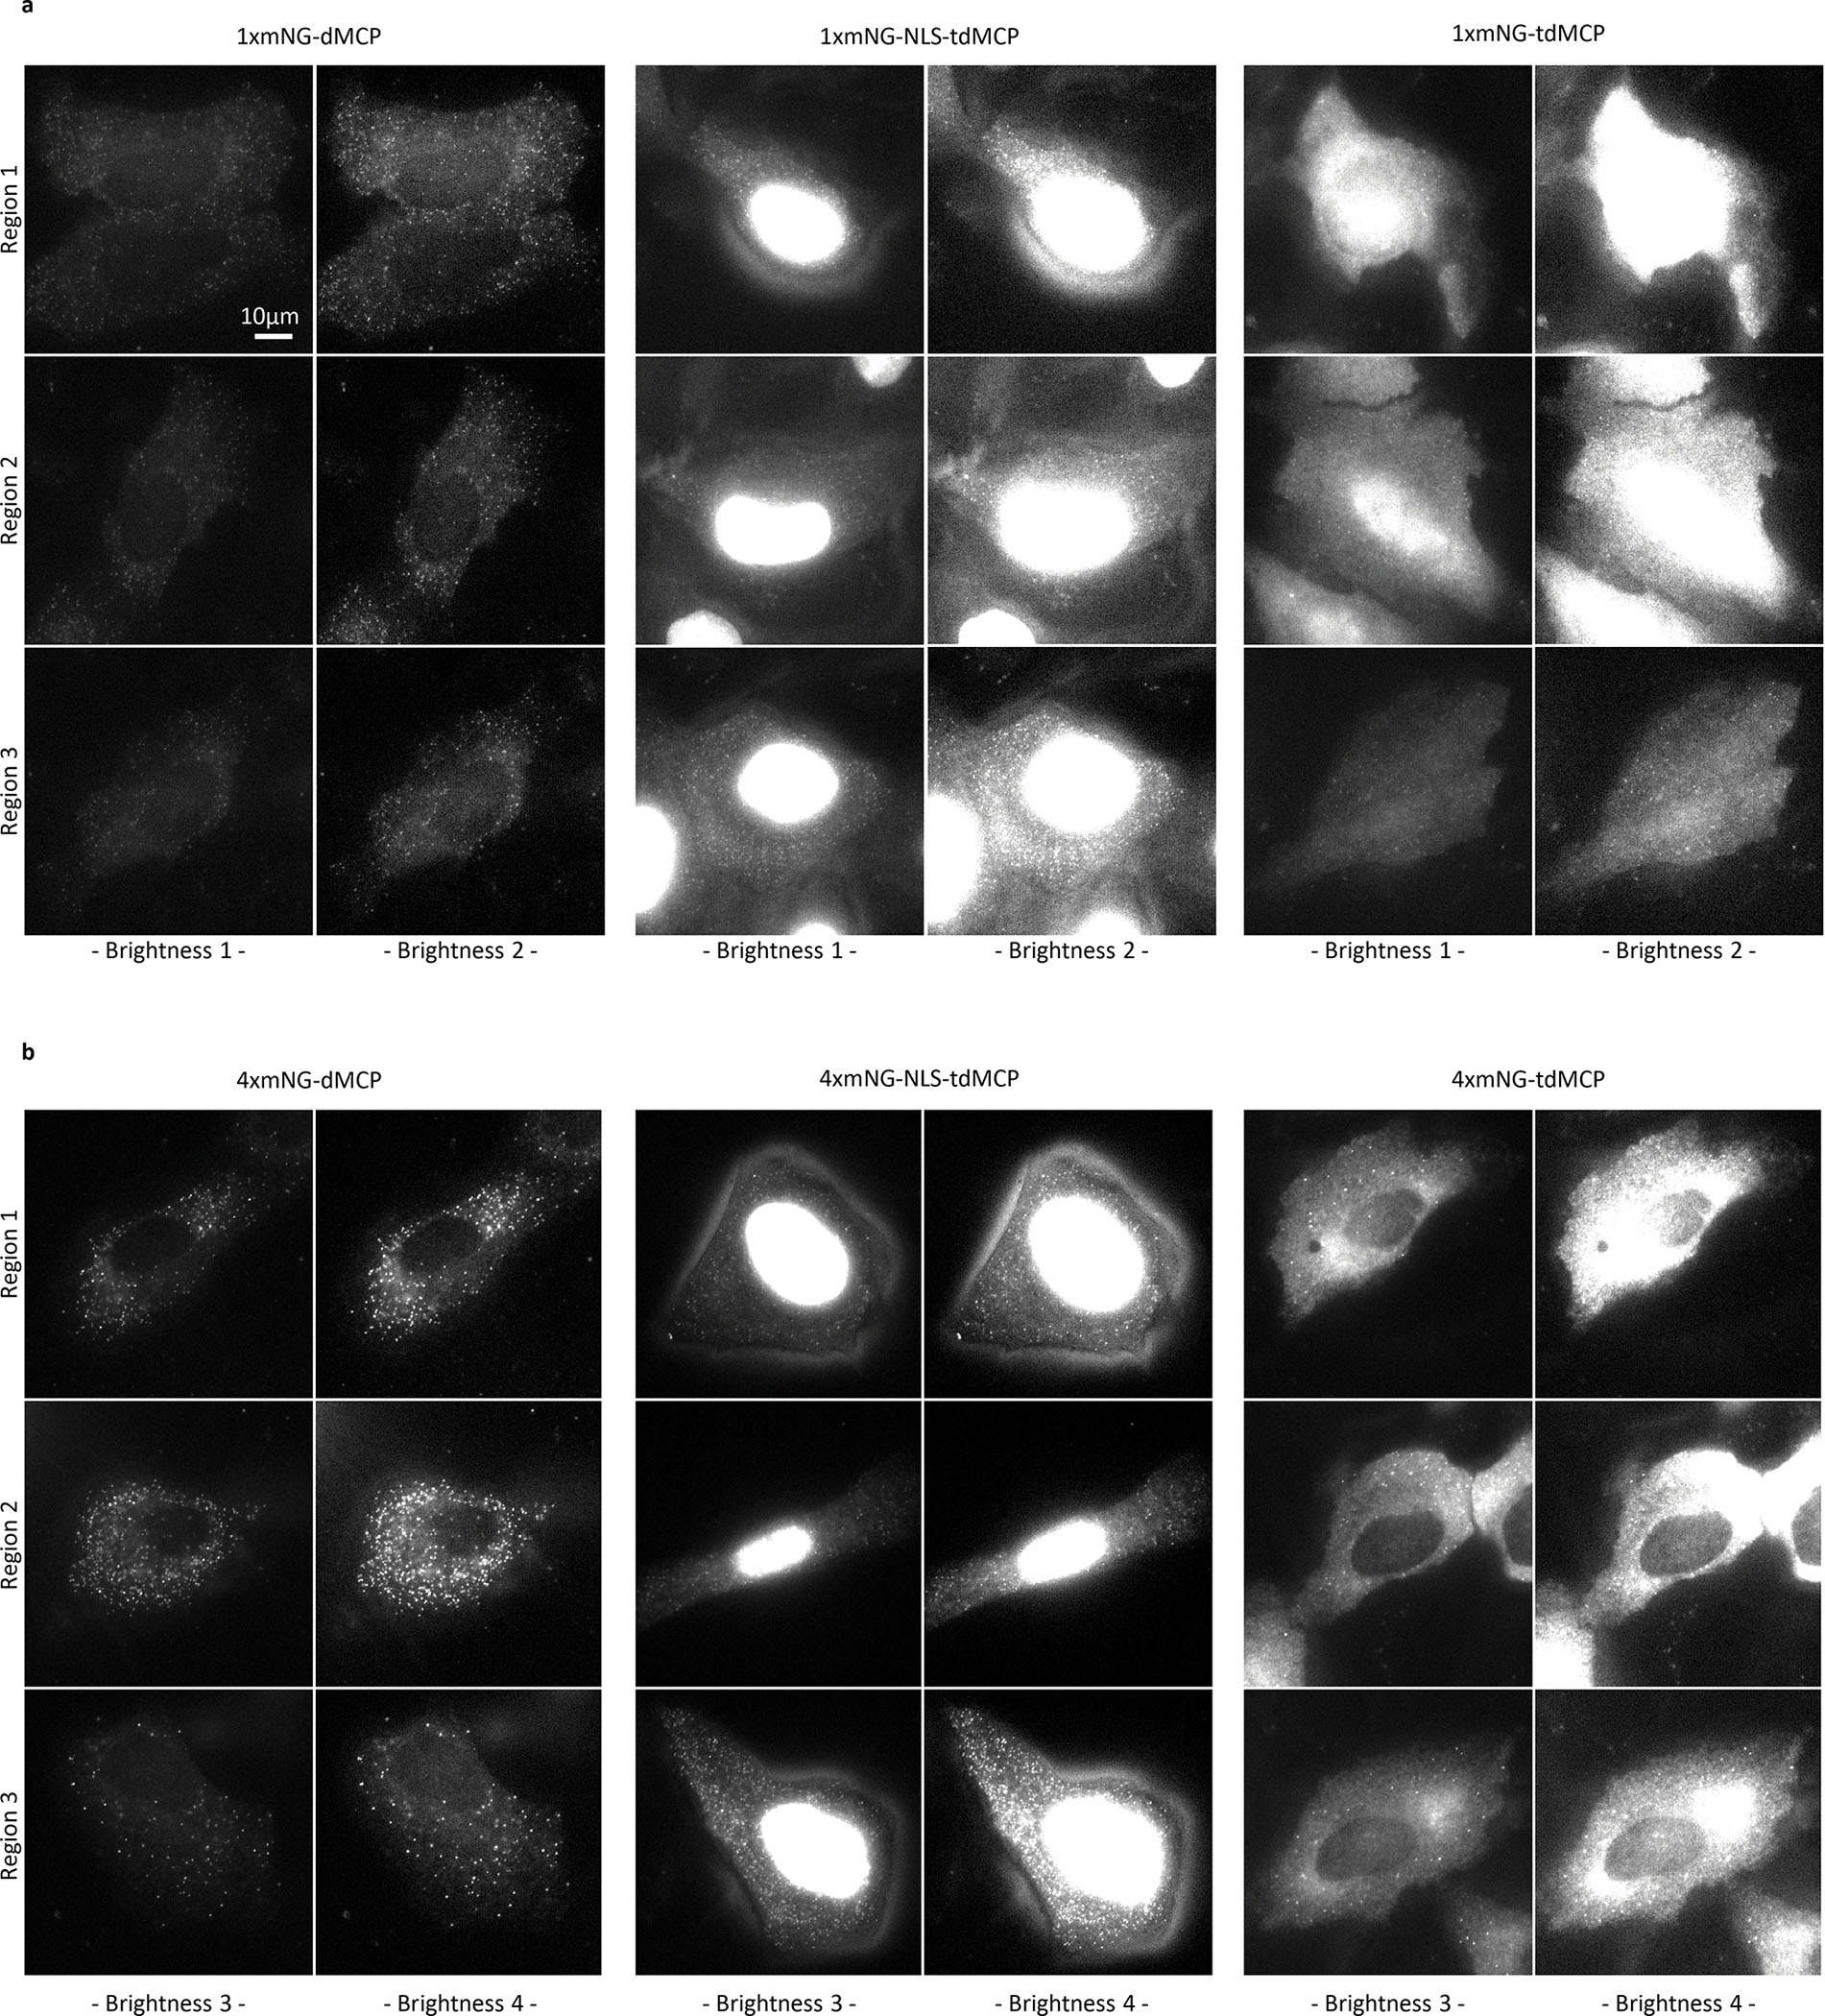
Widefield fluorescence microscopy images of live U2OS cells transfected to express mCherry-24xMS2-pA mRNA and HA-dMCP (left), HA-NLS-tdMCP (center), or HA-tdMCP (right) fused to (a) 1xmNG or (b) 4xmNG. All images are single frames extracted from live recordings that were obtained using the same microscope settings throughout. Images are displayed with multiple brightness settings to more fully portray the relative image quality produced by each variant.
Extended Data Fig. 8. Stabilization of dMCP by RNA containing reduced-affinity MS2 loops.

(a) Generalized ribonucleotide sequences for high affinity C-variant and reduced affinity U-variant MS2 loops. ‘S’ corresponds to G or C, ‘H’ corresponds to A,U, or C, and ‘N’ corresponds to any nucleotide. (b) Representative flow cytometry data of the dMCP stabilization response to C-variant MS2 RNA (BFP-24xMS2(C)-pA, red), U-variant MS2 RNA (BFP-24xMS2(U)-pA, blue), or control BFP RNA (BFP-pA, gray). mScarlet-dMCP intensity is plotted over BFP intensity. (c) Median mNG-normalized mScarlet-dMCP intensities for the BFP positive population of cells in the experiment described in (e). Quantification performed by flow cytometry in HEK293FT cells co-transfected to express BFP mRNA containing C-variant MS2 stem loops (red circles), U-variant MS2 stem loops (blue circles) or no MS2 stem loops (gray circles) in combination with the dMCP reporter construct. Each point represents the median mNG-normalized mScarlet expression for independent transfections. Bars and error bars represent the mean and S.D of three independent transfections (n = 3). (d) Widefield fluorescence microscopy images of live U2OS cells transfected to express BFP-24xMS2(C)-pA or BFP-24xMS2(U)-pA with 4xmNG-dMCP. Images are single frames extracted from live recordings that were obtained using the same microscope settings.
Extended Data Fig. 9. Subcellular distribution of LSS-mCherry-KDEL-16xMS2 mRNA movements relative to distribution of LSS-mCherry-KDEL protein expression.
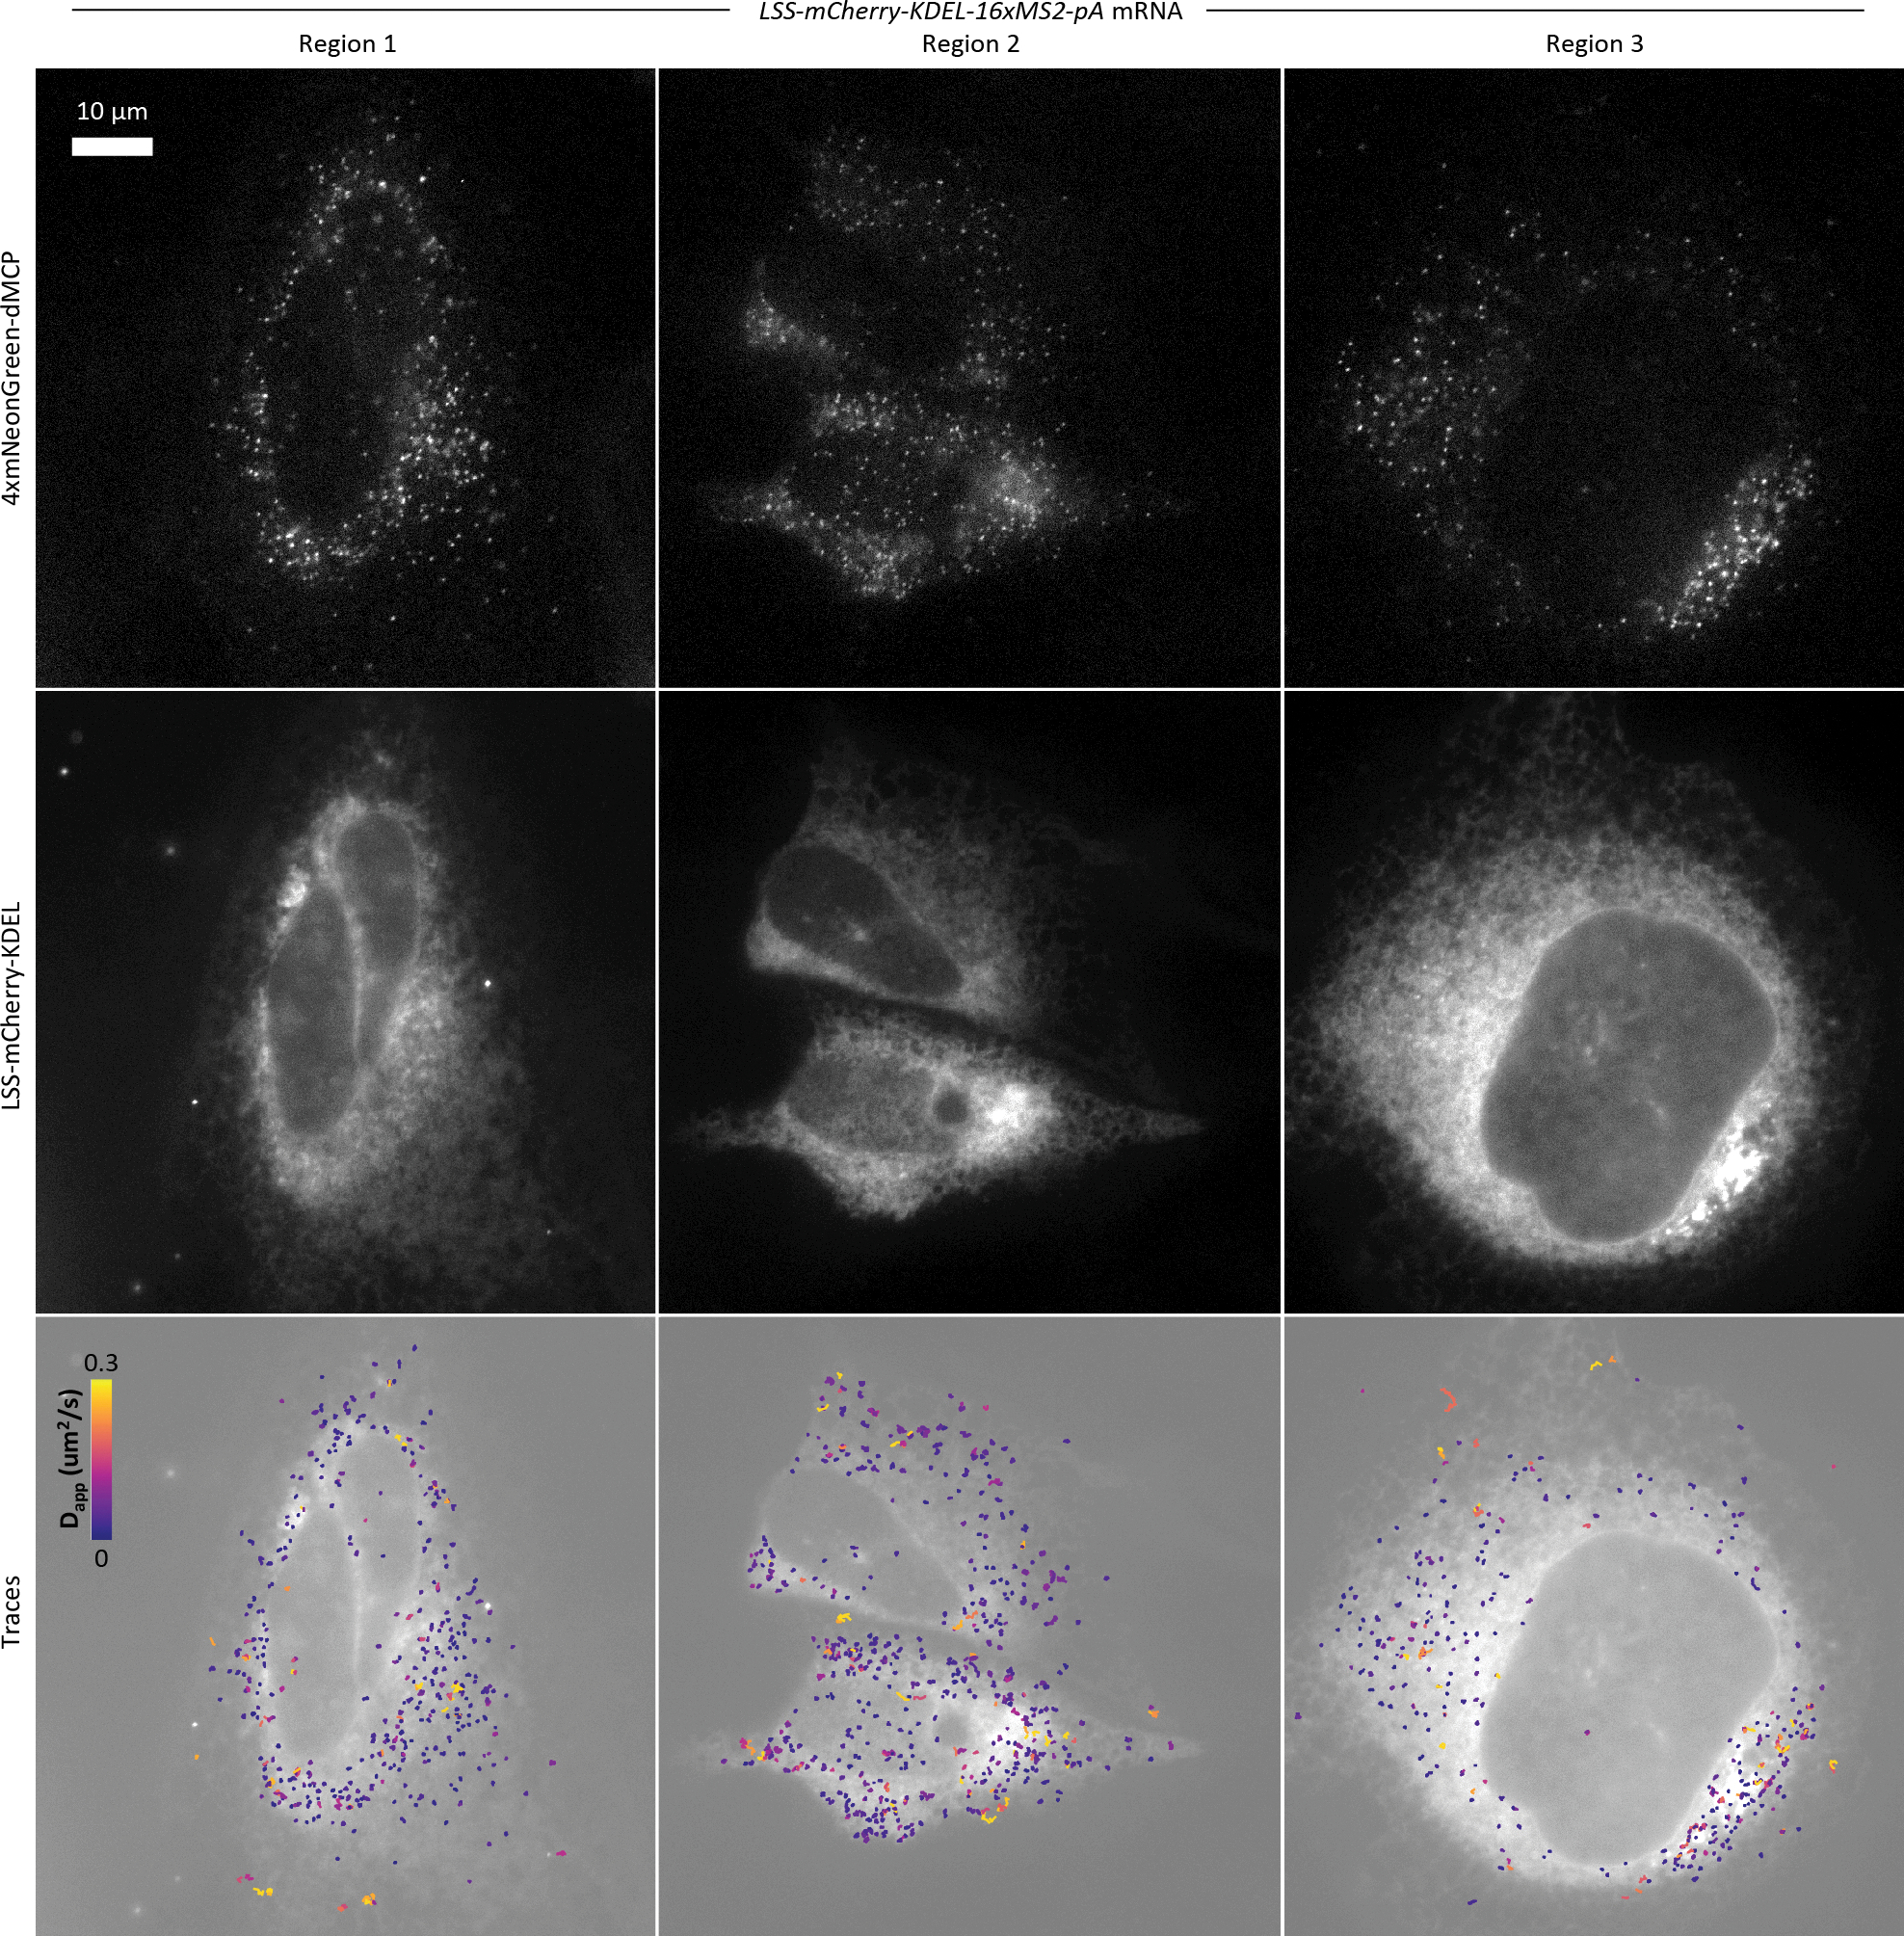
Data from three different regions of live U2OS cells expressing 4xmNG-dMCP and LSS-mCherry-KDEL-16xMS2-pA RNA. 4xmNG-dMCP signal is displayed in the top row and LSS-mCherry-KDEL signal is displayed in the middle row. The bottom row depicts RNA particle traces color-coded by apparent diffusion coefficient as previously described and overlaid on top of LSS-mCherry-KDEL signal. It can be seen that most dMCP-labeled RNA particles in these cells are static, and that they tend to accumulate in regions with higher LSS-mCherry-KDEL signal.
Extended Data Fig. 10. Subcellular distribution of TOM20-mCherry-16xMS2 mRNA movements relative to distribution of TOM20-mCherry protein expression.
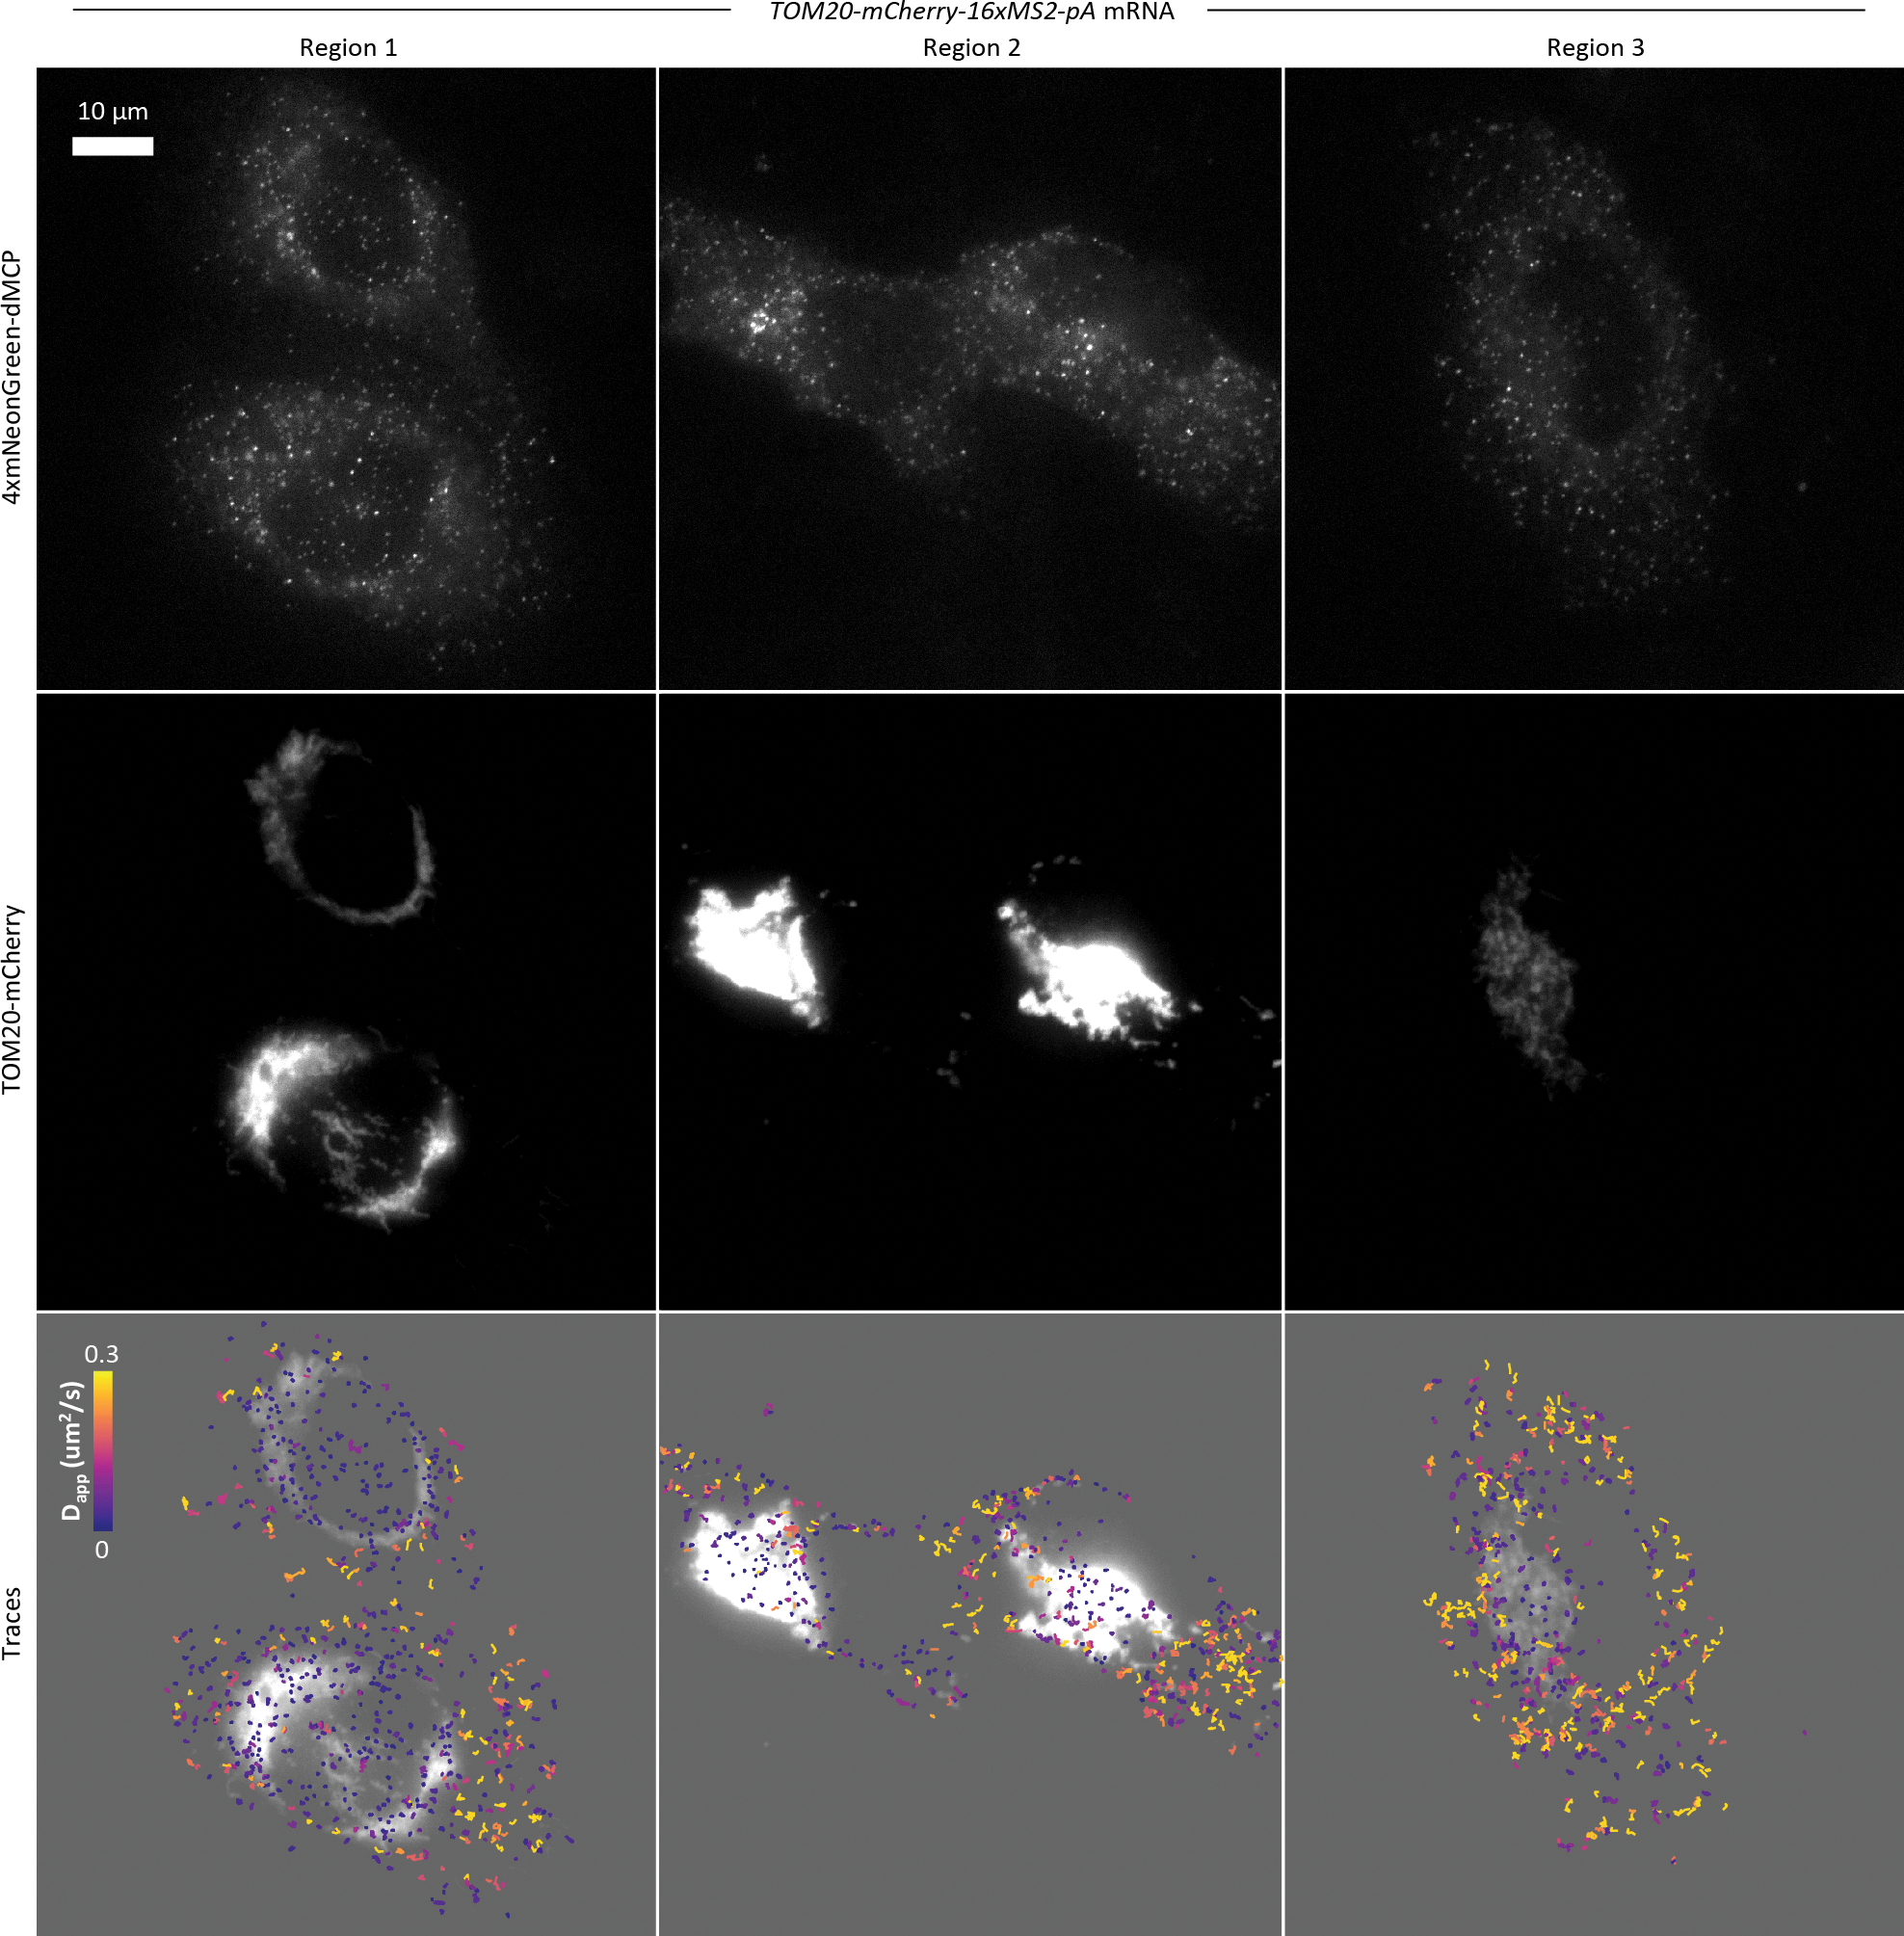
Data from three different regions of live U2OS cells expressing 4xmNG-dMCP and TOM20-mCherry-16xMS2-pA RNA. 4xmNG-dMCP signal is displayed in the top row and TOM20-mCherry signal is displayed in the middle row. The bottom row depicts RNA particle traces color-coded by apparent diffusion coefficient as previously described and overlaid on top of TOM20-mCherry signal. It can be seen that dMCP-labeled RNA particles in these cells are in visibly distinct static and moving populations, with static RNA tending to concentrate near regions of high TOM20-mCherry signal and moving RNA tending to be found in regions lacking this signal.
Supplementary Material
ACKNOWLEDGEMENTS
This work was funded by the National Institutes of Health (NIH) through National Institute of General Medical Sciences (NIGMS) research grant R35GM128859 (to J.T.N.). C.J.K. was supported through the Boston University training program in Quantitative Biology and Physiology (QBP, NIH grant T32GM008764) and a fellowship from the Multicellular Design Program (Boston University Kilachand Fund). A.M.M. was a recipient of a National Science Foundation Graduate Research Fellowship. The funders had no role in study design, data collection and analysis, decision to publish or preparation of the manuscript.
Footnotes
COMPETING INTEREST
The authors are co-inventors on a patent application filed by the Trustees of Boston University (U.S. Patent Application, 18/813,643).
REFERENCES
- 1.Das S, Vera M, Gandin V, Singer RH & Tutucci E Intracellular mRNA transport and localized translation. Nat. Rev. Mol. Cell Biol. 22, 483–504 (2021). [DOI] [PMC free article] [PubMed] [Google Scholar]
- 2.Bourke AM, Schwarz A & Schuman EM De-centralizing the Central Dogma: mRNA translation in space and time. Mol. Cell 83, 452–468 (2023). [DOI] [PubMed] [Google Scholar]
- 3.Lipp J, Dobberstein B & Haeuptle MT Signal recognition particle arrests elongation of nascent secretory and membrane proteins at multiple sites in a transient manner. J. Biol. Chem. 262, 1680–1684 (1987). [PubMed] [Google Scholar]
- 4.Lawrence JB & Singer RH Intracellular localization of messenger RNAs for cytoskeletal proteins. Cell 45, 407–415 (1986). [DOI] [PubMed] [Google Scholar]
- 5.Das S, Lituma PJ, Castillo PE & Singer RH Maintenance of a short-lived protein required for long-term memory involves cycles of transcription and local translation. Neuron 111, 2051–2064.e6 (2023). [DOI] [PMC free article] [PubMed] [Google Scholar]
- 6.Braselmann E, Rathbun C, Richards EM & Palmer AE Illuminating RNA Biology: Tools for Imaging RNA in Live Mammalian Cells. Cell Chem. Biol. 27, 891–903 (2020). [DOI] [PMC free article] [PubMed] [Google Scholar]
- 7.Bertrand E et al. Localization of ASH1 mRNA particles in living yeast. Mol. Cell 2, 437–445 (1998). [DOI] [PubMed] [Google Scholar]
- 8.Chao JA, Patskovsky Y, Almo SC & Singer RH Structural basis for the coevolution of a viral RNA-protein complex. Nat. Struct. Mol. Biol. 15, 103–105 (2008). [DOI] [PMC free article] [PubMed] [Google Scholar]
- 9.Hocine S, Raymond P, Zenklusen D, Chao JA & Singer RH Single-molecule analysis of gene expression using two-color RNA labeling in live yeast. Nat. Methods 10, 119–121 (2013). [DOI] [PMC free article] [PubMed] [Google Scholar]
- 10.Tantale K et al. A single-molecule view of transcription reveals convoys of RNA polymerases and multi-scale bursting. Nat. Commun. 7, 12248 (2016). [DOI] [PMC free article] [PubMed] [Google Scholar]
- 11.Hu Y et al. Enhanced single RNA imaging reveals dynamic gene expression in live animals. eLife 12, e82178 (2023). [DOI] [PMC free article] [PubMed] [Google Scholar]
- 12.Guo Y & Lee REC Long-term imaging of individual mRNA molecules in living cells. Cell Rep. Methods 2, 100226 (2022). [DOI] [PMC free article] [PubMed] [Google Scholar]
- 13.Js P, Ky W & Sr J RNA mimics of green fluorescent protein. Science 333, (2011). [DOI] [PMC free article] [PubMed] [Google Scholar]
- 14.Bühler B et al. Avidity-based bright and photostable light-up aptamers for single-molecule mRNA imaging. Nat. Chem. Biol. 19, 478–487 (2023). [DOI] [PubMed] [Google Scholar]
- 15.Jiang L et al. Large Stokes shift fluorescent RNAs for dual-emission fluorescence and bioluminescence imaging in live cells. Nat. Methods 20, 1563–1572 (2023). [DOI] [PubMed] [Google Scholar]
- 16.Wu B, Chen J & Singer RH Background free imaging of single mRNAs in live cells using split fluorescent proteins. Sci. Rep. 4, 3615 (2014). [DOI] [PMC free article] [PubMed] [Google Scholar]
- 17.Park SY, Moon HC & Park HY Live-cell imaging of single mRNA dynamics using split superfolder green fluorescent proteins with minimal background. RNA 26, 101–109 (2020). [DOI] [PMC free article] [PubMed] [Google Scholar]
- 18.Halbers LP et al. A modular platform for bioluminescent RNA tracking. Nat. Commun. 15, 9992 (2024). [DOI] [PMC free article] [PubMed] [Google Scholar]
- 19.Wu J et al. Live imaging of mRNA using RNA-stabilized fluorogenic proteins. Nat. Methods 16, 862–865 (2019). [DOI] [PMC free article] [PubMed] [Google Scholar]
- 20.Bonger KM, Chen L, Liu CW & Wandless TJ Small-molecule displacement of a cryptic degron causes conditional protein degradation. Nat. Chem. Biol. 7, 531–537 (2011). [DOI] [PMC free article] [PubMed] [Google Scholar]
- 21.Wu B, Chao JA & Singer RH Fluorescence Fluctuation Spectroscopy Enables Quantitative Imaging of Single mRNAs in Living Cells. Biophys. J. 102, 2936–2944 (2012). [DOI] [PMC free article] [PubMed] [Google Scholar]
- 22.Lin H-C et al. C-Terminal End-Directed Protein Elimination by CRL2 Ubiquitin Ligases. Mol. Cell 70, 602–613.e3 (2018). [DOI] [PMC free article] [PubMed] [Google Scholar]
- 23.Litke JL & Jaffrey SR Highly efficient expression of circular RNA aptamers in cells using autocatalytic transcripts. Nat. Biotechnol. 37, 667–675 (2019). [DOI] [PMC free article] [PubMed] [Google Scholar]
- 24.Merrill RA et al. A robust and economical pulse-chase protocol to measure the turnover of HaloTag fusion proteins. J. Biol. Chem. 294, 16164–16171 (2019). [DOI] [PMC free article] [PubMed] [Google Scholar]
- 25.Grimm JB et al. A General Method to Improve Fluorophores Using Deuterated Auxochromes. JACS Au 1, 690–696 (2021). [DOI] [PMC free article] [PubMed] [Google Scholar]
- 26.Choi HMT et al. Third-generation in situ hybridization chain reaction: multiplexed, quantitative, sensitive, versatile, robust. Dev. Camb. Engl. 145, dev165753 (2018). [DOI] [PMC free article] [PubMed] [Google Scholar]
- 27.Binns TC et al. Rational Design of Bioavailable Photosensitizers for Manipulation and Imaging of Biological Systems. Cell Chem. Biol. 27, 1063–1072.e7 (2020). [DOI] [PMC free article] [PubMed] [Google Scholar]
- 28.Matera AG, Terns RM & Terns MP Non-coding RNAs: lessons from the small nuclear and small nucleolar RNAs. Nat. Rev. Mol. Cell Biol. 8, 209–220 (2007). [DOI] [PubMed] [Google Scholar]
- 29.Bridges MC, Daulagala AC & Kourtidis A LNCcation: lncRNA localization and function. J. Cell Biol. 220, e202009045 (2021). [DOI] [PMC free article] [PubMed] [Google Scholar]
- 30.Boutz PL, Bhutkar A & Sharp PA Detained introns are a novel, widespread class of post-transcriptionally spliced introns. Genes Dev. 29, 63–80 (2015). [DOI] [PMC free article] [PubMed] [Google Scholar]
- 31.Mauger O, Lemoine F & Scheiffele P Targeted Intron Retention and Excision for Rapid Gene Regulation in Response to Neuronal Activity. Neuron 92, 1266–1278 (2016). [DOI] [PubMed] [Google Scholar]
- 32.Azam S et al. Nuclear retention element recruits U1 snRNP components to restrain spliced lncRNAs in the nucleus. RNA Biol. 16, 1001 (2019). [DOI] [PMC free article] [PubMed] [Google Scholar]
- 33.Hasenson SE et al. The Association of MEG3 lncRNA with Nuclear Speckles in Living Cells. Cells 11, 1942 (2022). [DOI] [PMC free article] [PubMed] [Google Scholar]
- 34.Ilik İA et al. SON and SRRM2 are essential for nuclear speckle formation. eLife 9, e60579 (2020). [DOI] [PMC free article] [PubMed] [Google Scholar]
- 35.Zhang Z et al. Fluorogenic CRISPR for genomic DNA imaging. Nat. Commun. 15, 934 (2024). [DOI] [PMC free article] [PubMed] [Google Scholar]
- 36.Tutucci E et al. An improved MS2 system for accurate reporting of the mRNA life cycle. Nat. Methods 15, 81–89 (2018). [DOI] [PMC free article] [PubMed] [Google Scholar]
- 37.Yan X, Hoek TA, Vale RD & Tanenbaum ME Dynamics of Translation of Single mRNA Molecules In Vivo. Cell 165, 976–989 (2016). [DOI] [PMC free article] [PubMed] [Google Scholar]
- 38.Koren I et al. The Eukaryotic Proteome Is Shaped by E3 Ubiquitin Ligases Targeting C-Terminal Degrons. Cell 173, 1622–1635.e14 (2018). [DOI] [PMC free article] [PubMed] [Google Scholar]
- 39.Saerens D et al. Identification of a Universal VHH Framework to Graft Non-canonical Antigen-binding Loops of Camel Single-domain Antibodies. J. Mol. Biol. 352, 597–607 (2005). [DOI] [PubMed] [Google Scholar]
- 40.Katz ZB et al. Mapping translation ‘hot-spots’ in live cells by tracking single molecules of mRNA and ribosomes. eLife 5, e10415. [DOI] [PMC free article] [PubMed] [Google Scholar]
- 41.Fusco D et al. Single mRNA Molecules Demonstrate Probabilistic Movement in Living Mammalian Cells. Curr. Biol. CB 13, 161–167 (2003). [DOI] [PMC free article] [PubMed] [Google Scholar]
- 42.Hulett JM et al. The transmembrane segment of Tom20 is recognized by Mim1 for docking to the mitochondrial TOM complex. J. Mol. Biol. 376, 694–704 (2008). [DOI] [PubMed] [Google Scholar]
- 43.Roberts B et al. Systematic gene tagging using CRISPR/Cas9 in human stem cells to illuminate cell organization. Mol. Biol. Cell 28, 2854–2874 (2017). [DOI] [PMC free article] [PubMed] [Google Scholar]
- 44.Ross AF, Oleynikov Y, Kislauskis EH, Taneja KL & Singer RH Characterization of a beta-actin mRNA zipcode-binding protein. Mol. Cell. Biol. 17, 2158–2165 (1997). [DOI] [PMC free article] [PubMed] [Google Scholar]
- 45.Song T et al. Specific interaction of KIF11 with ZBP1 regulates the transport of β-actin mRNA and cell motility. J. Cell Sci. 128, 1001–1010 (2015). [DOI] [PMC free article] [PubMed] [Google Scholar]
- 46.Latham VM, Kislauskis EH, Singer RH & Ross AF Beta-actin mRNA localization is regulated by signal transduction mechanisms. J. Cell Biol. 126, 1211–1219 (1994). [DOI] [PMC free article] [PubMed] [Google Scholar]
- 47.Lim F, Downey TP & Peabody DS Translational Repression and Specific RNA Binding by the Coat Protein of the Pseudomonas Phage PP7*. J. Biol. Chem. 276, 22507–22513 (2001). [DOI] [PubMed] [Google Scholar]
- 48.Pham TG, Ajayi O & Wu J Orthogonal RNA-regulated destabilization domains for three-color RNA imaging with minimal RNA perturbation. 2024.12.16.628815 Preprint at 10.1101/2024.12.16.628815 (2024). [DOI] [Google Scholar]
- 49.Zhou W-J et al. Fluorogenic Interacting Protein Stabilization for Orthogonal RNA Imaging. Angew. Chem. Int. Ed. n/a, e202502350. [DOI] [PubMed] [Google Scholar]
- 50.Kim MS et al. Degron-Based bioPROTACs for Controlling Signaling in CAR T Cells. ACS Synth. Biol. 13, 2313–2327 (2024). [DOI] [PMC free article] [PubMed] [Google Scholar]
- 51.Stevens LM et al. Light-dependent N-end rule-mediated disruption of protein function in Saccharomyces cerevisiae and Drosophila melanogaster. PLoS Genet. 17, e1009544 (2021). [DOI] [PMC free article] [PubMed] [Google Scholar]
- 52.Bonger KM, Rakhit R, Payumo AY, Chen JK & Wandless TJ General Method for Regulating Protein Stability with Light. ACS Chem. Biol. 9, 111–115 (2014). [DOI] [PMC free article] [PubMed] [Google Scholar]
- 53.Richman SA et al. Ligand-Induced Degradation of a CAR Permits Reversible Remote Control of CAR T Cell Activity In Vitro and In Vivo. Mol. Ther. 28, 1600–1613 (2020). [DOI] [PMC free article] [PubMed] [Google Scholar]
- 54.Ma H et al. CRISPR-Sirius: RNA scaffolds for signal amplification in genome imaging. Nat. Methods 15, 928–931 (2018). [DOI] [PMC free article] [PubMed] [Google Scholar]
- 55.Chen M et al. CRISPR/Pepper-tDeg: A Live Imaging System Enables Non-Repetitive Genomic Locus Analysis with One Single-Guide RNA. Adv. Sci. 11, 2402534 (2024). [DOI] [PMC free article] [PubMed] [Google Scholar]
- 56.Zhou W-J et al. Genetically Encoded Sensor Enables Endogenous RNA Imaging with Conformation-Switching Induced Fluorogenic Proteins. J. Am. Chem. Soc. 143, 14394–14401 (2021). [DOI] [PubMed] [Google Scholar]
- 57.Han S et al. RNA–protein interaction mapping via MS2- or Cas13-based APEX targeting. Proc. Natl. Acad. Sci. 117, 22068–22079 (2020). [DOI] [PMC free article] [PubMed] [Google Scholar]
- 58.Tsue AF et al. Multiomic characterization of RNA microenvironments by oligonucleotide-mediated proximity-interactome mapping. Nat. Methods 1–14 (2024) doi: 10.1038/s41592-024-02457-6. [DOI] [PMC free article] [PubMed] [Google Scholar]
- 59.Katrekar D et al. In vivo RNA editing of point mutations via RNA-guided adenosine deaminases. Nat. Methods 16, 239–242 (2019). [DOI] [PMC free article] [PubMed] [Google Scholar]
- 60.Katrekar D et al. Comprehensive interrogation of the ADAR2 deaminase domain for engineering enhanced RNA editing activity and specificity. eLife 11, e75555 (2022). [DOI] [PMC free article] [PubMed] [Google Scholar]
- 61.Gayet RV et al. Autocatalytic base editing for RNA-responsive translational control. Nat. Commun. 14, 1339 (2023). [DOI] [PMC free article] [PubMed] [Google Scholar]
- 62.Kaseniit KE et al. Modular, programmable RNA sensing using ADAR editing in living cells. Nat. Biotechnol. 41, 482–487 (2023). [DOI] [PMC free article] [PubMed] [Google Scholar]
- 63.Zhang X et al. Post-transcriptional modular synthetic receptors. Nat. Chem. Biol. 1–12 (2025) doi: 10.1038/s41589-025-01872-w. [DOI] [PMC free article] [PubMed] [Google Scholar]
- 64.Chen R et al. Enhancement of a prime editing system via optimal recruitment of the pioneer transcription factor P65. Nat. Commun. 14, 257 (2023). [DOI] [PMC free article] [PubMed] [Google Scholar]
- 65.Truong D-JJ et al. Exonuclease-enhanced prime editors. Nat. Methods 1–10 (2024) doi: 10.1038/s41592-023-02162-w. [DOI] [PMC free article] [PubMed] [Google Scholar]
- 66.Kwon N, Lee KE, Singh M & Kang SG Suitable primers for GAPDH reference gene amplification in quantitative RT-PCR analysis of human gene expression. Gene Rep. 24, 101272 (2021). [Google Scholar]
Associated Data
This section collects any data citations, data availability statements, or supplementary materials included in this article.
Supplementary Materials
Data Availability Statement
The datasets generated during and/or analyzed during the current study are available from the corresponding author upon reasonable request. Plasmid DNA and detailed sequence information for selected constructs are available through AddGene.