

Abstract
Microbialites accrete through microbe-environment interactions and incorporate elements like arsenic, creating enrichment patterns that can preserve evidence of ancient microbial activity. However, the effects of morphology, fabric, and accretion mechanism on arsenic incorporation in microbialites is poorly understood, complicating the use of arsenic enrichment patterns as a chemical biosignature. By analyzing arsenic concentrations in actively accreting microbialites with diverse architectures from Hamelin Pool, Australia, we document the effects of morphology, fabric, and accretion mechanism on arsenic enrichment patterns. Our results demonstrate that arsenic enrichment patterns originate from microbial activity, sedimentary inputs, and seawater chemistry, the proportions of which vary with changing aspects of microbialite morphogenesis. Here we show that initial microbialite architecture is a fundamental yet underexplored factor that controls the geochemical composition of microbialites through geological time.
Subject terms: Element cycles, Geochemistry, Sedimentology
Arsenic-rich globules are thought to be evidence of early microbial life. Here, the authors show how microbialite arsenic enrichment patterns vary with microbial activity and environmental conditions, reinforcing arsenic’s value as a biosignature.
Introduction
Dynamic interplay between microbial communities and early Earth environments shaped the evolution of major biogeochemical cycles and facilitated the habitability of our planet. Evidence of the interaction between life and environment exists in organosedimentary deposits formed by micrite precipitation and/or trapping and binding of sediments by microbial communities, called microbialites1. Morphological and textural variations in microbialites have been used to reconstruct microbe-environment interactions2–7, but less is known about how morphological and textural characteristics influence the incorporation and preservation of elemental enrichment patterns, and thus their utility as chemical biosignatures.
Metalloid enrichment patterns in microbialites, especially arsenic, have received recent attention8–14 because arsenic-rich, cell-like globules from the 2.7 Ga Tumbiana microbialites12 suggest they may be enduring geochemical proxies for early metabolisms15. Variable spatial correlations between arsenic and other micro-essential trace elements (i.e., Fe, Mn, Zn, Cu) led to the interpretation of arsenic enrichment as a chemical biosignature in both modern and ancient microbialites9–12. A key assumption is the existence of mechanistic links between arsenic enrichment patterns and biological activity irreplicable by physical or chemical processes alone16–18. Arsenic can be influenced by microbial communities through arsenotrophy, which involves arsenate (AsO₄³⁻) respiration and photosynthetic arsenite (AsO₃³⁻) oxidation9,10,12,14, and detoxification mechanisms13. Microbial arsenic cycling occurs in environments with both high and low arsenic concentrations, and the associated mats accrete microbialites with varying morphologies and textures9,10,13,14,19–22.
Microbial communities also influence the accretion of microbialites. Major aspects of microbialite morphogenesis can be defined at three scales of observation5 (“Microbialite Balancing Act”; Fig. 1), each of which may influence arsenic incorporation. Variations in the three-dimensional shape of microbialites at the meter-scale are described by microbialite morphology5,23,24 (Fig. 1 and Supplementary Fig. 6). At the centimeter scale, internal textures such as clotting or lamination produce microbialite fabrics that are visible in hand sample7,25–27 (Fig. 1 and Supplementary Fig. 7). Finally, changes in accretion mechanism drive microscopic variability in the proportion of micrite, organic matter, and agglutinated grains6,25–27 (Fig. 1 and Supplementary Fig. 8). Microbialite morphogenesis has changed over geological time in response to changes in microbial community composition, the evolution of new metabolic pathways, and environmental changes2,3,5–7,24,28. Since microbialite morphogenesis influences the production, sequence, and arrangement of organic matter, micrite, and agglutinated grains5, morphogenetic processes likely control the incorporation rate and partitioning of arsenic and other trace elements, but such effects have yet to be investigated.
Fig. 1. Characteristics of initial architectures of microbialites from Hamelin Pool.
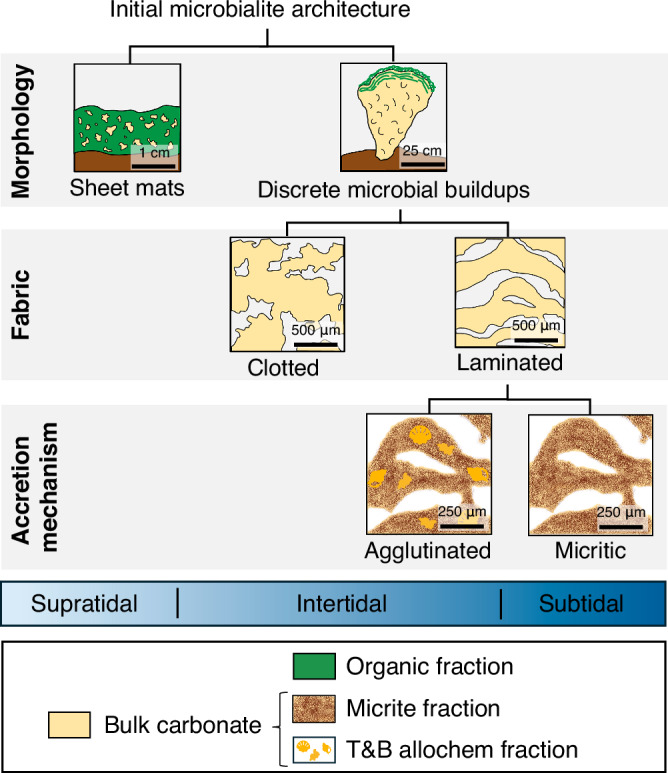
Initial architectures are defined by three key aspects of morphogenesis: morphology, fabric, and accretion mechanism. These aspects of morphogenesis vary across tidal zones (supratidal, intertidal, and subtidal) in response to water depth. Morphologies include sheet mats and discrete microbial buildups, fabrics have clotted and laminated textures, and accretion mechanisms involve agglutination and/or micrite precipitation. Field photographs, slab images, and thin sections illustrating variations in morphology, fabric, and accretion mechanism observed in the Hamelin Pool microbialites are provided in Supplementary Figs 6, 7, and 8, respectively. All microbialites from Hamelin Pool are composed of three main geochemical fractions: organic matter, micrite, and trapped-and-bound allochem grains (T&B allochems). A fourth geochemical fraction is siliciclastic grains (Supplementary Fig. 5), which were intentionally not digested in our sequential leaching protocol and thus excluded from this diagram.
To examine how microbialite morphology, fabric, and accretion mechanism affect the incorporation and partitioning of arsenic in microbialites, we examined a well-constrained, modern microbialite depositional system in Hamelin Pool, Shark Bay, Western Australia. Hamelin Pool is an ideal study system because it hosts a diversity of microbialite architectures5,25–27,29–34 (Fig. 1). Morphologies range from unlithified sheet mats to lithified buildups that are accreted by microbial communities29–31,33,34, some of which engage in arsenic-related metabolic processes19–22. Microbialite fabrics exhibit both laminated and clotted textures5,25,26,29 (Fig. 1), and both agglutinated and micritic accretion mechanisms have been observed25–27 (Fig. 1).
Here, we demonstrate the important influence of microbialite morphogenesis on arsenic enrichment patterns in Hamelin Pool microbialites. Integrating elemental analyses of microbialites, sediment, seawater, and groundwater samples, we show that morphology, fabric, and accretion mechanism predictably correspond to changes in arsenic enrichment patterns in organic matter and micrite. Some enrichment patterns originate from variations in seawater chemistry, while others require the involvement of microbial activity. Thus, microbialite morphogenesis is a fundamental factor to consider when interpreting the significance of elemental enrichment patterns in ancient and modern microbialites.
Results and discussion
Microbialites from Hamelin Pool consist of three major geochemical components, the proportions of which vary in different microbialite types: (1) an organic matter fraction, (2) bulk carbonate —including micrite and carbonate allochems— and (3) a 0.35 M HNO₃ acid-insoluble siliciclastic fraction (Figs. 2, 3, and 5). Microbialite components were leached quantitatively and independently (see Supplementary Methods), enabling measurements of both absolute arsenic concentration and the size of each compositional fraction (e.g., micrite, trapped-and-bound allochems, or organic matter), where size refers to the relative mass contribution of each fraction to the total sample mass. A mixing model was used to subdivide bulk carbonate into micrite and trapped-and-bound carbonate allochems fractions. Of the four fractions present, organic matter and micrite are produced by the accreting mat, while carbonate allochems and siliciclastic grains are trapped and bound during accretion. The bulk carbonate is comprised of ~95% aragonite, 4% high-magnesium calcite (HMC), and 1% low-magnesium calcite (LMC), while the siliciclastic fraction is primarily composed of quartz (see Supplementary Discussion), likely sourced from the Peron Sandstone on the western coast of Hamelin Pool35. Because siliciclastic-associated arsenic does not originate from microbial activity or modern seawater chemistry, it was excluded from further consideration.
Fig. 2. Differences in mass fractions and arsenic concentrations between sheet mats and discrete microbial buildups in Hamelin Pool.

A Mass fractions (wt%) of micrite, trapped-and-bound (T&B) allochems, siliciclastic fractions, and organic matter in sheet mats (n = 5) vs. discrete microbial buildups (DMB, n = 42) from Hamelin Pool. Significant differences were observed for micrite (Welch’s t-test, t(37.59) = −9.225, p < 0.001) and organic matter (Student’s t-test, t(45) = 16.471, p < 0.001); no significant differences were found for trapped-and-bound allochems (Student’s t-test, t(45) = 0.943, p = 0.351) or siliciclastics (Mann–Whitney U-test; W = 82, p = 0.275). Error bars represent standard deviations. The detailed distribution of mass fraction data for sheet mats is shown in Supplementary Fig. 9. Arsenic concentrations (mg/kg) in micrite (B), trapped-and-bound (T&B) allochems (C), and organic matter (D) compared between sheet mats (n = 5) and discrete buildups (n = 42). Significant differences were found for micrite (W = 134, p = 0.037) and organic matter (W = 144, p = 0.016), but not for trapped-and-bound allochems (W = 78.5, p = 0.406) (Mann–Whitney U-tests). Box plots display the median (center line), the 25th and 75th percentiles (box limits), whiskers extending to 1.5 times the interquartile range, and the mean (x- mark); points beyond the whiskers represent outliers. Asterisks (*) denote statistically significant differences (p < 0.05); absence of a symbol indicates no significant difference.
Fig. 3. Differences in mass fractions and arsenic concentrations between discrete microbial buildups with clotted and laminated fabrics in Hamelin Pool.

A Mass fractions (wt%) of micrite, trapped-and-bound (T&B) allochems, siliciclastic fractions, and organic matter in clotted (n = 15) vs. laminated microbialites (n = 27) from Hamelin Pool. No significant differences were observed between fabric types for micrite (Mann–Whitney U-test, W = 196, p = 0.553), trapped-and-bound allochems (Mann–Whitney U-test, W = 157, p = 0.613), siliciclastic material (Mann–Whitney U-test, W = 158, p = 0.633), or organic matter (Student’s t-test, t(40) = −1.000, p = 0.324). Error bars represent standard deviations. Arsenic concentrations (mg/kg) in micrite (B), trapped-and-bound (T&B) allochems (C), and organic matter (D) compared between clotted (n = 15) and laminated microbialites (n = 27). Micrite from laminated fabrics has more arsenic than clotted fabrics (Student’s t-test, t(40) = −3.120, p = 0.003). Trapped-and-bound allochems from laminated fabrics have lower arsenic concentrations than clotted fabrics (Mann–Whitney U-test, W = 275.5, p = 0.030). No differences were observed for organic matter between fabric types (Mann–Whitney U-test, W = 253, p = 0.192). Box plots display the median (center line), the 25th and 75th percentiles (box limits), whiskers extending to 1.5 times the interquartile range, and the mean (x-mark). Asterisks (*) denote statistically significant differences (p < 0.05); absence of a symbol indicates no significant difference.
Fig. 5. Differences in mass fractions and arsenic concentrations between agglutinated and micritic discrete microbial buildups in Hamelin Pool.

A Mass fractions (wt%) of organic matter, micrite, trapped-and-bound (T&B) allochems, and siliciclastic fractions in agglutinated (n = 22) vs. micritic microbialites (n = 20) from Hamelin Pool. Significant differences were observed for micrite (Student’s t-test, t(40) = −2.670, p = 0.011), trapped-and-bound allochem (Student’s t-test; t(40) = −2.470, p = 0.018), and siliciclastic fractions (Welch’s t-test, t(31.65) = 3.074, p = 0.004); no significant difference was found for organic matter (Student’s t-test; t(40) = −1.773, p = 0.084). Error bars represent standard deviations. Arsenic concentrations (mg/kg) in micrite (B), trapped-and-bound (T&B) allochems (C), and organic matter (D) compared between agglutinated (n = 22) and micritic microbialites (n = 20). No significant differences were found for micrite (Student’s t-test, t(40) = 0.672, p = 0.506), trapped-and-bound allochems (Mann–Whitney U-test, W = 195.5, p = 0.715), or organic matter (Mann–Whitney U-test, W = 293, p = 0.068). Box plots display the median (center line), the 25th and 75th percentiles (box limits), whiskers extending to 1.5 times the interquartile range, and the mean (x-mark). Asterisks (*) denote statistically significant differences (p < 0.05); absence of a symbol indicates no significant difference.
In the following, we examine the size and arsenic concentrations of the organic matter, micrite, and trapped-and-bound allochem fractions in microbialites with different morphologies, fabrics, and accretion mechanisms (Figs. 2–5). We explore how microbial activity, agglutination, and seawater chemistry interact to produce unique arsenic enrichment patterns (Figs. 6–8; Table 1). Finally, we evaluate the utility of these patterns as chemical biosignatures in modern sedimentary environments and consider their preservation potential in the geological record (Fig. 9).
Fig. 6. Average contributions of microbial micrite and sedimentary allochems to bulk carbonate arsenic concentrations.

Values are shown as percentages for A micritic microbialites (n = 20) and B agglutinated microbialites (n = 22). Contributions were determined by normalizing arsenic concentrations of microbial micrite and individual allochems to their respective mass fractions within each microbialite. Error values are standard deviations.
Fig. 8. Relationship between average arsenic concentrations in microbialite micrite and seawater across provinces of Hamelin Pool.

A Laminated microbialites and sheet mats: yellow triangles show average arsenic concentrations in micrite from laminated discrete microbial buildups (DMB) collected from Carbla (n = 3), Nanga (n = 8), Flagpole South (n = 5), Flagpole North (n = 5), Booldah (n = 3), and Spaven (n = 3) provinces; the pink circle shows average arsenic concentrations measured in sheet mats collected from supratidal zones in the Nilemah province (n = 3). B Clotted microbialites: red squares show average arsenic concentrations in clotted discrete microbial buildups (DMB) from Hutchison (n = 2), Nanga (n = 2), Flagpole South (n = 6), and Flagpole North (n = 4) provinces. Error bars indicate standard deviations. Provinces were defined in a previous study32 and are shown in Fig. 7. Blue lines illustrate the predicted arsenic concentration in micrite as a function of seawater arsenic concentration when arsenic incorporation is primarily inorganic (Eq. 2), with the slope corresponding to EFinorg. Green line shows the predicted arsenic concentration in micrite as a function of seawater arsenic concentration, when arsenic is incorporated from both seawater (Eq. 2) and transfer from organic matter (Eq. 3). Shaded areas are 95% confidence intervals. Lower sub-panels show the expected contributions (%) from seawater (blue) and organic matter degradation (green) as a function of seawater arsenic concentrations.
Table 1.
Arsenic concentrations in Hamelin Pool sedimentary allochems
| Micritic grains (n = 3) | Foraminifera (n = 3) | Coated grains (n = 3) | Gastropods (n = 3) | Bivalves (n = 3) | Others (n = 3) | |
|---|---|---|---|---|---|---|
| Average (mg/kg) | 2.8 | 1.1 | 0.9 | 0.6 | 0.4 | 0.9 |
| Standard deviation (mg/kg) | 0.2 | 0.1 | 0.1 | 0.1 | 0.1 | 0.1 |
Fig. 9. Conceptual model of arsenic enrichment mechanisms and preservation potential across microbialite architectures from Hamelin Pool.

Each column highlights a microbialite architecture in Hamelin Pool (see Fig. 1). In each row, the left panel illustrates the microbialite architecture, including the distribution and proportion of organic matter, micrite, and trapped-and-bound (T&B) allochems, while the right panel presents the arsenic concentrations associated with each of these fractions. The first row illustrates the conditions at the time of accretion, highlighting each microbialite architecture’s morphology, fabric, and accretion mechanisms, along with their associated arsenic enrichment patterns. The second row shows arsenic enrichment patterns, including the proportions and concentrations of arsenic-bearing fractions. Black arrows are enrichment factors (EF) that describe arsenic transfer from seawater to the different fractions. Red arrows represent the transfer of arsenic from organic matter to micrite. The third row depicts the expected preservation potential of arsenic enrichment patterns in the geological record.
Control of microbialite morphology on arsenic incorporation
Microbialite morphology influences the size of the organic matter and micrite fractions, but not the allochem and siliciclastic fractions (Fig. 2A). Sheet mats contained ~5.6× more organic matter (21.3 ± 3.4 wt%) than discrete microbial buildups (3.7 ± 1.6 wt%; Fig. 2A) and less micrite (45.3 ± 1.6 wt% vs. 71.9 ± 17.0 wt%; Fig. 2A). Consequently, the proportion of organic matter should be expected to have a greater influence on overall arsenic enrichment patterns in sheet mats compared to discrete microbial buildups (Fig. 9). The mass of the allochem fraction did not differ between sheet mats and discrete microbial buildups (Fig. 2A), suggesting that this fraction contributes equally to arsenic enrichment patterns in these microbialite morphologies. High organic matter production in sheet mats could be related to differences in environmental settings. Sheet mats dominate the supratidal zone29,31,33,34 (Fig. 1), where high evaporation rates increase osmotic stress19, stimulating the production of extracellular polymeric substances (EPS) that offer protection against environmental stressors33,36. Thick EPS layers bind Ca²⁺ and inhibit carbonate precipitation37,38, resulting in low micrite abundance. In contrast, discrete microbial buildups form in intertidal and subtidal zones25,26,29,31–34 (Fig. 1), where lower environmental stress allows faster EPS consumption by heterotrophic microbial communities19, promoting the release of Ca²⁺ from EPS, enhanced micrite precipitation39, and a larger proportion of micrite (Fig. 2A).
Microbialite morphology also affects arsenic concentrations in organic matter and micrite. Arsenic concentrations were higher in sheet mats than in discrete microbial buildups, both in micrite (2.3 ± 1.3 mg/kg vs. 1.0 ± 0.6 mg/kg; Fig. 2B) and organic matter (10.2 ± 1.9 mg/kg vs. 5.3 ± 3.8 mg/kg; Fig. 2D). Environmental conditions unique to each morphology may be explanatory: Sheet mats form in supratidal zones31,33 (Fig. 1), where evaporation increases seawater arsenic concentrations19 and reduces rates of sulfate reduction and methanogenesis40. Arsenic-related metabolisms are necessary adaptations in these settings. More arsenic-related genes occur in sheet mats that facilitate energy production in localized anoxic niches, while others encode for detoxification19,20,22. Negatively charged EPS can immobilize arsenic in alkaline conditions41,42 like in Hamelin Pool43 (pH ~ 8.1). Arsenic is thus accumulated in higher concentrations in organic matter and micrite produced by sheet mats that form in challenging environmental conditions. When the mat disaggregates, micritic grains can be released to the environment26,27,31,33, providing an arsenic-rich allochem supply that can be trapped by other microbialites. No significant difference in arsenic concentration was observed in the allochem fraction of different microbialite morphologies (Fig. 2C), suggesting that sediment compositions are relatively consistent in the supratidal and inter/subtidal zones, where sheet mats and discrete microbial buildups occur (Fig. 1).
Control of microbialite fabric on arsenic incorporation
Changes in microbialite fabric do not influence the relative sizes of geochemical fractions. Microbialites with clotted and laminated fabrics exhibit no differences in the proportion of organic matter, micrite, or the allochem and siliciclastic fractions (Fig. 3A). Clotted and laminated fabrics accrete primarily by micrite precipitation25,26 and thus have abundant micrite and relatively low organic matter content (Figs. 3A and 9). Variations in micrite arrangement have been linked to light availability in different tidal zones25,29 (Fig. 1). Laminated fabrics form in lower intertidal and subtidal zones with lower light (Fig. 1), prompting smaller Entophysalis colonies to align in layers that become micritic laminae25. In contrast, clotted fabrics form in higher-light upper intertidal settings (Fig. 1), where larger Entophysalis colonies form clusters resulting in clots25. Although variation in colony arrangement alters the fabric, it does not change the overall proportions of micrite, organic matter, allochems, or siliciclastic grains (Fig. 3A).
Arsenic concentrations in organic matter, micrite and allochem fractions in clotted and laminated fabrics exhibited unique trends. The arsenic concentration of organic matter from clotted and laminated microbialites was identical (Fig. 3D), while more arsenic was observed in micrite from laminated fabrics (1.1 ± 0.4 mg/kg) compared to clotted fabrics (0.7 ± 0.4 mg/kg; Fig. 3B). In contrast, higher arsenic concentrations were measured in the allochem fraction trapped and bound by microbialites with clotted fabrics (1.9 ± 0.5 mg/kg) compared to those with laminated fabrics (1.3 ± 0.8 mg/kg; Fig. 3C). These results suggest that the composition of the sedimentary environment differs between the upper intertidal zone, where clotted microbialites occur, and the lower intertidal/subtidal zones, where laminated microbialites are found (Fig. 1).
The relationship between arsenic concentrations in organic matter and micrite varied between fabrics (Fig. 4). Laminated fabrics exhibited a positive correlation between arsenic in organic matter and micrite (Fig. 4A), suggesting that the amount of arsenic incorporated into the micrite of laminated microbialites depends on the arsenic accumulated in the co-occurring organic matter (Eq. 1):
| 1 |
Fig. 4. Cross plot of arsenic concentrations in micrite and organic matter from laminated and clotted microbialites.

A Laminated microbialites (n = 27, black triangles) show a significant positive correlation (Pearson regression, r = 0.612, p < 0.001); the black line represents the line of best fit, and the shaded area denotes the 95% confidence interval. B Clotted microbialites (n = 15, white squares) show no significant relationship (Pearson regression, r = 0.063, p = 0.830).
In contrast, clotted microbialites exhibited no correlation between arsenic content in the organic matter and micrite (Fig. 4B). Therefore, there is no evidence that organic matter arsenic concentrations influence the amount of arsenic in the micrite produced in clotted fabrics.
Differences in arsenic concentrations between organic matter and micrite in laminated and clotted microbialites are likely influenced by distinct community metabolisms. Laminated fabrics are accreted by mats in which energy production is driven by sulfate reduction19. In deep, anoxic layers of the mat, sulfate reduction generates bicarbonate, raising local pH and promoting carbonate precipitation44–47, while arsenic cycling associated with sulfur-based metabolic pathways14 enhances arsenic accumulation in organic matter9,10,48. The spatial overlap between arsenic-related metabolic activities and locus of micrite precipitation in laminated microbialites facilitates the transfer of arsenic from organic matter to micrite (Fig. 4A). The slope of the regression in Fig. 4A describes this transfer rate, suggesting that 12% of organic matter-associated arsenic is incorporated into micrite forming laminated fabrics (Fig. 4A; Eq. 1). Conversely, micrite in clotted fabrics is accreted by mats dominated by photosynthetic genes19,25, which increase alkalinity and promote carbonate precipitation in oxygenated microenvironments near the mat surface44,45. The spatial decoupling of micrite precipitation near the mat surface and arsenic-related microbial activities occurring in deeper anoxic niches results in no correlation between the arsenic content of organic matter and micrite in clotted fabrics (Fig. 4B).
Control of accretion mechanism on arsenic incorporation
Accretion mechanism influences arsenic incorporation by altering the relative proportions of the micrite and trapped-and-bound fractions, leaving the size of the organic matter fraction unchanged (Fig. 5A). Agglutinated microbialites contained less micrite (65.3 ± 18.4 wt%) and more trapped-and-bound material, including allochems (17.1 ± 9.8 wt%) and siliciclastic minerals (14.3 ± 9.2 wt%) than micritic microbialites (Fig. 5A), consistent with petrographic descriptions25,26. Higher abundances of trapped-and-bound grains means that sedimentary allochems, some of which have high arsenic concentrations (Table 1), exert a stronger influence on the total arsenic concentration of agglutinated microbialites. In contrast, micritic microbialites are dominated by micrite (78.8 ± 12.4 wt%) and contain lower proportions of trapped-and-bound grains (Fig. 5A). Variations in accretion mechanism in Hamelin Pool have been proposed to be related to changes in the sediment supply across tidal zones (Fig. 1), which influence the proportions of micrite and carbonate allochems in the accreting microbialite, and thus the pathways of arsenic incorporation25–27,29–32.
Variations in accretion mechanism do not impact the arsenic content of micrite and organic matter fractions in Hamelin Pool’s microbialites. Micrite arsenic concentrations were similar in agglutinated (1.0 ± 0.5 mg/kg) and micritic microbialites (0.9 ± 0.4 mg/kg; Fig. 5B), as were arsenic concentrations in organic matter (6.5 ± 4.3 mg/kg and 4.0 ± 2.7 mg/kg, respectively; Fig. 5D). No influence of accretion mechanism on arsenic concentrations in micrite and organic matter contrasts with the trends produced by variation in morphology and fabric (Figs. 2B, D and 3B, D), which were linked to changes in the metabolic profiles of the mats19. By contrast, nearly identical metabolic profiles of mats producing agglutinated and micritic microbialites19 indicate that similar processes likely govern organic matter and micrite production.
The trapped-and-bound carbonate allochem fraction of agglutinated and micritic microbialites exhibited similar arsenic concentrations (1.5 ± 0.8 mg/kg and 1.7 ± 0.7 mg/kg, respectively; Fig. 5C), reflecting the non-selective nature of the trapping and binding process6. The concentration of arsenic in the trapped-and-bound allochem fraction is controlled by the sediment arsenic content, which varied across provinces (see Supplementary Table 4), reaching a maximum in Nilemah (2.3 ± 0.2 mg/kg), and a minimum in Carbla (1.6 ± 0.3 mg/kg). Variations in bulk sediment arsenic concentrations reflect changes in the abundance of micritic grains, coated grains, bivalves, foraminifera, and gastropods, which are influenced by ecological niche requirements, transport, and redeposition29–34. Arsenic concentrations of sedimentary allochems ranged from 0.4 ± 0.1 mg/kg (Fragum erugatum) to 2.8 ± 0.2 mg/kg (micritic grains; Table 1). Due to their high abundance31,33 and elevated arsenic concentrations, micritic grains are the dominant source of arsenic in the trapped-and-bound fraction throughout the basin, contributing 78.2 ± 16.8% of bulk sediment arsenic concentrations (see Supplementary Table 4; Fig. 6). Foraminifera contribute a smaller proportion (12.2 ± 12.1%), and other allochems collectively account for <10% (Table 1).
Our results indicate that microbialites with different accretion mechanisms can exhibit similar overall arsenic concentrations (Fig. 5B–D) but the mechanisms driving arsenic enrichment patterns differ (Fig. 6). In micritic fabrics, 80.6 ± 16.2% of the arsenic in the bulk carbonate is associated with micrite (Fig. 6A), indicating that arsenic enrichment patterns are driven primarily by differences in arsenic transfer efficiency from organic matter to micrite (Fig. 4A). In contrast, an average of 32.0 ± 24.1 % of total arsenic is associated with trapped-and-bound allochems in agglutinated microbialites, though this contribution varies widely across the basin (1–85%). Consequently, arsenic concentrations in agglutinated microbialites are more influenced by the quantity and type of allochems that are trapped and bound (Fig. 6B) compared to micritic microbialites. Given that micritic grains eroded from sheet mats are the most arsenic-enriched and the most abundant allochems (Table 1), they play a crucial role in arsenic enrichment patterns in agglutinated microbialites (Fig. 6B), occasionally surpassing micrite precipitated by the accreting mat as the dominant source of arsenic.
Origin of arsenic enrichment patterns across microbialite architectures
Morphology, fabric, and accretion mechanism each affect arsenic incorporation by influencing the size and arsenic content of the organic matter, micrite, and trapped-and-bound allochem fractions in microbialites. Variations in these aspects of morphogenesis produce distinct arsenic enrichment patterns within the microbialite architectures of Hamelin Pool (Figs. 2, 3, 4, 5, 6). Like the “Microbialite Balancing Act”, in which interplay between environment and microbes determines the initial microbialite architecture5, similar dynamics drive the development of arsenic enrichment patterns. The extent to which these patterns can be interpreted as chemical biosignatures depends on their likelihood of forming through biotic versus abiotic mechanisms16–18. Thus, interpreting the origin of arsenic enrichment patterns requires the quantification of all mechanisms contributing to arsenic incorporation in each microbialite architecture. Spatiotemporal variations in seawater arsenic concentration can modulate baseline arsenic incorporation, whether driven by biotic or abiotic processes13,49. In Hamelin Pool, seawater arsenic concentrations increased from 3.9 ± 0.2 µg/kg in the northern provinces to 6.9 ± 0.2 µg/kg in the southernmost Nilemah Province (Fig. 7; Student’s t-test, t(5) = -6.777, p < 0.001). In the following, we evaluate the degree to which arsenic enrichment patterns in the microbialite architectures of Hamelin Pool are influenced by microbial and environmental processes (Fig. 8) and assess the utility of these arsenic enrichment patterns as chemical biosignatures in the rock record (Fig. 9).
Fig. 7. Spatial interpolation of seawater arsenic concentrations in Hamelin Pool.
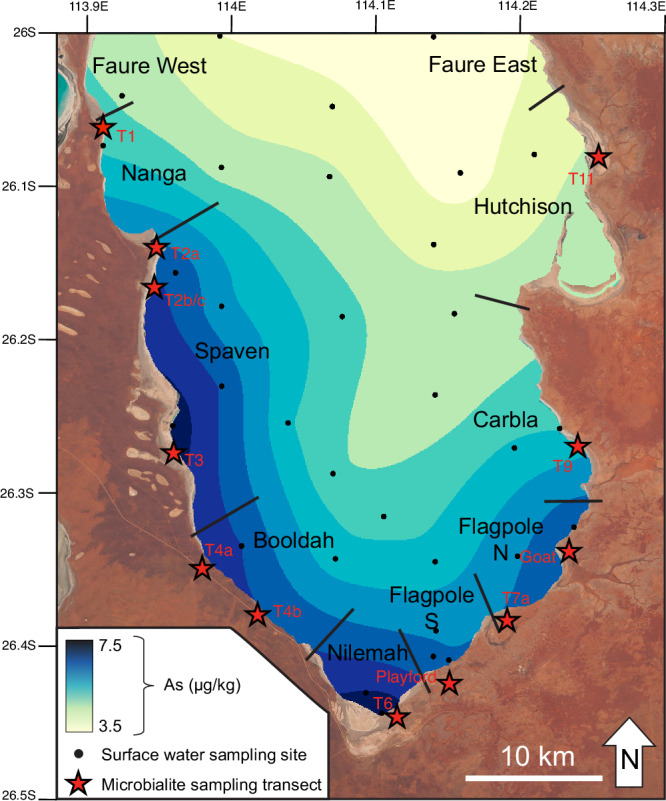
Concentrations are shown in µg/kg. Black circles represent seawater sampling locations; red stars denote the shoreline position of microbialite sampling transects (coordinates listed in Supplementary Table 3). Black lines represent boundaries of provinces in Hamelin Pool as previously defined32. The map is overlaid on Copernicus Sentinel data (2025) accessed via Copernicus Browser (CC BY 4.0).
Datasets presented here (Eq. 1, Fig. 4A) provide an opportunity to examine how environmental and microbial processes contribute to arsenic enrichment patterns in micrite precipitated by microbial mats in variable environmental conditions (Fig. 8). Carbonate minerals can incorporate arsenic from seawater without microbial influence through surface adsorption or carbonate group substitution50 (CO₃²⁻↔HAsO₃³⁻). At equilibrium, this abiotic incorporation of arsenic can be described by a distribution coefficient, previously estimated for calcite to be 490 L/kg for arsenate and <0.23 L/kg for arsenite50. Similar incorporation mechanisms likely apply to aragonite51, but the absence of known partition coefficients limits estimates of arsenic incorporation from seawater in the aragonitic micrite of Hamelin Pool microbialites. Without arsenic transfer from organic matter ([As]org = 0; Eq. 1), micrite in laminated microbialites is predicted to contain 0.79 ± 0.18 mg As/kg. We propose that this estimate approximates inorganic arsenic incorporation from seawater into aragonitic micrite in Hamelin Pool. Normalizing this value to the average arsenic concentration in Hamelin Pool seawater (Fig. 7) yields an “inorganic” enrichment factor (EFinorg) of 120 ± 38 L/kg (or 1.13 ± 0.29 normalized to the sum of Ca and Mg concentrations in the aragonite and seawater), aligning with the range of expected partition coefficients for calcite described above. Although not a true partition coefficient because microbial activity is responsible for the formation of the micrite incorporating the arsenic25,27,29,33, the EFinorg provides an initial point of reference. The amount of arsenic incorporated into the micrite from seawater, with minimal microbial influence, is expected to increase linearly with rising arsenic concentrations in seawater (Eq. 2; Fig. 8, blue line):
| 2 |
Equation 1 also describes the contribution of microbial processes to arsenic incorporation. The first term of the equation suggests that ~12% of arsenic incorporated into organic matter is transferred to micrite in laminated discrete microbial buildups (Fig. 4A). This contribution of arsenic from organic matter to micrite, isolated in Eq. 3, depends on organic matter arsenic concentrations, which vary across Hamelin Pool provinces (Kruskal–Wallis test; H(6) = 9.744, p = 0.045) and correlate exponentially with seawater arsenic concentrations (Pearson correlation after linearization; r = 0.789, p = 0.035; Supplementary Fig. 10).
| 3 |
The transfer of arsenic from organic matter to micrite in laminated fabrics (Eq. 3; Supplementary Fig. 10) supplements the inorganic incorporation of arsenic from seawater with minimal microbial influence (Eq. 2; Fig. 8, blue line). The total arsenic concentrations incorporated into micrite through this combined input are expected to increase exponentially as seawater arsenic concentrations rise (Fig. 8A, green line).
Mixed origins for arsenic enrichment patterns in laminated buildups
Arsenic enrichment patterns in micrite from laminated fabrics originate from a combination of organic matter degradation and seawater, with contributions from both sources modulated by seawater arsenic concentrations (Fig. 9). This interpretation is evidenced by the average micrite arsenic concentrations in laminated buildups collected across six provinces, which exhibit an exponential relationship with seawater arsenic concentrations (Fig. 8A; yellow triangles; Pearson regression after linearization; r = 0.879, p = 0.021). Laminated micrite arsenic enrichment factors (EF) consistently surpass the baseline for inorganic arsenic incorporation (EFinorg), with notable regional variability (ANOVA; F(5,16) = 3.052, p = 0.043). EF increases southward, from 1.5 ± 0.5 at Nanga to 2.1 ± 0.2 at Flagpole North, reflecting a gradual increase in the rate of arsenic input from organic matter degradation. Arsenic from organic matter degradation accounts for ~42% of arsenic incorporated in micrite in relatively arsenic-poor northern provinces, and up to ~54% in the arsenic-rich southern provinces (Fig. 8A). The contribution of arsenic from organic matter degradation is never negligible in laminated fabrics, and arsenic concentrations consistently exceed what inorganic incorporation alone can explain, thereby satisfying the criteria for a chemical biosignature16,17 (Fig. 9).
Arsenic enrichment patterns in the micrite of laminated microbial buildups beyond Hamelin Pool likely originate from a similar combination of organic and inorganic contributions. We make this interpretation because laminated buildups are known to be constructed by mats dominated by microbial communities with heterotrophic metabolisms46,47. Heterotrophic metabolisms are required to transfer arsenic from organic matter into micrite (Fig. 4A). Actively accreting laminated microbial buildups from Laguna Diamante (Argentina) provide evidence in support of this interpretation, because heterotrophic degradation in deeper layers of the mat was interpreted to facilitate arsenic incorporation into micrite10. Our data also suggest that the arsenic-rich lake water conceivably increases micrite arsenic concentrations (Eq. 2), suggesting that both inorganic and organic processes likely influence arsenic concentrations in micrite from microbialites in Laguna Diamante. Thus, such a dual origin of arsenic may be applicable to laminated microbial buildups more broadly.
The transfer of arsenic from organic matter to micrite in laminated microbialites contributes to enhanced preservation of arsenic enrichment patterns in the rock record12, but the dual origin of arsenic sources to laminated fabrics complicates interpretations. This challenge is pronounced in the absence of original seawater compositions or preserved organic matter, which were essential measurements needed to disentangle arsenic sources in microbialites from Hamelin Pool (Fig. 8A). However, with rising concentrations of seawater arsenic, our data show that rates of arsenic transfer from the organic matter to the micrite (Eq. 3; Fig. 8A and Supplementary Fig. 10) increase faster than rates of arsenic incorporation from seawater (Eq. 2; Fig. 8A, blue line). Therefore, since Precambrian seawater likely contained higher arsenic15, transfer of arsenic from degrading organic matter to micrite likely outpaced arsenic incorporation from seawater in older microbialites. This scenario is supported by prominent arsenic enrichments in carbonaceous globules present in the Tumbiana formation, which were interpreted to be micritized cells12. Study of arsenic enrichment patterns may help define the origins of controversial laminated structures in the Isua Supracrustal Belt52 and the Strelley Pool Formation4,53. A practical approach would involve comparison of arsenic concentrations in laminated carbonates with suspected biological origin to those from coeval sediments. In Hamelin Pool, laminated micrite in microbialites consistently exhibits higher arsenic concentrations than coeval non-microbial sediments (Fig. 9). Additionally, spatial localization of arsenic enrichments along laminae or within micritized cells11,12, could further support biological mediation of arsenic incorporation.
Sheet mat arsenic enrichment patterns originate from organic matter
Arsenic concentrations in sheet mat micrite originate both from organic matter degradation and seawater (Fig. 8A), suggesting that micrite in sheet mats forms via similar processes to those in laminated buildups. Similar micrite-to-organic matter arsenic concentration ratios in sheet mats (3.6 ± 1.1) and laminated buildups (3.4 ± 2.4; Mann–Whitney U-test, W = 28, p = 0.648) suggest that arsenic transfer occurs at comparable rates. However, because sheet mats form in arsenic-enriched supratidal zones5,31,33,34, they accumulate more arsenic in the organic matter (Figs. 2D and 3D), likely arising from the increased prevalence of genes encoding arsenic cycling and resistance19. Correspondingly, micrite arsenic concentrations in sheet mats are consistently high (Fig. 8A), with an average EF of 3.6 ± 1.2, exceeding the inorganic baseline (EFinorg). Arsenic concentrations in sheet mat micrite are 2.4 ± 1.2× higher than in laminated discrete microbial buildups (Figs. 2B and 3B). Notably, heterotrophic transfer accounts for 71% of total arsenic in sheet mat micrite, surpassing both seawater contributions (29%; Fig. 8A) and heterotrophic transfer in laminated buildups (42–54%; Fig. 8A). Consequently, arsenic enrichment patterns in sheet mat micrite are consistent with the definition of a robust chemical biosignature, because microbial activity induces the conditions for enhanced arsenic incorporation superseding inorganic processes alone16,17 (Fig. 9). Although our analysis reveals consistent trends, the five sheet mats specimens examined here may not encompass the full environmental heterogeneity of Hamelin Pool, and future studies with broader sampling will be essential to evaluate the robustness of this interpretation.
Beyond Hamelin Pool, unlithified or weakly lithified microbialites often contain strong arsenic enrichment in the micrite, a characteristic previously linked to microbial activity9,10,13,14. High evaporation and high concentrations of toxic metals characteristic of the supratidal zone can select for this type of microbialite morphology via the enhancement of organic matter production, which accumulates arsenic. Based on our results, sheet mats should be expected to have higher arsenic enrichment patterns than co-occurring discrete microbial buildups (Fig. 9), with more arsenic originating from the degradation of organic matter (71%) than from seawater (29%). The origin of arsenic enrichment patterns in sheet mat micrite are thus easier to determine because the arsenic concentration of the micrite in these microbialites exhibits a higher dependency on the degradation of arsenic-rich organic matter (Fig. 8A).
The geological preservation potential of the morphological characteristics of sheet mats is generally low since the organic matter is rapidly decomposed5,11,33. With decomposition, micritic components of sheet mats are reworked29–31,33 (Fig. 9), potentially accumulating into extensive sedimentary deposits without conventional morphological biosignatures that indicate their microbial origin54,55. Thus, high arsenic enrichment in micritic grains provides evidence for past microbial activity that confirms the origins of the micrite and may be interpreted as a chemical biosignature (Fig. 9). Notably, exceptions to poor preservation exist when early silicification has protected organic residues, as observed in ancient mats from the Pilbara Craton56 (Australia) and the Barberton Greenstone Belt57,58 (South Africa). Such early silicification may enhance the preservation of trace metal enrichments in organic matter, and comparison of arsenic concentrations between putative mineralized mats and surrounding sediments could help confirm their biogenicity.
Clotted buildups record seawater arsenic concentrations
Arsenic enrichment patterns in clotted discrete microbial buildups in Hamelin Pool appear to be controlled by seawater chemistry, indicating they may serve as a useful proxy for reconstructing environmental conditions. Measured EF values of clotted microbialite micrite are 1.1 ± 0.6, which is indistinguishable from EFinorg, suggesting that clotted micrite arsenic enrichment patterns originate from seawater (Fig. 8B). Further, micrite associated with clotted fabrics has 1.7 ± 1.2× less arsenic than that associated with laminated fabrics (Fig. 3B). However, the relationship between micrite arsenic concentrations and seawater from clotted microbialite samples collected from four provinces varied (Fig. 8B). Samples from Nanga and Hutchison provinces overlap the 95% confidence intervals for predicted values based on seawater arsenic concentrations, but the regression overestimates values for samples from Flagpole North and underestimate values for samples from Flagpole South (Fig. 8B). Compared to trends in laminated microbialites, this variability suggests that seawater arsenic concentrations in these settings may be more temporally variable than captured in our dataset (Fig. 7). Changing contributions of arsenic-rich groundwater may be responsible (see Supplementary Discussion), but such trends are beyond the scope of this study. Since estimates of EFinorg are sufficient to explain arsenic enrichment patterns in clotted fabrics, it is unlikely that microbial activity is required to incorporate arsenic in these microbialites.
Outside of Hamelin Pool, carbonate precipitation in microbialites with clotted fabrics has been attributed to both phototrophic and heterotrophic metabolisms59–61. Modern microbialites with clotted fabrics from Laguna La Brava, Chile, similarly lack arsenic enrichments in micrite, despite significant arsenic accumulation in organic matter9. Low arsenic concentrations of micrite should be expected in phototrophic mats because while phototrophy is known to enhance micrite precipitation19,45, our results indicate no arsenic transfer from organic matter into carbonate in clotted fabrics (Fig. 4B). The geological preservation potential of clotted microbialites is high because early micritization provides structural stability and enhances structure lithification1,3,5,62. Arsenic enrichment patterns in clotted buildups likely hold limited value as chemical biosignatures but may provide an indication of environmental arsenic concentrations. Reconstructions could be attempted using the proposed EFinorg for aragonite, or the partition coefficient for calcite50. Well-preserved ancient examples, such as the 2.4 Ga Turee Creek Group thrombolites63 (Australia), offer promising sites to test this model because four distinct clotted fabrics were interpreted to form under varying paleoenvironmental conditions, which may have influenced arsenic enrichment patterns.
Agglutinated microbialites contain intrinsic and extrinsic biosignatures
Arsenic enrichment patterns in agglutinated microbialites largely arise from the composition of the trapped-and-bound allochems (Table 1; Fig. 9). Micrite produced by agglutinated mats has a higher EF (1.5 ± 0.7, n = 22) than Fragum erugatum bivalves (0.6 ± 0.1, n = 3; Welch’s t-test, t(20.7) = 4.934, p < 0.001) and gastropods (0.9 ± 0.1, n = 3, Welch’s t-test; t(19.9) = 3.195, p = 0.005). Both calcifiers regulate trace element uptake, often excluding toxic elements like arsenic64,65. In contrast, foraminiferal tests have EF (1.6 ± 0.2, n = 3) comparable to micrite (Welch’s t-test; t(16.5) = −0.961, p = 0.350), because they are deposit-feeding benthic species that ingest arsenic-rich organic detritus and clay66. Micritic grains, produced by sheet mats33, have higher EF (5.4 ± 0.2, n = 3) than micrite formed by mats producing agglutinated microbialites (Student’s t-test; t(23) = −9.042, p < 0.001; Fig. 2B). Our results show that each allochem in Hamelin Pool has a unique EF, which can be lower, similar to, or higher than those in the micrite precipitated by the mat accreting agglutinated buildups. Therefore, trapped-and-bound allochems may attenuate, mimic, or amplify the EF generated by the accreting mat. Notably, the high EF of trapped-and-bound micritic grains could be easily misinterpreted as a product of the activity of the microbial mat that accreted the ancient agglutinated microbialites, if such trends go undetected.
Our results demonstrate the need for careful sedimentological description of samples before geochemical analysis and interpretation of EF. Outside Hamelin Pool, modern agglutinated microbialites incorporate grains of variable origins reflecting local sedimentary environments6,27. For instance, Bahamian microbialites predominantly trap and bind ooids5,67 which are also influenced by microbial activity68, and thus have the potential to impart an EF that is distinct from the micrite produced by the accreting mat. Ancient agglutinated microbialites often co-occur with micritic grains54,55, like in Hamelin Pool32,34,35, creating scenarios where trapped-and-bound allochems could mask or mimic arsenic enrichment patterns associated with micrite formed by the accreting mat (Fig. 9). The composition of allochems also varies through geologic time: Phanerozoic microbialites commonly incorporate skeletal grains such as bivalves, foraminifera, and other bioclasts, whereas Precambrian microbialites lack such components due to the absence of carbonate-producing metazoans3,6. Temporal changes in allochem composition likely affect arsenic enrichment patterns in microbialites accreted at different periods. Careful petrographic analysis, sequential leaching experiments, and mixing models integrating measurements of microbialites and sediments are critical for disentangling the contributions of micrite and allochems. By doing so, well-preserved agglutinated microbialites can serve as geochemical archives for both microbial processes and sedimentary influences (Fig. 9).
Implications for the interpretation of ancient microbialites
Our findings demonstrate that arsenic enrichment patterns provide a geochemical tool for evaluating the biogenicity of ancient carbonate deposits. Most notably, we observe systematic variability in arsenic enrichment patterns among distinct microbialite architectures accreting in the same depositional environment. Attributing such structured geochemical variability to abiotic processes would require multiple finely-tuned geochemical regimes operating independently yet synchronously. In contrast, spatial diversity in microbial communities readily accounts for these patterns. This is particularly relevant for the interpretation of ancient microbialite-bearing successions, which commonly preserve a range of morphologies, fabrics, and accretion mechanisms4,57,63,69. Detecting shifts in arsenic enrichment patterns that correlate with changes in microbialite morphogenesis, such as across the seven distinct stromatolite facies of the Strelley Pool Formation4, may provide strong evidence that these transitions of microbialite architectures reflect biological, rather than abiotic, processes.
Interpreting arsenic enrichment patterns in ancient microbialites requires careful consideration of post-depositional processes that are capable of modifying the original geochemical signatures. Diagenetic alteration such as cementation, dissolution, and recrystallization may redistribute arsenic, potentially changing the original enrichment patterns, as observed for other redox-sensitive elements (see review by Swart70). Identifying signs of diagenetic overprinting, including changing textures, syntaxial cements, or coupled variations in redox-sensitive elements, should be carefully assessed through combined petrographic and geochemical screening. In metamorphosed settings, substantial caution is warranted, since original trace element patterns can be obliterated52. Despite these challenges, pristine examples confirm the possibility for long-term preservation. In the Tumbiana Formation (2.7 Ga), arsenic-rich carbonaceous globules interpreted as micritized microbial cells suggest retention of arsenic enrichment patterns during early diagenetic alteration12. Likewise, Chraiki et al.69 reported not only arsenic enrichment, but also contrasting arsenic distributions across stromatolites and thrombolites in the Ediacaran Anti-Atlas (571 Ma), demonstrating that deep time architecture-specific biosignatures can persist in the geological record (Fig. 9).
In conclusion, three fundamental aspects of microbialite morphogenesis—morphology, fabric, and accretion mechanism—control arsenic incorporation into actively accreting microbialites from Hamelin Pool. Microbialite morphology is influenced by environmental conditions, which can select for genes involved in arsenic cycling and resistance, causing substantial differences in arsenic enrichment between sheet mats and discrete microbial buildups. Microbialite fabric is a product of the metabolic pathways driving micrite precipitation. The transfer of arsenic from organic matter to micrite is governed by the predominance of heterotrophic metabolisms, a factor which distinguishes arsenic enrichment patterns in clotted versus laminated microbialites. Microbialite accretion mechanism impacts the proportions of micrite and trapped-and-bound allochems comprising microbialites, altering the sources of arsenic incorporated in agglutinated and micritic microbialites. In concert, our results show that arsenic enrichment patterns are not created equally in different types of microbialites. Each microbialite architecture is influenced to a different extent by microbial processes, sedimentary inputs, and seawater chemistry, each of which can change through space and time, resulting in the diversity of microbialite deposits observed in the geological record. With the process-based understanding of arsenic incorporation produced here, our results allow for comparison of the origin of arsenic enrichment patterns across microbialite architectures. Sheet mats can be studied to reconstruct microbial activity, clotted microbialites to infer seawater arsenic concentrations, laminated fabrics provide information about the metabolic profile of the mat, and agglutinated fabrics can be used to characterize sedimentary inputs. Leveraging the unique origins of arsenic enrichment patterns in different microbialite architectures enables a more continuous reconstruction of dynamic interactions between life and the environment that have induced microbialite accretion over billions of years of Earth history.
Methods
Sample selection
This study investigated 47 previously collected microbialite samples from 12 transects distributed around the coastline of Hamelin Pool in Shark Bay, Western Australia (Fig. 7 and Supplementary Table 3). The complete dataset, including field metadata, high-resolution slab photographs, and thin section images for each microbialite buildup is publicly available71. Sheet mat samples (n = 5) were collected from the Spaven, Nilemah, and Hutchison provinces, near sampling sites T2b, T6, and T11, respectively (Fig. 7 and Supplementary Fig. 6A). Discrete microbial buildups (n = 42) were sampled along each of the 12 transects, with 2–5 microbialites collected per transect across a range of water depths corresponding to distinct tidal zones (Figs. 1, 7 and Supplementary Fig. 6; see Suosaari et al.71 for field sampling metadata). In the laboratory, each microbialite buildup was cut in half (Supplementary Fig. 7), and thin sections were prepared (Supplementary Fig. 8; see Suosaari et al.71 for repository of slab images, thin section locations, and high-resolution scans of each thin section). On this basis, the internal texture of each sheet mat and buildup was investigated from meso- to nanoscale using petrographic analysis (Supplementary Fig. 8) and SEM imaging, with descriptions of morphology, fabrics, and accretion mechanisms provided in previously published studies5,25,26,31–33. The present sampling strategy builds on these prior publications by sampling the same microbialites and integrating their published fabric descriptions25,26,33. Microbialite architectures sampled include sheet mats (n = 5) and discrete microbial buildups (n = 42), which were further subdivided into laminated (n = 27) and clotted (n = 15) fabrics, as well as micritic (n = 20) and agglutinated (n = 22) microbialites. A low-speed hand drill was used to remove the surface layer of the microbialite slab, and ~100 mg of material was collected from each sampling location. Equivalent quantities of 12 bulk sediment samples were collected from each microbialite transect in Hamelin Pool. Individual sedimentary allochems, including micritic grains, foraminifera, gastropods, bivalves (Fragum erugatum), and ooids were also handpicked to create triplicate 25 mg samples for each allochem. All microbialite, sediment, and allochem samples were manually homogenized using an agate mortar and pestle.
Sample digestion and analysis
Approximately 100 mg of powdered samples (microbialite and sediment) were weighed into 5 mL Eppendorf tubes for sequential leaching in an ISO Level 7 clean room equipped with a Class 100 UL 1805 certified polypropylene trace metal workstation. The protocol employed here (see Supplementary Methods) was conducted in seven individual steps. In summary, a two-step leaching of the organic fraction was first conducted using H₂O₂, designated as steps H1 and H2, followed by leaching of the adsorbed fraction (N1) with ammonium acetate, and finally, a four-step leaching of the bulk carbonate phase (S1, S2, S3, and S4) using nitric acid. The leaching of the organic fraction was conducted using 5 mL of pH-buffered 1.49 M distilled H2O2 (VWR, USA). To neutralize the H2O2 acidity and prevent leaching of carbonate phases, 0.10 M NaOH (EMD, Germany) was added at a ~1:14 ratio with the H2O2 to maintain a pH of ~8, verified before each reaction using standard pH strips. Subsequently, the samples were treated with 1.5 mL of 0.23 M ammonium acetate (Aldrich, USA) to remove easily exchanged ions adsorbed on the surface of clay minerals or Fe-Mn oxides (adsorbed fraction). Subsequently, the bulk carbonate phase was leached using 0.35 M distilled nitric acid (Savillex Acid Purification System, DST-1000), with the volume calibrated to leach ~25% of the sample’s carbonate content in each step. The effectiveness of the sequential leaching protocol in selectively leaching only the targeted phase, without contamination from other phases, was monitored throughout the process (see Supplementary Methods). All procedural and reagent blanks assessed (n = 6) were confirmed to have arsenic, calcium, and magnesium concentrations beneath the methodological limit of detection.
After introducing a reagent at each step, samples were vortexed and ultrasonicated at room temperature (30, 15, and 60 min for the organic fraction, adsorbed fraction, and bulk carbonate phase, respectively). Following reaction completion, samples were centrifuged at 4500 × g for 30 min, and the supernatant was transferred to 5 mL Eppendorf tubes. The residual material was dried uncapped overnight at 60 °C on a metal-free hotplate (HPX-200, Savillex, USA) in the trace metal workstation. After evaporating to dryness, the mass of the residue was measured to quantify the mass loss, allowing elemental concentrations to be reported as absolute values. Before each reagent change, samples were rinsed with Milli-Q water (Milli-Q IQ 7003, Millipore Sigma, USA). Finally, all supernatants were evaporated, resuspended in 0.16 M HNO3 and transferred to 15 mL centrifuge tubes for elemental analysis.
In parallel, the individual sedimentary allochems, including triplicates of micritic grains, foraminifera, bivalves (Fragum erugatum), gastropods, and coated grains, were subjected to a bulk digestion process, during which 25 mg of the material was treated with 0.79 M HNO3 for an hour at room temperature in an ultrasonic bath. The resulting solution was then transferred into 15 mL centrifuge tubes and diluted to 0.16 M HNO3 for elemental analysis.
Arsenic, calcium, and magnesium concentrations were determined using triple quadrupole inductively coupled plasma mass spectrometry (Agilent 8900 ICP-QQQ, Agilent, Santa Clara, CA). The first organic leachate (H1) and the second carbonate leachate (S2) were selected for analysis because they were considered the most representative of the organic fraction and bulk carbonate phase, respectively (see Supplementary Methods). For arsenic measurements, the instrument was operated in MS/MS mode using O2 gas in the collision-reaction cell (CRC) and analyzed the O2 mass-shifted analyte in the third quadrupole at mass 91. For calcium and magnesium measurements, the instrument was operated in MS/MS mode using H2 gas in the CRC and analyzed at masses 40 and 24, respectively. Multiple digestions of certified reference materials (CRMs)—IAEA-413, IAEA-392, IAEA-V8, DOLT-5 for organic leachates, and NCS-DC-73340, FEBS-1, BHVO-2, and AGV-2 for carbonate leachates—were used for method validation and accuracy estimates in repeat analyses conducted during each analytical batch. Average recoveries for each CRM were >90% of the certified values for arsenic, calcium, and magnesium. Further details on analytical methods and CRM recovery can be found in the Supplementary Methods. The arsenic concentrations of the adsorbed fraction (leachate N1) in the analyzed running solution were, on average, 10 times lower than those in the organic and carbonate leachates. Due to these lower concentrations, the adsorbed fraction was excluded from further analyses.
Sea water analysis
Open water samples (n = 32) were collected in the Hamelin Pool basin in November 2017 (Fig. 7). Salinity of each sample was determined using a refractometer and arsenic concentrations were determined using a modification of the Standard Addition Calibration method13,72. A 50 µg/L arsenic spike solution was prepared from a NIST-traceable Spex Certiprep solution 2A (USA) diluted in 0.16 M HNO3. The certified seawater reference material, CASS-6, which naturally contains 0.1 µg/L of arsenic, was diluted proportional to its salinity in 0.16 M ultra-trace HNO3. Afterward, the spike solution was added to aliquots of the diluted CASS-6 to produce a series of seven solutions containing a range of 0.1–1.8 µg/L arsenic. All samples were analyzed on an Agilent 8900 ICP-QQQ, with identical analytical settings and quality control standards as the microbialite and sediment samples (See Supplementary Methods). The regression of counts versus expected concentrations for arsenic showed a strong linear relationship (R2 = 0.999). The x-axis intercept, along with its standard error, was used to estimate the arsenic concentration in the unspiked CASS-6 solution, yielding a recovery of 94 ± 4%. Counts from each water sample were then converted to arsenic concentrations using this calibration equation. The concentrations of Ca and Mg in the seawater were determined using a 10-point external calibration curve, similar to the approach used for the organic and carbonate leachates from the microbialites (see Supplementary Methods). Multiple replicates of each CRM (IAPSO) were analyzed with each batch of samples, and the recovery percentages were 97 ± 2% and 96 ± 1% for calcium and magnesium, respectively. A map of arsenic concentrations in the surface waters of Hamelin Pool was generated in ArcGIS Pro (version 3.1.3, Esri Inc., USA) using the Kriging interpolation model (Fig. 7).
Mineralogy
Mineralogy was determined using a PANalytical X’pert PRO X-ray Diffractometer (PANalytical Inc, Almelo, The Netherlands). Samples were powdered using a mortar and pestle, hydrated with MilliQ water, and spread onto a glass slide. Smear slides were allowed to air dry overnight before analysis. To measure the relative abundance of carbonate polymorphs, samples were scanned between 23° and 32° 2Ɵ, using a step interval of 0.01° and a count time of 1 s for each step. The relative concentrations of aragonite, HMC, LMC (and dolomite, if present) were calculated using the model of Melim et al.73, which calculates carbonate mineral concentrations based on peak area ratios assuming the sample only contains HMC, LMC, aragonite, and dolomite. Thus, the presence of other minerals, such as quartz or detrital clays, are excluded when calculating the proportion of carbonate minerals in the sample. Based on prior repeat measurements, the standard error of the analysis is ~3%74. Sixteen samples were also scanned from 4 to 70° 2Ɵ to identify the presence of mineral phases other than carbonates. The obtained diffractograms were processed using HighScorePlus software (version 3.0.5, PANalytical, The Netherlands), which facilitated background subtraction and identification of the main reflection peaks. The positions of the 2Ɵ peaks were compared with those listed in the PDF-2 2003 database (ICDD) to identify mineral phases present in the samples.
Mass balance
Mass balance calculations were conducted to determine the relative size of the micrite and trapped-and-bound allochem fractions within the microbialite samples. During the sequential leaching protocol, the carbonate leaching steps extracted the bulk carbonate phase of the microbialites, which encompasses two distinct fractions: the micrite produced by microbes within the accreting mat, and the trapped-and-bound carbonate allochems (Eq. 4).
| 4 |
where, denotes the mass fractions of the bulk carbonate phase in the microbialites, including both the micrite fraction , and the trapped-and-bound allochem fraction .
When microbialites incorporate trapped-and-bound carbonate allochems, they also incorporate siliciclastic grains in a ratio similar to that of the surrounding sediment. This occurs because microbialites do not differentiate between carbonate allochems and siliciclastic grains during the trapping and binding process6. This relationship can be expressed as:
| 5 |
Here, represents the mass fraction of allochems in the sediment. Unlike microbialites, in which carbonate leachates include both micrite and allochems, the carbonate leachate extracted from the sediments consists solely of allochems. Therefore, is equivalent to the mass loss measured during the carbonate leaching step of the sediment sample. and denote the mass fractions of siliciclastic grains in the microbialite and sediment samples, respectively. These values correspond to the mass of unleached residue remaining at the end of the leaching protocol. Using these information, Eq. 5 can be rewritten to derive the allochem mass fraction within the microbialites:
| 6 |
By using this relationship and deriving Eq. 4, the micrite mass fraction within the microbialites can also be determined:
| 7 |
Mixing model
Based on the mass balance calculations, a mixing model was implemented to estimate the arsenic concentrations in the micrite fraction and the trapped-and-bound allochem fraction that together comprise the bulk carbonate phase extracted during the sequential leaching protocol. The arsenic concentrations of the bulk carbonate phase correspond to the combined contributions of the micrite and the trapped-and-bound allochem fractions, expressed as:
| 8 |
Here represents the arsenic concentration in the bulk carbonate phase, which corresponds to the arsenic concentration measured in the carbonate leachate obtained during the sequential leaching experiment. and denote the arsenic concentration in the micrite and allochem fraction of the microbialites, respectively.
Since microbialites were assumed to not differentiate between grain types when trapping and binding sediments, the arsenic concentration of allochems trapped and bound in the microbialite should be equivalent to that of allochems isolated from sediment samples surrounding the microbialite. Starting from this assumption and by deriving Eq. 8, it is thus possible to calculate the arsenic concentration in the micrite fraction comprising the microbialites:
| 9 |
The concentrations of calcium and magnesium in the micrite of the microbialites were calculated using the same procedure, based on the measured concentrations of these elements in the bulk carbonate of the microbialites and the sediment.
Statistical analysis
Statistical analyses were performed using R (R Core Team, 2025). Prior to conducting group comparisons, we assessed the assumptions of normality and homogeneity of variances. Normality within each group was tested using the Shapiro–Wilk test, with a p > 0.05 indicating no significant deviation from a normal distribution. Homogeneity of variances across groups was evaluated using Levene’s test, where a p > 0.05 indicated equal variances among groups. Based on these assumptions, we selected appropriate statistical methods for pairwise comparisons. When both normality and homogeneity of variances were met, we applied a Student’s t-test. If normality was satisfied but variances were unequal, we used Welch’s t-test. If either group deviated from normality, we applied the Mann–Whitney U test (Wilcoxon rank-sum test) as a non-parametric alternative. For comparisons involving more than two groups, a one-way ANOVA was used when all assumptions were met, whereas the Kruskal–Wallis test was used when normality was violated in one or more groups. All statistical tests were two-tailed, and results were considered statistically significant at p < 0.05.
To determine correlation between X and Y when individual measurements for each pair of X and Y corresponded to one sample, we used the “correlation_test” function in R to calculate the correlation coefficient (r). In instances where X and Y were provided as averages with known standard deviations, we conducted a weighted linear regression analysis75. This analysis, performed using the modified “lm()” function in R, provided estimates for the correlation coefficients r. To facilitate correlation analysis of exponential relationships, we employed a linearization technique76. After linearizing the variables, we conducted correlation and regression analyses using the same statistical tools as for linear relationships. In every scenario, statistical significance of the correlations was tested using t-statistics with a p value threshold of less than 0.05.
Supplementary information
Source data
Acknowledgements
We thank Caroline Koschik for the preliminary elemental analysis that inspired this research and Zhenghui Wu for assistance in the lab. We are grateful to Ali Pourmand and Arash Sharifi for access to lab equipment, BHVO-2, AGV-2, and for supporting sample and standard digestions. This work was supported by research startup and teaching funds provided by the Rosenstiel School of Marine, Atmospheric, and Earth Science and the Graduate Studies Office to A.M.O. Microbialite, sediment, and water samples were previously collected under licenses provided under State and Federal authorizations. At the State level, permits were issued initially through the Department of Environment and Conservation (DEC), later the Department of Parks and Wildlife (DPaW), and now the Department of Biodiversity, Conservation and Attractions (DBCA). These included Regulation 4 (Written Notice of Lawful Authority) permits CE003416 (2012), CE003804 (2013), and CE004275 (2014); Regulation 17 (License to take fauna for Scientific Purposes) permits SF008373 (2012), SF008990 (2013), SF009628 (2014), and 08-0011100-2 (2017); and a Regulation 18 (Export) permit OS002519 (2013). At the Federal level, the Department of Sustainability, Environment, Water, Population and Communities (SEWPaC), later the Department of the Environment (DoE), issued referral EPBC 2012/6307 (2012), EPBC 2013/7071 (2013), and Wildlife Trade Assessment WT2012-3963 (2013). Fieldwork was conducted as part of a University of Miami-led research consortium, funded by Chevron, Repsol, BP and Shell between 2012 and 2015, and described in prior publications25,26,31–33,43,71. We thank the Geological Survey of Western Australia and Hamelin Station (during the tenure of Brian and Mary Wake, and Bush Heritage Australia) for logistical field support. We recognize the Malgana as the traditional custodians of Gathaagudu and their connections to land, sea, and community. We pay our respects to their elders past and present and extend that respect to all Aboriginal and Torres Strait Islander peoples. #12 in the Hamelin Stromatolite Contribution Series.
Author contributions
C.G.L.P. and A.M.O. conceived the project and co-wrote the manuscript. C.G.L.P. performed the analyses, data treatment, and interpretation. A.M.O. supervised the project, assisted in designing methodologies and protocols, and contributed to data interpretation. R.P.R., A.M.O., E.P.S., and B.E.V. conducted fieldwork, collected the samples, and conducted sedimentological and petrographic descriptions of microbialite samples. C.D. contributed to study design and broader implications for microbialites in the geological record. All authors reviewed and edited the manuscript prior to submission.
Peer review
Peer review information
Nature Communications thanks Keyron Hickman-Lewis and the other, anonymous, reviewer(s) for their contribution to the peer review of this work. A peer review file is available.
Data availability
All data generated in this study are available in the main text and Supplementary Information and have also been deposited in the community repository EarthChem (open access, 10.60520/IEDA/114169). Source data are provided with this paper.
Competing interests
The authors declare no competing interests.
Footnotes
Publisher’s note Springer Nature remains neutral with regard to jurisdictional claims in published maps and institutional affiliations.
Contributor Information
Clément G. L. Pollier, Email: clement.pollier@earth.miami.edu
Amanda M. Oehlert, Email: aoehlert@miami.edu
Supplementary information
The online version contains supplementary material available at 10.1038/s41467-025-65007-4.
References
- 1.Burne, R. V. & Moore, L. S. Microbialites: organosedimentary deposits of benthic microbial communities. Palaios2, 241–254 (1987). [Google Scholar]
- 2.Trompette, R. Upper Proterozoic (1800-570 Ma) stratigraphy: A survey of lithostratigraphic, paleontological, radiochronological and magnetic correlations. Precambrian Res.18, 27–52 (1982). [Google Scholar]
- 3.Grotzinger, J. P. & Knoll, A. H. Stromatolites in Precambrian carbonates: Evolutionary mileposts or environmental dipsticks? Annu. Rev. Earth Planet. Sci.27, 313–358 (1999). [DOI] [PubMed] [Google Scholar]
- 4.Allwood, A. C., Walter, M. R., Kamber, B. S., Marshall, C. P. & Burch, I. W. Stromatolite reef from the Early Archaean era of Australia. Nature441, 714–718 (2006). [DOI] [PubMed] [Google Scholar]
- 5.Reid, R. P., Suosaari, E. P., Oehlert, A. M., Pollier, C. G. L. & Dupraz, C. Microbialite accretion and growth: Lessons from Shark Bay and the Bahamas. Annu. Rev. Mar. Sci.16, 487–511 (2024). [DOI] [PubMed] [Google Scholar]
- 6.Suarez-Gonzalez, P., Benito, M. I., Quijada, I. E., Mas, R. & Campos-Soto, S. ‘Trapping and binding’: A review of the factors controlling the development of fossil agglutinated microbialites and their distribution in space and time. Earth Sci. Rev.194, 182–215 (2019). [Google Scholar]
- 7.Semikhatov, M. A., Gebelein, C. D., Cloud, P., Awramik, S. M. & Benmore, W. C. Stromatolite morphogenesis—progress and problems. Can. J. Earth Sci.16, 992–1015 (1979). [Google Scholar]
- 8.Osman, J. R. et al. Key energy metabolisms in modern living microbialites from hypersaline Andean lagoons of the Salar de Atacama, Chile. Sci. Total Environ.937, 173469 (2024). [DOI] [PubMed] [Google Scholar]
- 9.Sancho-Tomás, M. et al. Distribution, redox state and (bio)geochemical implications of arsenic in present day microbialites of Laguna Brava, Salar de Atacama. Chem. Geol.490, 13–21 (2018). [Google Scholar]
- 10.Sancho-Tomás, M. et al. Geochemical evidence for arsenic cycling in living microbialites of a high altitude Andean Lake (Laguna Diamante, Argentina). Chem. Geol.549, 119681 (2020). [Google Scholar]
- 11.Sforna, M. C. et al. Patterns of metal distribution in hypersaline microbialites during early diagenesis: Implications for the fossil record. Geobiology15, 259–279 (2017). [DOI] [PubMed] [Google Scholar]
- 12.Sforna, M. C. et al. Evidence for arsenic metabolism and cycling by microorganisms 2.7 billion years ago. Nat. Geosci.7, 811–815 (2014). [Google Scholar]
- 13.Thomas, C. et al. Combined genomic and imaging techniques show intense arsenic enrichment caused by detoxification in a microbial mat of the Dead Sea shore. Geochem. Geophys. Geosyst.25, e2023GC011239 (2024). [Google Scholar]
- 14.Visscher, P. T. et al. Modern arsenotrophic microbial mats provide an analogue for life in the anoxic Archean. Commun. Earth Environ.1, 24 (2020). [Google Scholar]
- 15.Oremland, R. S., Saltikov, C. W., Wolfe-Simon, F. & Stolz, J. F. Arsenic in the evolution of earth and extraterrestrial ecosystems. Geomicrobiol. J.26, 522–536 (2009). [Google Scholar]
- 16.Des Marais, D. J. et al. The NASA astrobiology roadmap. Astrobiology3, 219–235 (2003). [DOI] [PubMed] [Google Scholar]
- 17.Chan, M. A. et al. Deciphering biosignatures in planetary contexts. Astrobiology19, 1075–1102 (2019). [DOI] [PMC free article] [PubMed] [Google Scholar]
- 18.Malaterre, C. et al. Is there such a thing as a biosignature? Astrobiology23, 1213–1227 (2023). [DOI] [PubMed] [Google Scholar]
- 19.Babilonia, J. et al. Comparative metagenomics provides insight into the ecosystem functioning of the Shark Bay Stromatolites, Western Australia. Front. Microbiol.9, 1359 (2018). [DOI] [PMC free article] [PubMed] [Google Scholar]
- 20.Ruvindy, R., White III, R. A., Neilan, B. A. & Burns, B. P. Unravelling core microbial metabolisms in the hypersaline microbial mats of Shark Bay using high-throughput metagenomics. ISME J.10, 183–196 (2016). [DOI] [PMC free article] [PubMed] [Google Scholar]
- 21.Skoog, E. J., Fournier, G. P. & Bosak, T. Assessing the influence of HGT on the evolution of stress responses in microbial communities from Shark Bay, Western Australia. Genes14, 2168 (2023). [DOI] [PMC free article] [PubMed] [Google Scholar]
- 22.Wong, H. L. et al. Disentangling the drivers of functional complexity at the metagenomic level in Shark Bay microbial mat microbiomes. ISME J.12, 2619–2639 (2018). [DOI] [PMC free article] [PubMed] [Google Scholar]
- 23.Grey, K. & Awramik, S. Handbook for the Study and Description of Microbialites. (Geological Survey of Western Australia, Bulletin 147, 2020).
- 24.Pollier, C. G. L., Guerrero, A. N., Rabassa, J. & Ariztegui, D. The hidden biotic face of microbialite morphogenesis—a case study from Laguna de Los Cisnes, southernmost Patagonia (Chile). Sedimentology71, 1615–1638 (2024). [Google Scholar]
- 25.Vitek, B. E., Suosaari, E. P., Stolz, J. F., Oehlert, A. M. & Reid, R. P. Initial accretion in Hamelin Pool microbialites: The role of Entophysalisin precipitation of microbial micrite. Geosciences12, 304 (2022). [Google Scholar]
- 26.Vitek, B. E. et al. Bidirectional fabric evolution in Hamelin Pool microbialites, Shark Bay, Western Australia. Depos. Rec.9, 959–988 (2023). [Google Scholar]
- 27.Reid, R. P., James, N. P., Macintyre, I. G., Dupraz, C. P. & Burne, R. V. Shark Bay stromatolites: microfabrics and reinterpretation of origins. Facies49, 299–324 (2003). [Google Scholar]
- 28.Bosak, T., Knoll, A. H. & Petroff, A. P. The meaning of stromatolites. Annu. Rev. Earth Planet. Sci.41, 21–44 (2013). [Google Scholar]
- 29.Logan, B. W., Hoffman, P. & Gebelein, C. D. Algal mats, cryptalgal fabrics, and structures, Hamelin Pool, Western Australia. in Evolution and Diagenesis of Quaternary Carbonate Sequences, Shark Bay, Western Australia Vol. 22 (eds Logan, B. W. et al.) 140–194 (AAPG Special Volumes, 1974).
- 30.Playford, P. E. & Cockbain, A. E. Modern algal stromatolites at Hamelin Pool, a hypersaline barred basin in Shark Bay, Western Australia. in Developments in Sedimentology Vol. 20 (ed. Walter, M. R.) Ch. 8.2, 389–411 (Elsevier, 1976).
- 31.Suosaari, E. P. et al. New multi-scale perspectives on the stromatolites of Shark Bay, Western Australia. Sci. Rep.6, 20557 (2016). [DOI] [PMC free article] [PubMed] [Google Scholar]
- 32.Suosaari, E. P. et al. Stromatolite provinces of Hamelin Pool: physiographic controls on stromatolites and associated lithofacies. J. Sediment. Res.89, 207–226 (2019). [Google Scholar]
- 33.Suosaari, E. P. et al. The microbial carbonate factory of Hamelin Pool, Shark Bay, Western Australia. Sci. Rep.12, 12902 (2022). [DOI] [PMC free article] [PubMed] [Google Scholar]
- 34.Jahnert, R. J. & Collins, L. B. Characteristics, distribution and morphogenesis of subtidal microbial systems in Shark Bay, Australia. Mar. Geol.303–306, 115–136 (2012). [Google Scholar]
- 35.Playford, P. E. Geology of the Shark Bay area, Western Australia. Research in Shark Bay, Report of the France–Australe Bicentenary Expedition Committee 13–31 (Western Australian Museum, 1990).
- 36.Decho, A. W., Visscher, P. T. & Reid, R. P. Production and cycling of natural microbial exopolymers (EPS) within a marine stromatolite. Palaeogeogr. Palaeoclimatol. Palaeoecol.219, 71–86 (2005). [Google Scholar]
- 37.Kawaguchi, T. & Decho, A. W. Isolation and biochemical characterization of extracellular polymeric secretions (EPS) from modern soft marine stromatolites (Bahamas) and its inhibitory effect on CaCO3 precipitation. Prep. Biochem. Biotechnol.32, 51–63 (2002). [DOI] [PubMed] [Google Scholar]
- 38.Braissant, O. et al. Exopolymeric substances of sulfate-reducing bacteria: interactions with calcium at alkaline pH and implication for formation of carbonate minerals. Geobiology5, 401–411 (2007). [Google Scholar]
- 39.Baumgartner, L. K. et al. Microbial diversity in modern marine stromatolites, Highborne Cay, Bahamas. Environ. Microbiol.11, 2710–2719 (2009). [DOI] [PubMed] [Google Scholar]
- 40.Kulp, T. R. et al. Effects of imposed salinity gradients on dissimilatory arsenate reduction, sulfate reduction, and other microbial processes in sediments from two California soda lakes. Appl. Environ. Microbiol.73, 5130–5137 (2007). [DOI] [PMC free article] [PubMed] [Google Scholar]
- 41.Liu, H. et al. Arsenic mobilization affected by extracellular polymeric substances (EPS) of the dissimilatory iron reducing bacteria isolated from high arsenic groundwater. Sci. Total Environ.735, 139501 (2020). [DOI] [PubMed] [Google Scholar]
- 42.Qiu, D., Yu, Z., Zhang, X., Wen, C. & Yan, C. Influence of extracellular polymeric substances on arsenic bioaccumulation and biotransformation in biofilms. Chemosphere349, 140798 (2024). [DOI] [PubMed] [Google Scholar]
- 43.Suosaari, E. P., Awramik, S. M., Reid, R. P., Stolz, J. F. & Grey, K. Living dendrolitic microbial mats in Hamelin Pool, Shark Bay, Western Australia. Geosciences8, 212 (2018). [Google Scholar]
- 44.Dupraz, C. & Visscher, P. T. Microbial lithification in marine stromatolites and hypersaline mats. Trends Microbiol.13, 429–438 (2005). [DOI] [PubMed] [Google Scholar]
- 45.Dupraz, C. et al. Processes of carbonate precipitation in modern microbial mats. Earth Sci. Rev.96, 141–162 (2009). [Google Scholar]
- 46.Visscher, P. T. et al. Formation of lithified micritic laminae in modern marine stromatolites (Bahamas); the role of sulfur cycling. Am. Mineral.83, 1482–1493 (1998). [Google Scholar]
- 47.Visscher, P. T., Reid, R. P. & Bebout, B. M. Microscale observations of sulfate reduction: Correlation of microbial activity with lithified micritic laminae in modern marine stromatolites. Geology28, 919–922 (2000). [Google Scholar]
- 48.Newman, D. K., Ahmann, D. & Morel, F. M. M. A brief review of microbial arsenate respiration. Geomicrobiol. J.15, 255–268 (1998). [Google Scholar]
- 49.Huerta-Diaz, M. A. et al. Millimeter-scale resolution of trace metal distributions in microbial mats from a hypersaline environment in Baja California, Mexico. Geobiology10, 531–547 (2012). [DOI] [PubMed] [Google Scholar]
- 50.Yokoyama, Y., Tanaka, K. & Takahashi, Y. Differences in the immobilization of arsenite and arsenate by calcite. Geochim. Cosmochim. Acta91, 202–219 (2012). [Google Scholar]
- 51.Fukushi, K., Sakai, M., Munemoto, T., Yokoyama, Y. & Takahashi, Y. Arsenate sorption on monohydrocalcite by coprecipitation during transformation to aragonite. J. Hazard. Mater.304, 110–117 (2016). [DOI] [PubMed] [Google Scholar]
- 52.Allwood, A. C., Rosing, M. T., Flannery, D. T., Hurowitz, J. A. & Heirwegh, C. M. Reassessing evidence of life in 3,700-million-year-old rocks of Greenland. Nature563, 241–244 (2018). [DOI] [PubMed] [Google Scholar]
- 53.Lowe, D. R. Abiological origin of described stromatolites older than 3.2 Ga. Geology22, 387–390 (1994). [DOI] [PubMed] [Google Scholar]
- 54.James, N. P., Narbonne, G. M. & Kurtis Kyser, T. Late Neoproterozoic cap carbonates: Mackenzie Mountains, northwestern Canada: precipitation and global glacial meltdown. Can. J. Earth Sci.38, 1229–1262 (2001). [Google Scholar]
- 55.Saller, A. et al. Presalt stratigraphy and depositional systems in the Kwanza Basin, offshore Angola. AAPG Bull.100, 1135–1164 (2016). [Google Scholar]
- 56.Hickman-Lewis, K., Cavalazzi, B. & Montgomery, W. Correlative microspectroscopy of biogenic fabrics in Proterozoic silicified stromatolites. Geochem. Perspect. Lett.30, 34–39 (2024). [Google Scholar]
- 57.Hickman-Lewis, K. & Westall, F. A southern African perspective on the co-evolution of early life and environments. South Afr. J. Geol.124, 225–252 (2021). [Google Scholar]
- 58.Homann, M. Earliest life on earth: evidence from the Barberton Greenstone Belt, South Africa. Earth Sci. Rev.196, 102888 (2019). [Google Scholar]
- 59.Dupraz, C. & Strasser, A. Microbialites and micro-encrusters in shallow coral bioherms (Middle to Late Oxfordian, Swiss Jura Mountains). Facies40, 101–129 (1999). [Google Scholar]
- 60.Gleeson et al. Biodiversity of living, non-marine, thrombolites of Lake Clifton, Western Australia. Geomicrobiol. J.33, 850–859 (2016). [Google Scholar]
- 61.Louyakis, A. S. et al. A study of the microbial spatial heterogeneity of Bahamian thrombolites using molecular, biochemical, and stable isotope analyses. Astrobiology17, 413–430 (2017). [DOI] [PMC free article] [PubMed] [Google Scholar]
- 62.Kennard, J. M. & James, N. P. Thrombolites and stromatolites; two distinct types of microbial structures. Palaios1, 492–503 (1986). [Google Scholar]
- 63.Nomchong, B. J. & Van Kranendonk, M. J. Diverse thrombolites from the c. 2.4 Ga Turee Creek Group, Western Australia. Precambrian Res.338, 105593 (2020). [Google Scholar]
- 64.Barrat, J.-A., Chauvaud, L., Olivier, F., Poitevin, P. & Rouget, M.-L. Trace elements in bivalve shells: How “vital effects” can bias environmental studies. Chem. Geol.638, 121695 (2023). [Google Scholar]
- 65.McClintock, J. B. et al. Trace elements in shells of common gastropods in the near vicinity of a natural CO2 vent: No evidence of pH-dependent contamination. Biogeosciences Discuss.11, 5215–5237 (2014). [Google Scholar]
- 66.Smith, C. W., Fehrenbacher, J. S. & Goldstein, S. T. Incorporation of heavy metals in experimentally grown foraminifera from Sapelo Island, Georgia and Little Duck Key, Florida, USA. Mar. Micropaleontol.156, 101854 (2020). [Google Scholar]
- 67.Paterson, D. M. et al. Light-dependant biostabilisation of sediments by stromatolite assemblages. PLoS One3, e3176 (2008). [DOI] [PMC free article] [PubMed] [Google Scholar]
- 68.Diaz, M. R. et al. Geochemical evidence of microbial activity within ooids. Sedimentology62, 2090–2112 (2015). [Google Scholar]
- 69.Chraiki, I. et al. Blooming of a microbial community in an Ediacaran extreme volcanic lake system. Sci. Rep.13, 9080 (2023). [DOI] [PMC free article] [PubMed] [Google Scholar]
- 70.Swart, P. K. The geochemistry of carbonate diagenesis: The past, present and future. Sedimentology62, 1233–1304 (2015). [Google Scholar]
- 71.Suosaari, E., Playford, P., Vitek, B. & Reid, R. P. Hamelin Pool Microbialites: Images of vertical sections and thin section scans. Mendeley Data 10.17632/bhrp5hrvyn.1 (2023).
- 72.Yang, L. et al. Inter-laboratory study for the certification of trace elements in seawater certified reference materials NASS-7 and CASS-6. Anal. Bioanal. Chem.410, 4469–4479 (2018). [DOI] [PubMed] [Google Scholar]
- 73.Melim, L. A., Swart, P. K. & Eberli, G. P. Mixing-zone diagenesis in the subsurface of Florida and the Bahamas. J. Sediment. Res.74, 904–913 (2004). [Google Scholar]
- 74.Oehlert, A. M., Swart, P. K., Eberli, G. P., Evans, S. & Frank, T. D. Multi-proxy constraints on the significance of covariant δ13C values in carbonate and organic carbon during the early Mississippian. Sedimentology66, 241–261 (2019). [Google Scholar]
- 75.Carroll, R. J. & Ruppert, D. Transformation and Weighting in Regression. (Chapman and Hall/CRC, 2017).
- 76.Limpert, E., Stahel, W. A. & Abbt, M. Log-normal distributions across the sciences: keys and clues: On the charms of statistics, and how mechanical models resembling gambling machines offer a link to a handy way to characterize log-normal distributions, which can provide deeper insight into variability and probability—normal or log-normal: that is the question. BioScience51, 341–352 (2001). [Google Scholar]
Associated Data
This section collects any data citations, data availability statements, or supplementary materials included in this article.
Supplementary Materials
Data Availability Statement
All data generated in this study are available in the main text and Supplementary Information and have also been deposited in the community repository EarthChem (open access, 10.60520/IEDA/114169). Source data are provided with this paper.