Abstract
Bacterial utilization of crude oil components, such as the n-alkanes, requires complex cell surface adaptation to allow adherence to oil. To better understand microbial cell surface adaptation to growth on crude oil, the cell surface characteristics of two Pseudomonas aeruginosa strains, U1 and U3, both isolated from the same crude oil-degrading microbial community enriched on Bonny Light crude oil (BLC), were compared. Analysis of growth rates demonstrated an increased lag time for U1 cells compared to U3 cells. Amendment with EDTA inhibited U1 and U3 growth and degradation of the n-alkane component of BLC, suggesting a link between cell surface structure and crude oil degradation. U1 cells demonstrated a smooth-to-rough colony morphology transition when grown on BLC, while U3 cells exhibited rough colony morphology at the outset. Combining high-resolution atomic force microscopy of the cell surface and sodium dodecyl sulfate-polyacrylamide gel electrophoresis of extracted lipopolysaccharides (LPS), we demonstrate that isolates grown on BLC have reduced O-antigen expression compared with that of glucose-grown cells. The loss of O-antigen resulted in shorter LPS molecules, increased cell surface hydrophobicity, and increased n-alkane degradation.
Among the hydrocarbon-utilizing bacteria, Pseudomonas aeruginosa is one of the most frequently isolated from hydrocarbon-impacted environments (4, 31). Due to the low aqueous solubility of n-alkanes, the ability of P. aeruginosa to oxidize this fraction of crude oil depends on direct cell-substrate contact (12, 31). Bacterial utilization of hydrophobic compounds requires cell surface adaptation to overcome forces interfering with direct cell-substrate contact. In gram-negative bacteria, the outer membrane is the initial cell component to contact substrates and is directly impacted by cell culture conditions, such as temperature, pH, and nutrient availability (7). Understanding bacterial adaptation of the outer membrane may provide insight into attachment to and utilization of hydrophobic compounds.
In P. aeruginosa, variation in the lipopolysaccharide (LPS) molecules of the outer membrane influences cell surface hydrophobicity (2, 22). The amphipathic nature of LPS molecules results from three covalently linked components, a hydrophobic lipid A region, a core oligosaccharide, and a repeating O-polysaccharide (or O-antigen) portion (37). The O-antigen region contacts the surrounding environment and directly impacts nonspecific cell surface properties, such as hydrophobicity (22, 27). P. aeruginosa coexpresses two distinct LPS types, A-band and B-band LPS (20, 28). The shorter A-band LPS is composed of 23 d-rhamnose trisaccharide repeating units, while the longer B-band LPS contains numerous monosaccharides arranged as di- to pentasaccharide units. While the B-band LPS often masks the underlying A-band molecules, variations in growth conditions can alter LPS expression, resulting in changes in cell surface properties. P. aeruginosa growth on n-hexadecane results in an overall reduction in expressed LPS, resulting in increased cell surface hydrophobicity (2, 23). P. aeruginosa mutants lacking B-band LPS have increased hydrophobicity and adherence to polystyrene (22). While total LPS release from the outer membrane of P. aeruginosa has been demonstrated on a single hydrophobic compound, LPS variation occurring during the degradation of complex hydrophobic substrates, such as crude oil, has not been demonstrated.
In this study, atomic force microscopy (AFM) was combined with biochemical approaches to characterize variations in the LPS expression of two P. aeruginosa isolates, U1 (smooth isolate) and U3 (rough isolate). These bacteria have been routinely isolated from repeated monthly transfers of the same Bonny Light crude oil (BLC)-degrading enrichment cultures and exhibit phenotypic changes when grown on crude oil. To examine cell surface adaptation corresponding to these phenotypic changes, U1 and U3 were grown on an insoluble (BLC) or soluble (glucose) substrate. To further examine the role of cell surface structure on BLC degradation, cultures were grown on BLC or glucose and amended with 4 mM EDTA. In this study, P. aeruginosa cells grown on BLC reduced O-antigen expression compared with cells grown on glucose, resulting in reduced LPS length and increased cell surface hydrophobicity.
MATERIALS AND METHODS
Bacteria.
BLC-degrading enrichment cultures were established using soil from a hydrocarbon-contaminated site in Fairhope, Ala. The two P. aeruginosa strains used in this study have been routinely isolated over 48 monthly sequential transfers and have been designated isolates U1 and U3 based on morphology and analysis of a 323-bp sequence of the V9 region of the 16S rRNA amplicon (11).
DNA fingerprinting.
Extracted DNA was analyzed by SalI restriction fragment length polymorphism (SalI-RFLP) and repetitive extragenic palindromic PCR (REP-PCR) (1, 9, 26). SalI-RFLP and REP-PCR patterns were determined for U1 and U3, PAK, a clinical P. aeruginosa isolate (ATCC 25102), and Escherichia coli. For SalI-RFLP, DNA was extracted from overnight cultures grown on Luria-Bertani (LB) broth (Difco Laboratories, Detroit, Mich.) by using the CTAB protocol (38) and was digested with SalI restriction enzyme (Promega, Madison, Wis.). Digested DNA was separated on a 0.5% Tris-boric acid (TBE) gel, stained with SYBR I green DNA stain (Molecular Probes, Eugene, Oreg.), and analyzed using a model 595 laser fluorimager with ImageQuant software (Molecular Dynamics, Sunnyvale, Calif). For REP-PCR, cells were grown overnight on LB broth, washed, plated on LB agar plates, and grown overnight at 30°C. Whole cells from single colonies were used directly in REP-PCRs. PCRs were performed on a Techne GeneMate thermal cycler (ISC BioExpress, Kaysville, Utah) by using the primer set REP1R and REP2 (36). PCR products were then separated on a 1.5% TBE gel, stained with SYBR I green DNA stain, and analyzed using a model 595 laser fluorimager with ImageQuant software.
Culture establishment.
To evaluate U1 and U3 growth on crude oil over time, cultures were grown in 10 ml of basal medium amended with trace metals (BMTM) (14) and supplemented with 2 mg of BLC ml−1 (API gravity, 35.3; 56% saturates, 31% aromatics, 11% polars, and 2% asphaltenes). Simultaneously, cultures were grown in BMTM amended with 4 mM EDTA, a cell surface destabilizing reagent, and supplemented with BLC (2 mg · ml−1). Analytical controls included flasks containing uninoculated BMTM supplemented with BLC. For comparison, U1 and U3 cultures were grown on 2% glucose with or without 4 mM EDTA. Flasks were shaken at 200 rpm at 30°C for up to 248 h with separate triplicate cultures sampled every 8 to 16 h to monitor bacterial growth by acridine orange direct counts (15) and oil degradation. Bacteria were enumerated on a Nikkon Labophot microscope fitted with an EF-D episcopic fluorescent attachment with a high-pressure mercury bulb (Nikkon Co., Garden City, N.Y.).
Oil analysis.
At each time point, triplicate cultures supplemented with BLC were extracted three times with 10 ml of dichloromethane and dried with anhydrous sodium sulfate (12 to 60 mesh; J. T. Baker, Phillipsburg, N.J.). Next, extracts were combined into round-bottom flasks and evaporated to dryness at 45°C using a rotovap (Buchi R114) under vacuum, and oil residues were shaken with 5 ml of n-hexane to precipitate the asphaltene fraction. Samples were then analyzed on a Hewlett-Packard Series 5890 II Plus gas chromatograph equipped with a flame ionization detector (GC-FID) and a 25-m type HP-5 column (0.32-mm diameter, 0.52-μm phase thickness). Due to the inability of U1 and U3 to degrade the branched alkanes, the percentage of n-alkane degradation was calculated based on the detector response ratio of n-C17 plus n-C18 to pristane plus phytane at each time point compared to uninoculated controls. While this ratio does not represent overall crude oil degradation and is limited by detector response, it can be used as a rough estimate of the biodegradation of n-alkanes.
BATH assay.
Cell surface hydrophobicity was determined using the bacterial adhesion to hexadecane (BATH) assay (29). Cells were cultured and grown to exponential phase on 2% glucose for 24 h or on 2 mg of BLC ml−1 for 100 h. Cells were removed, washed with BMTM, and resuspended to an optical density at 400 nm of 1.0. The cell suspension (0.8 ml), alone or with hexadecane (0.1 ml), was transferred to 5-ml glass test tubes and preincubated for 15 min at 30°C with shaking at 200 rpm. Next, the tubes were vortexed for 2 min and phases were separated for 15 min. The aqueous phase was removed, and the optical density at 400 nm was determined using a Beckman DU650 spectrophotometer (Beckman Instruments Inc., Fullerton, Calif.). Hydrophobicity was expressed as a percentage of the difference between the adhesion to the glass and the adhesion to hexadecane (C16).
AFM.
Cell surface morphological adaptation to growth on BLC was determined using a Nanoscope III scanning probe microscope equipped with an extender electronics module and a scanner with a maximum XY scan range of 13 by 13 μm (Digital Instruments, Inc., Santa Barbara, Calif.). Bacteria were cultured to exponential phase at 30°C for up to 72 h on BMTM supplemented with either 2% glucose or 2 mg of BLC ml−1 with constant shaking at 200 rpm. Cells were fixed overnight at 4°C with 2.5% glutaraldehyde, washed two times, and resuspended in BMTM. Samples were aliquoted onto freshly cleaved mica disks and dried for 5 min at room temperature. Height and phase data were captured using tapping mode AFM with standard Digital Instruments silicon cantilevers having resonance frequencies of 272 to 446 kHz. Roughness root mean square (RMS) values were calculated for plane-fitted, flattened images and were used to measure the standard deviation of the height of a given area. Height distribution histograms and roughness RMS values of individual cells were calculated for sections (approximately 200 by 200 nm) of each high-resolution surface plot having a Z range of 100 nm by using Scanning Probe Image Processor software (Image Metrology Aps, Lyngby, Denmark). Negative height values represent surface depressions below the calculated surface baseline (0 nm), while positive height values represent areas of the surface extended above the baseline.
LPS isolation.
Smooth and rough LPS were extracted from exponential-phase U1 and U3 grown on 2% glucose (24 h) or 2 mg of BLC ml−1 (100 h) (8). The concentration of extracted LPS was estimated using the thiobarbituric acid assay of 2-keto-3-deoxyoctonic acid (KDO) (2).
SDS-PAGE and immunoblotting.
LPS was analyzed by sodium dodecyl sulfate-polyacrylamide gel electrophoresis (SDS-PAGE) on a 15% polyacrylamide gel (19), and carbohydrate was visualized by silver staining (35). To allow visualization of less abundant LPS types, lanes were overloaded with LPS (32 μg). LPS separated by SDS-PAGE was electrophoretically transferred onto nitrocellulose overnight at 200 mA and 4°C followed by 1 h at 500 mA (34). Immunoblots were then blocked using 5% milk in TTBS (0.6% Tris base, 1.74% NaCl, 0.5% Tween 20 [pH 7.5]) and incubated overnight with antibodies specific for A-band LPS (N1F10) (20). Immunoblots were subsequently washed and incubated with peroxidase-conjugated goat anti-mouse secondary antibodies (1:10,000; Jackson ImmunoResearch Laboratory) for 1 h and detected using ECL Western blotting detection reagents (Amersham Pharmacia Biotech, Buckinghamshire, England).
RESULTS
Genetic fingerprinting.
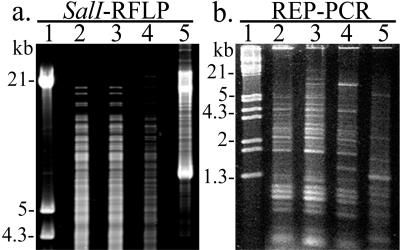
Genomic restriction patterns were determined for U1 and U3 for comparison with PAK and E. coli. SalI-RFLP analysis revealed similar restriction patterns for U1 and U3 (Fig. 1a, lanes 2 and 3). However, U1 and U3 restriction patterns were observed to be different from the restriction patterns generated from PAK and E. coli (Fig. 1a, lanes 2 to 5). REP-PCR analysis demonstrated that U1 and U3 isolates had similar banding patterns (Fig. 1b, lanes 2 and 3) but gave different banding patterns from those of PAK and E. coli (Fig. 1b, lanes 2 to 5).
FIG. 1.
DNA fingerprinting of U1 and U3. SalI-RFLP (a) and REP-PCR (b) profiles of U1 (lane 2), U3 (lane 3), PAK (lane 4), and E. coli (lane 5) isolates. Lambda EcoRI HindIII DNA was used as a marker (lane 1).
Growth and crude oil degradation.
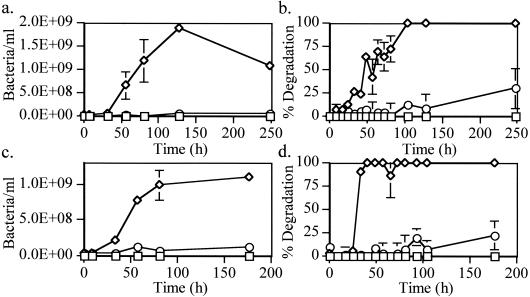
A time course experiment was established to examine growth and BLC degradation for P. aeruginosa isolates U1 and U3. U1 cultures grown on BMTM and BLC reached a maximum cell density of 1.9 × 10⁹ bacteria · ml−1 by 128 h (Fig. 2a). The degradation of n-alkanes by U1 cultures paralleled growth, with near complete reduction of the gas chromatography detector response ratio of n-C17 plus n-C18 compounds to pristane plus phytane by 104 h (Fig. 2b). Compared to U1 cells, U3 cells grown on BMTM and BLC have a shorter lag phase, reaching a maximum cell density of 9.9 × 10⁸ bacteria · ml−1 by 80 h (Fig. 2c). Similar to what was seen with U1 cultures, degradation of BLC n-alkanes by U3 cultures also paralleled growth, with near complete degradation of the monitored compounds by 40 h (Fig. 2d).
FIG. 2.
Growth and percent of BLC degradation by P. aeruginosa U1 (a and b) and U3 (c and d) isolates. Bacteria were established for up to 250 h under the following conditions: 2 mg of BLC ml−1 (⋄), 2 mg of BLC ml−1 plus EDTA (○), and 2 mg of BLC control ml−1 (□). Bacterial growth (a and c) was estimated by acridine orange direct counts and plotted as the number of bacteria per ml. The percentages of oil degradation (b and d) were calculated based on the detector response ratio of n-C17 plus n-C18 to pristane plus phytane at each time point compared to uninoculated controls. Each point represents the average and standard deviation of three replicate samples.
To analyze the effects of cell surface disruption on BLC degradation, cultures were established concurrently on BMTM and BLC and amended with 4 mM EDTA. U1 cultures grown on BLC and supplemented with EDTA showed no appreciable growth (6.6 × 10⁷ bacteria · ml−1) by 128 h (Fig. 2a). U1 cultures containing EDTA also demonstrated reduced n-alkane degradation (12%) compared to cultures not containing EDTA (90 to 100%) by 104 h (Fig. 2b). Similar to U1 cultures, U3 cultures grown on BLC and supplemented with EDTA showed no appreciable growth (6.4 × 10⁷ bacteria · ml−1) by 80 h (Fig. 2c). The EDTA-amended U3 cultures showed reduced BLC degradation by 40 h compared to cultures unamended with EDTA (Fig. 2d). However, in both U1 and U3 cultures amended with EDTA, an increase in BLC degradation was observed after extended incubation times. U1 and U3 cells grown on glucose and amended with EDTA showed no reduction in growth compared to those in unamended glucose cultures (data not shown). This demonstrated that EDTA addition had minimal influence on cellular processes when cells were grown on glucose, a water-soluble substrate.
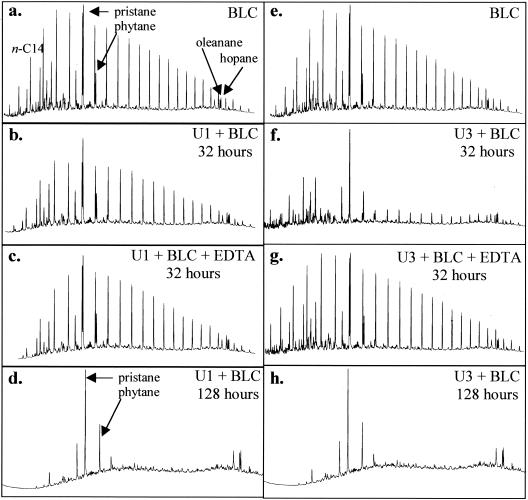
To further demonstrate the differences in U1 and U3 degradations of BLC, GC-FID traces at 32 h are shown in Fig. 3. This time point was chosen because previous data show this to be the point of initial phenotypic variation. U3 cultures showed a reduction in the remaining n-alkanes compared to what was observed with U1 cultures and uninoculated controls (Fig. 3b, e, and f). For comparison, GC-FID traces of BLC components remaining after 128 h with U1 and U3 cultures show only the nondegraded branched-chain alkanes and biomarker compounds remaining (Fig. 3d and h). The inhibition of n-alkane degradation by U1 and U3 cultures amended with EDTA at 32 h is demonstrated by the remaining GC-FID n-alkane peaks and is representative of traces through 128 h of incubation (Fig. 3a, c, e, and g).
FIG. 3.
GC-FID traces of BLC after incubation with U1 and U3 isolates. (a) BLC control; (b) BLC incubated with U1 cells after 32 h; (c) BLC incubated with U1 cells and supplemented with 4 mM EDTA; (d) BLC incubated with U1 cells at 128 h; (e) BLC control; (f) BLC incubated with U3 cells after 32 h; (g) BLC incubated with U3 cells and supplemented with 4 mM EDTA; (h) BLC incubated with U3 cells at 128 h. All traces are representative of triplicate cultures. The x axes represent time (0 to 25 min), and the y axes represent detector response (1,000 to 8,000).
Colony morphology and cell surface hydrophobicity.
U1 cells grown on glucose were characterized by smooth colonies, with cells appearing to grow into the agar. U1 cells grown on BLC exhibited rough colony morphology, with cells appearing to grow away from the agar. In comparison, U3 cells grown on glucose or BLC were characterized by rough colony morphology when observed on 1% LB agar plates (data not shown).
Cell surface hydrophobicity was estimated from the extent of bacterial adhesion to hexadecane during growth on glucose or BLC. Corresponding to a smooth-to-rough transition, U1 cells demonstrated an approximately eightfold increase in cell surface hydrophobicity when grown on BLC compared to when they were grown on glucose (Table 1). Similarly, U3 cells grown on BLC showed an approximately threefold increase in hydrophobicity compared to cells grown on glucose. The apparent differences in colony morphology and cell surface hydrophobicity led to further characterization of U1 and U3 LPS structure.
TABLE 1.
BATH assay for glucose- and BLC-enriched cellsa
| Isolate and enrichment | Adhesion to hexadecane (%) |
|---|---|
| U1 glucose | 8.04 ± 3.38 |
| U1 BLC | 65.35 ± 4.62b |
| U3 glucose | 13.05 ± 1.73 |
| U3 BLC | 43.63 ± 4.56b |
P. aeruginosa U1 and U3 isolates were established on glucose or BLC for 48 h. Cell surface hydrophobicity was then estimated as the percentage of cellular adhesion to hexadecane.
P < 0.01.
AFM.
AFM was used to characterize surface morphological features of P. aeruginosa isolates U1 and U3 grown on either glucose or BLC. Low-resolution images showed differences in overall cell morphology depending on the growth substrate. U1 cells demonstrated a 53.3% reduction in cell length when grown on BLC instead of glucose, while U3 cells demonstrated a 12.5% reduction in cell length when grown on BLC instead of glucose (data not shown). This reduction in cell length also corresponded to the smooth-to-rough colony morphology transition observed in U1 cultures.
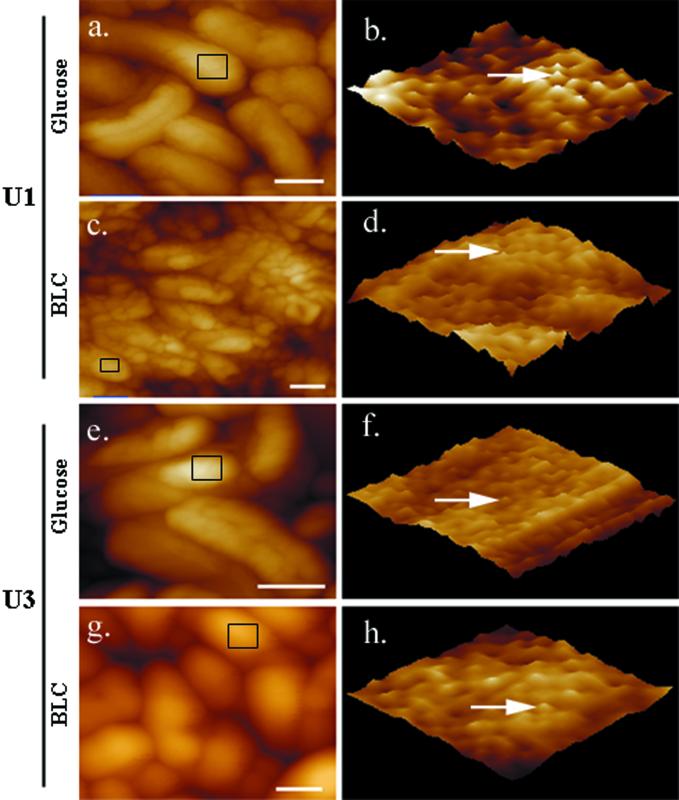
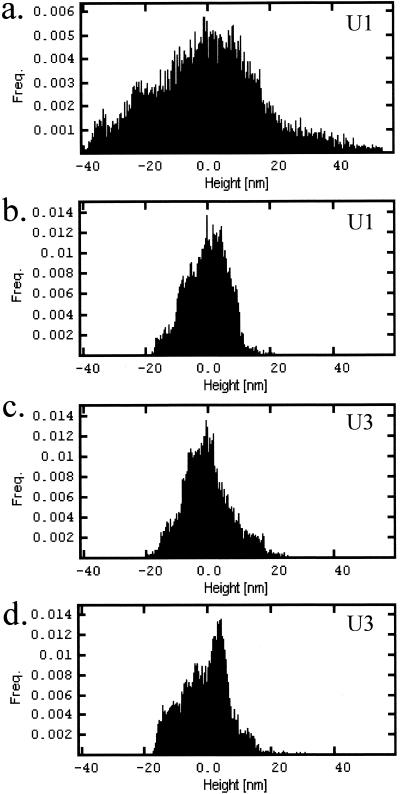
High-resolution height and phase scanning of 100- by 100-nm sections of U1 and U3 isolates revealed substructural features at the angstrom level. Representative AFM images of U1 and U3 cells demonstrated uniform protrusions (with lateral dimensions between 30 to 60 nm along the cell surfaces as well as depressions in the cell surfaces (Fig. 4b, d, f, and h). Incubation of cells with monoclonal antibodies specific for P. aeruginosa LPS resulted in an increase in protrusion height, thus identifying them as bundles of LPS molecules (data not shown). AFM imaging demonstrated decreased LPS height for U1 cells grown on BLC versus those grown on glucose, with roughness RMS values of 8.2 and 18.2 nm, respectively (Fig. 4b and d). Further examination of LPS height distribution across the surface of individual cells identified a larger frequency of longer LPS types when U1 cells were grown on glucose (Fig. 5a) than when they were grown on BLC (Fig. 5b). This decrease in LPS height corresponded with a smooth-to-rough transition and an increase in cell surface hydrophobicity (Table 1). In comparison, less variation in LPS height was seen between U3 cells grown on glucose and BLC, with roughness RMS values of 8.9 and 9.6, respectively (Fig. 4f and h). While roughness RMS values showed little variation in LPS height for U3 cells established on either substrate, examination of the frequency of LPS distribution across the cell surface showed a shift towards shorter LPS types (Fig. 5c and d).
FIG. 4.
Low- and high-resolution AFM images of P. aeruginosa U1 and U3 isolates. Tapping mode AFM was used to obtain low-resolution images of entire cells (a, c, e, and g) and high-resolution phase images of the cell surface (b, d, f, and h). (a) U1 cells grown on glucose; (b) phase imaging of the U1 cell surface area outlined in panel a; (c) U1 cells grown on BLC; (d) phase imaging of the U1 cell surface area outlined in panel c; (e) U3 cells grown on glucose; (f) phase imaging of the U3 cell surface area outlined in panel e; (g) U3 cells grown on BLC; (h) phase imaging of the U3 cell surface area outlined in panel g. Arrows indicate individual LPS bundles. Scale bars = 0.5 μm.
FIG. 5.
Height distribution histograms for P. aeruginosa U1 (a and b) and U3 (c and d) isolates established on either 2% glucose (a and c) or 2 mg of BLC ml−1 (b and d). Histograms were calculated from approximately 200- by 200-nm AFM high-resolution height scans of individual cell surfaces. Images were obtained with a Z range of 100 nm and were plane corrected.
SDS-PAGE and immunoblotting.
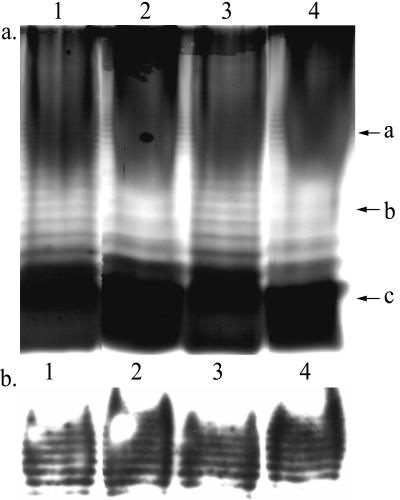
To further characterize LPS distribution, total extracted LPSs of U1 and U3 cells grown on glucose or BLC was examined by SDS-PAGE and immunoblotting using A-band-specific monoclonal antibodies. Silver staining of LPS extracted from glucose-grown U1 and U3 isolates and separated by SDS-PAGE showed ladder-like banding profiles typical for LPS containing different lengths of O-antigen (Fig. 6a, lanes 1 and 3). While U3 cells grown on glucose showed rough colony morphology, the banding profile of total LPS extracted from these cultures demonstrated the presence of LPS of various lengths similar to those of cells showing smooth colony morphology. No differences in the distributions of core LPS (Fig. 6a, arrow c) or short chain A-band LPS (Fig. 6b) were observed for either isolate under any condition. However, LPS extracted from BLC-grown cells showed decreased banding, representing loss of O-antigen units (Fig. 6a, lanes 2 and 4, arrow b). The loss of O-antigen subunits corresponds to the appearance of rough colony morphology, increased cell surface hydrophobicity, and reduced cell surface height variation as demonstrated by AFM.
FIG. 6.
Results of silver-stained SDS-PAGE (a) and Western immunoblot analysis (b) of LPS extracted from P. aeruginosa isolates. Lanes: 1, U1 established on glucose; 2, U1 established on BLC; 3, U3 established on glucose; 4, U3 established on BLC. Arrows: a, A-band LPS; b, LPS containing various numbers of O-antigen subunits; c, core LPS.
DISCUSSION
In this study, the adaptations of U1 and U3 cells that enable them to utilize BLC and result in their persistence in BLC-degrading enrichment cultures were investigated. Analysis of growth rates and BLC degradation over time demonstrated inherent differences between isolates U1 and U3. U3 (rough isolate) demonstrated reduced lag time compared to U1 (smooth isolate) when grown on BLC. U1 cells formed smooth colonies initially and rough colonies after growth on crude oil, while U3 cells demonstrated overall rough colony morphology. Smooth-to-rough phenotypic transition has been observed for bacteria and results in increased cell hydrophobicity (10, 16, 30, 32). For example, the ability of P. aeruginosa 57RP cells to adhere to hexadecane corresponded with the appearance of rough colony morphology and increased cell hydrophobicity (10). Alternatively, rough-to-smooth phenotypic transition for Rhodococcus rhodochrous growing on the aromatic fraction of Arabian light crude oil has been demonstrated (16). Rough U3 cells growing on glucose have greater relative cell surface hydrophobicity than smooth U1 cells growing on glucose. However, U1 and U3 cells grown on BLC demonstrated significantly increased cell surface hydrophobicity, corresponding with a smooth-to-rough transition. The increased lag time for U1 cultures grown on BLC may be explained by the extended adaptation time required by U1 cells to undergo phenotypic transition from smooth, hydrophilic cells to rough, hydrophobic cells. U3 cells exhibited rough colony morphology under both conditions and still demonstrated a significant increase in hydrophobicity when grown on BLC versus glucose. Subsequent SDS-PAGE analysis of extracted LPS as well as AFM examination of the U3 cell surface confirmed that the reduced hydrophobicity for U3 cells grown on glucose is likely due to small subpopulations of cells undergoing rough-to-smooth transition when grown on glucose.
While EDTA had negligible effects on glucose-grown cells, U1 and U3 cultures grown on BLC and supplemented with EDTA demonstrated an inhibition of growth and BLC degradation. Hexadecane utilization by Pseudomonas spp. has been observed to be inhibited by low concentrations of EDTA (12). The cell membrane-destabilizing effect of EDTA on gram-negative bacteria is proposed to involve the chelation of LPS-stabilizing divalent cations, which results in the subsequent removal of LPS from the outer membrane (3, 13, 21). However, the removal of LPS molecules is not uniform and depends on the concentration of EDTA (3). For example, 50 mM EDTA causes the release of short LPS molecules from the periphery of LPS bundles, while 100 mM EDTA causes the release of entire LPS bundles, including short and long molecules (3). The low concentrations of EDTA used in this study may result in loss of short, hydrophobic LPS molecules from the periphery of LPS bundles. The EDTA-induced preferential release of short LPS molecules versus long, hydrophilic LPS molecules may prevent U1 and U3 attachment to and utilization of BLC. The increased BLC degradation observed for EDTA-supplemented cultures after extended incubation times may be due to the activity of U1 and U3 cells with EDTA-induced resistance. The EDTA-induced resistance of Pseudomonas stutzeri that allowed growth in magnesium-limited media has been described previously (33).
Cell surface adaptation by isolates established on BLC compared to that by isolates established on glucose was further examined by high-resolution AFM and SDS-PAGE analysis. Compared to electron microscopy, AFM has the advantage of providing subnanometer resolution of cell surface features with minimal sample preparation and without vacuum (25). Also, unlike traditional biochemical approaches, AFM describes the distribution of structures across the bacterial cell surface in three dimensions (3, 5, 18). Low-resolution AFM imaging demonstrated a reduction in cell length for U1 cells grown on BLC versus those grown on glucose, corresponding to the smooth-to-rough phenotypic transition. Given that U3 cells maintained a rough phenotype, less reduction in cell length was observed. Changes in cell morphology resulting in smaller, more-spherical cells are often associated with low nutrient and carbon conditions (6, 24). The low availability of BLC may represent a low carbon condition, resulting in changes in U1 and U3 cell morphology. High-resolution AFM imaging of cell surface structures demonstrated a reduction in the length of LPS bundles when cells were established on BLC compared to when they were on glucose, corresponding to a smooth-to-rough transition. Analysis of LPS from cultures established on glucose or BLC provides further evidence of reduction in LPS length. Glucose-grown P. aeruginosa cells containing both high-molecular-weight negatively charged B-band LPS and low-molecular-weight neutral A-band LPS demonstrate low surface hydrophobicity (22). However, mutant cells lacking the charged B-band LPS demonstrate increased surface hydrophobicity. Similar A-band distribution and reduced B-band expression were observed for U1 and U3 cells grown on crude oil compared to those grown on glucose, corresponding to increased cell surface hydrophobicity. While the mechanism of LPS variability has not been well established, it has been proposed that rhamnolipid production by P. aeruginosa may cause the removal of LPS by solubilization or divalent cation chelation (2).
Bacteria have developed starvation response mechanisms that allow survival for long periods of time with low nutrient and carbon supplies (17). The ability to quickly adapt to various and potentially unfavorable environmental conditions would likely confer a competitive advantage. In our system, growth on BLC may represent a condition of low carbon availability requiring cell adaptation for substrate utilization. This study demonstrates a correlation between P. aeruginosa U1 and U3 cell surface LPS variation and the ability of these strains to degrade n-alkanes. Interestingly, both smooth and rough phenotypes have been maintained in BLC-degrading enrichment cultures for over 48 months, suggesting different roles in facilitating crude oil degradation in the enrichment cultures. Also, the presence of U1 and U3 cells impacted the degradative capabilities of the microbial community (11), perhaps due to the production of antimicrobial compounds. This study also supports the use of high-resolution AFM combined with biochemical analyses to identify alterations in subcellular structures occurring during microbially mediated degradation of environmental pollutants. Further experiments will examine the roles of smooth (U1) and rough (U3) phenotypes on crude oil degradation and their effects on other members of the BLC-degrading microbial community.
Acknowledgments
This research was supported in part by a grant from the South Carolina Sea Grant Consortium.
We are grateful to the Advanced Analytical Center for Environmental Science at the Savannah River Ecology Laboratory of the University of Georgia for the use of their atomic force microscope. We also thank Tom McDonald for the Bonny Light crude oil and Joan Olson for providing PAK.
References
- 1.Al-Samarrai, T. H., N. Zhang, I. L. Lamont, L. Martin, J. Kolbe, M. Wilsher, A. J. Morris, and J. Schmid. 2000. Simple and inexpensive but highly discriminating method for computer-assisted DNA fingerprinting of Pseudomonas aeruginosa. J. Clin. Microbiol. 38:4445-4452. [DOI] [PMC free article] [PubMed] [Google Scholar]
- 2.Al-Tahhan, R. A., T. R. Sandrin, A. A. Bodour, and R. M. Maier. 2000. Rhamnolipid-induced removal of lipopolysaccharide from Pseudomonas aeruginosa: effect on cell surface properties and interaction with hydrophobic substrates. Appl. Environ. Microbiol. 66:3262-3268. [DOI] [PMC free article] [PubMed] [Google Scholar]
- 3.Amro, N. A., L. P. Kotra, K. Wadu-Mesthrige, A. Bulychev, S. Mobashery, and G.-Y. Liu. 2000. High-resolution atomic force microscopy studies of the Escherichia coli outer membrane: structural basis for permeability. Langmuir 16:2789-2796. [Google Scholar]
- 4.Bartha, R. 1977. The microbiology of aquatic oil spills. Adv. Appl. Microbiol. 22:225-266. [DOI] [PubMed] [Google Scholar]
- 5.Braga, P. C., and D. Ricci. 1998. Atomic force microscopy: application to investigation of Escherichia coli morphology before and after exposure to cefodizime. Antimicrob. Agents Chemother. 42:18-22. [DOI] [PMC free article] [PubMed] [Google Scholar]
- 6.Casida, L. E., Jr. 1977. Small cells in pure cultures of Agromyces ramosus and in natural soil. Can. J. Microbiol. 23:214-216. [DOI] [PubMed] [Google Scholar]
- 7.Costerton, J. W., J. M. Ingram, and K. J. Cheng. 1974. Structure and function of the cell envelope of gram-negative bacteria. Bacteriol. Rev. 38:87-110. [DOI] [PMC free article] [PubMed] [Google Scholar]
- 8.Darveau, R. P., and R. E. Hancock. 1983. Procedure for isolation of bacterial lipopolysaccharides from both smooth and rough Pseudomonas aeruginosa and Salmonella typhimurium strains. J. Bacteriol. 155:831-838. [DOI] [PMC free article] [PubMed] [Google Scholar]
- 9.de Bruijn, F. J. 1992. Use of repetitive (repetitive extragenic palindromic and enterobacterial repetitive intergeneric consensus) sequences and the polymerase chain reaction to fingerprint the genomes of Rhizobium meliloti isolates and other soil bacteria. Appl. Environ. Microbiol. 58:2180-2187. [DOI] [PMC free article] [PubMed] [Google Scholar]
- 10.Deziel, E., Y. Comeau, and R. Villemur. 2001. Initiation of biofilm formation by Pseudomonas aeruginosa 57RP correlates with emergence of hyperpiliated and highly adherent phenotypic variants deficient in swimming, swarming, and twitching motilities. J. Bacteriol. 183:1195-1204. [DOI] [PMC free article] [PubMed] [Google Scholar]
- 11.Frontera-Suau, R. 2000. Impact of microbial community structure on crude oil biodegradation. Ph.D. dissertation. Medical University of South Carolina, Charleston.
- 12.Goswami, P., and H. D. Singh. 1991. Different modes of hydrocarbon uptake by two Pseudomonas species. Biotechnol. Bioeng. 37:1-11. [DOI] [PubMed] [Google Scholar]
- 13.Gray, G. W., and S. G. Wilkinson. 1965. The effect of ethylenediaminetetra-acetic acid on the cell walls of some gram-negative bacteria. J. Gen. Microbiol. 39:385-399. [DOI] [PubMed] [Google Scholar]
- 14.Hareland, W. A., R. L. Crawford, P. J. Chapman, and S. Dagley. 1975. Metabolic function and properties of 4-hydroxyphenylacetic acid 1-hydroxylase from Pseudomonas acidovorans. J. Bacteriol. 121:272-285. [DOI] [PMC free article] [PubMed] [Google Scholar]
- 15.Hobbie, J. E., R. J. Daley, and S. Jasper. 1977. Use of nuclepore filters for counting bacteria by fluorescence microscopy. Appl. Environ. Microbiol. 33:1225-1228. [DOI] [PMC free article] [PubMed] [Google Scholar]
- 16.Iwabuchi, N., M. Sunairi, H. Anzai, M. Nakajima, and S. Harayama. 2000. Relationships between colony morphotypes and oil tolerance in Rhodococcus rhodochrous. Appl. Environ. Microbiol. 66:5073-5077. [DOI] [PMC free article] [PubMed] [Google Scholar]
- 17.Kolter, R., D. A. Siegele, and A. Tormo. 1993. The stationary phase of the bacterial life cycle. Annu. Rev. Microbiol. 47:855-874. [DOI] [PubMed] [Google Scholar]
- 18.Kotra, L. P., D. Golemi, N. A. Amro, G. Y. Liu, and S. Mobashery. 1999. Dynamics of the lipopolysaccharide assembly on the surface of Escherichia coli. J. Am. Chem. Soc. 121:8707-8711. [Google Scholar]
- 19.Laemmli, U. K. 1970. Cleavage of structural proteins during the assembly of the head of bacteriophage T4. Nature 227:680-685. [DOI] [PubMed] [Google Scholar]
- 20.Lam, M. Y., E. J. McGroarty, A. M. Kropinski, L. A. MacDonald, S. S. Pedersen, N. Hoiby, and J. S. Lam. 1989. Occurrence of a common lipopolysaccharide antigen in standard and clinical strains of Pseudomonas aeruginosa. J. Clin. Microbiol. 27:962-967. [DOI] [PMC free article] [PubMed] [Google Scholar]
- 21.Leive, L. 1965. Release of lipopolysaccharide by EDTA treatment of E. coli. Biochem. Biophys. Res. Commun. 21:290-296. [DOI] [PubMed] [Google Scholar]
- 22.Makin, S. A., and T. J. Beveridge. 1996. The influence of A-band and B-band lipopolysaccharide on the surface characteristics and adhesion of Pseudomonas aeruginosa to surfaces. Microbiology 142:299-307. [DOI] [PubMed] [Google Scholar]
- 23.Miguez, C. B., T. J. Beveridge, and J. M. Ingram. 1986. Lipopolysaccharide changes and cytoplasmic polyphosphate granule accumulation in Pseudomonas aeruginosa during growth on hexadecane. Can. J. Microbiol. 32:248-253. [DOI] [PubMed] [Google Scholar]
- 24.Morita, R. Y. 1982. Starvation-survival of heterotrophs in the marine environment. Adv. Microb. Ecol. 6:171-198. [Google Scholar]
- 25.Morris, V. J., A. R. Kirby, and A. P. Gunning. 1999. Atomic force microscopy for biologists. Imperial College Press, Covent Garden, London, England.
- 26.Nociari, M. M., M. Catalano, D. Centron Garcia, S. C. Copenhaver, M. L. Vasil, and D. O. Sordelli. 1996. Comparative usefulness of ribotyping, exotoxin A genotyping, and SalI restriction fragment length polymorphism analysis for Pseudomonas aeruginosa lineage assessment. Diagn. Microbiol. Infect. Dis. 24:179-190. [DOI] [PubMed] [Google Scholar]
- 27.Palomar, J., A. M. Leranoz, and M. Vinas. 1995. Serratia marcescens adherence: the effect of O antigen presence. Microbios 81:107-113. [PubMed] [Google Scholar]
- 28.Rivera, M., and E. J. McGroarty. 1989. Analysis of a common-antigen lipopolysaccharide from Pseudomonas aeruginosa. J. Bacteriol. 171:2244-2248. [DOI] [PMC free article] [PubMed] [Google Scholar]
- 29.Rosenberg, M., D. Gutnick, and E. Rosenberg. 1980. Adherence of bacteria to hydrocarbons: a simple method for measuring cell surface hydrophobicity. FEMS Microbiol. Lett. 9:29-33. [Google Scholar]
- 30.Rosenberg, M., and E. Rosenberg. 1981. Role of adherence in growth of Acinetobacter calcoaceticus RAG-1 on hexadecane. J. Bacteriol. 148:51-57. [DOI] [PMC free article] [PubMed] [Google Scholar]
- 31.Singer, M. E., and W. R. Finnerty. 1984. Microbial metabolism of straight-chain and branched alkanes, p. 1-59. In R. M. Atlas (ed.), Petroleum microbiology. Macmillan Publishing Company, New York, N.Y.
- 32.Stinson, R. S., and D. E. Talburt. 1978. Antigenic variation and increase in pathogenicity in Pseudomonas aeruginosa as a result of growth on glucose or n-hexadecane as sole carbon source. Can. J. Microbiol. 24:675-679. [DOI] [PubMed] [Google Scholar]
- 33.Temple, G. S., P. D. Ayling, and S. G. Wilkinson. 1992. Sensitivity of Pseudomonas stutzeri to EDTA: effects of growth parameters and test conditions. Microbios 72:7-16. [PubMed] [Google Scholar]
- 34.Towbin, H., T. Staehelin, and J. Gordon. 1979. Electrophoretic transfer of proteins from polyacrylamide gels to nitrocellulose sheets: procedure and some applications. Proc. Natl. Acad. Sci. USA 76:4350-4354. [DOI] [PMC free article] [PubMed] [Google Scholar]
- 35.Tsai, C. M., and C. E. Frasch. 1982. A sensitive silver stain for detecting lipopolysaccharides in polyacrylamide gels. Anal. Biochem. 119:115-119. [DOI] [PubMed] [Google Scholar]
- 36.Versalovic, J., T. Koeuth, and J. R. Lupski. 1991. Distribution of repetitive DNA sequences in eubacteria and application to fingerprinting of bacterial genomes. Nucleic Acids Res. 19:6823-6831. [DOI] [PMC free article] [PubMed] [Google Scholar]
- 37.Wilkinson, S. G. 1983. Composition and structure of lipopolysaccharides from Pseudomonas aeruginosa. Rev. Infect. Dis. 5:S941-S949. [DOI] [PubMed] [Google Scholar]
- 38.Wilson, K. 1994. Preparation of genomic DNA from bacteria, p. 2.4.1-2.4.5. In F. A. Ausubel, R. Brent, R. E. Kingston, D. D. Moore, J. G. Seidman, J. A. Smith, and K. Struhl (ed.), Current protocols in molecular biology. John Wiley and Sons, New York, N.Y. [DOI] [PubMed]


