Abstract
For direct and efficient ethanol production from cellulosic materials, we constructed a novel cellulose-degrading yeast strain by genetically codisplaying two cellulolytic enzymes on the cell surface of Saccharomyces cerevisiae. By using a cell surface engineering system based on α-agglutinin, endoglucanase II (EGII) from the filamentous fungus Trichoderma reesei QM9414 was displayed on the cell surface as a fusion protein containing an RGSHis6 (Arg-Gly-Ser-His6) peptide tag in the N-terminal region. EGII activity was detected in the cell pellet fraction but not in the culture supernatant. Localization of the RGSHis6-EGII-α-agglutinin fusion protein on the cell surface was confirmed by immunofluorescence microscopy. The yeast strain displaying EGII showed significantly elevated hydrolytic activity toward barley β-glucan, a linear polysaccharide composed of an average of 1,200 glucose residues. In a further step, EGII and β-glucosidase 1 from Aspergillus aculeatus No. F-50 were codisplayed on the cell surface. The resulting yeast cells could grow in synthetic medium containing β-glucan as the sole carbon source and could directly ferment 45 g of β-glucan per liter to produce 16.5 g of ethanol per liter within about 50 h. The yield in terms of grams of ethanol produced per gram of carbohydrate utilized was 0.48 g/g, which corresponds to 93.3% of the theoretical yield. This result indicates that efficient simultaneous saccharification and fermentation of cellulose to ethanol are carried out by a recombinant yeast cells displaying cellulolytic enzymes.
Biomass, which represents the bioconversion of carbon dioxide into green plants, is the world's most attractive energy resource because it is the most abundant and renewable resource. In recent years it has been proposed that instead of traditional feedstocks (starch crops), cellulosic biomass (cellulose and hemicellulose), such as agricultural and forestry residues, waste paper, and industrial wastes, could be used as an ideally inexpensive and abundantly available source of sugar for fermentation into the sustainable transportation fuel ethanol. The carbon dioxide released by the combustion of biofuels, of which ethanol is the most widely used today, is recycled, and the use of these fuels in transportation therefore offers an alternative to fossil fuels that could help provide solutions to many environmental problems.
The filamentous fungus Trichoderma reesei is a well-known cellulolytic organism and produces a family of different cellulolytic enzymes, including endoglucanases, exocellobiohydrolases, and β-glucosidases. Endoglucanases are able to hydrolyze amorphous, soluble, and substituted celluloses randomly. Cellobiohydrolases are able to degrade crystalline cellulose and to produce cellobiose from reducing or nonreducing ends. These two types of enzymes act synergistically to degrade cellulose to cellobiose and other short cellooligosaccharides. β-Glucosidases hydrolyze cellobiose and other cellooligosaccharides produced by cellulases to glucose (5, 20). Since the yeast Saccharomyces cerevisiae cannot utilize cellulosic materials, these materials must first undergo saccharification to glucose before ethanol production can take place. Various cellulase and β-glucosidase genes have been expressed in S. cerevisiae with the aim of direct ethanol production from cellulose (18). Fermentation of cellulose to ethanol by recombinant yeast cells has, however, not been successful, although some recombinant yeast strains are able to assimilate soluble cellooligosaccharides (two to six glucose units) as carbon sources (3, 9, 18).
Recently, yeast strains displaying various proteins on the cell surface have been developed by using genetic engineering techniques (2, 8, 9, 10, 12, 17). Yeast strains which codisplay cellulolytic enzymes on the cell surface through cell surface engineering could mimic cellulosome, which is a multienzyme complex consisting of cellulase and hemicellulase organized on the bacterial cell surface (1, 13). We attempted to convert barley β-glucan into ethanol by constructing cellulose-degrading yeast cells which codisplay Aspergillus aculeatus β-glucosidase 1 (BGL1) and T. reesei endoglucanase II (EGII). Barley β-glucan is a linear, soluble polysaccharide composed of an average of 1,200 glucose residues joined by about 70% β-1,4 glycosidic linkages and about 30% β-1,3 glycosidic linkages. There are no previous reports of direct fermentation into ethanol of cellulosic material such as β-glucan, and thus the present research represents the first attempt to do this. The process described here could become the basis for eventual direct ethanol production from insoluble cellulosic materials.
MATERIALS AND METHODS
Strains and media.
Escherichia coli NovaBlue {endA1 hsdR17 (rK12− mK12+) supE44 thi-1 gyrA96 relA1 lac recA1/F′ [proAB+ lacIqZΔM15::Tn10 (Tetr)]} (Novagen, Inc., Madison, Wis.) was used as the host strain for the recombinant DNA manipulations. The yeast S. cerevisiae MT8-1 (MATa ade his3 leu2 trp1 ura3) was used for cell surface display and fermentation (15). E. coli was grown in Luria-Bertani medium (10 g of tryptone per liter, 5 g of yeast extract per liter, 5 g of sodium chloride per liter) containing 100 μg of ampicillin per ml. Following precultivation, the yeast cells were aerobically cultivated at 30°C in synthetic medium (6.7 g of yeast nitrogen base without amino acids [Difco Laboratories, Detroit, Mich.] per liter with appropriate supplements) to which 20 g of glucose per liter was added as the sole carbon source (SD medium).
Construction of the plasmid for cell surface display.
Plasmid pBG211 for cell surface display of A. aculeatus No. F-50 BGL1 was constructed previously (9). Plasmid pEG23u31H6 for cell surface expression of the EGII gene (egl2) from T. reesei QM9414 was constructed as follows. A 2.66-kbp DNA fragment composed of the glyceraldehyde-3-phosphate dehydrogenase (GAPDH) promoter from S. cerevisiae, the secretion signal sequence of the glucoamylase gene from Rhizopus oryzae, the 3′ half of the region encoding 320 amino acids of α-agglutinin, and 446 bp of the 3′ flanking region was prepared by PCR performed with primers 5′-GGAAACAGCTATGACCATGATATCGCCAAGCGCGCAATTA-3′ and 5′-TTGTAAAACGATATCCAGTGAGCGCGCGTAATACGACTCA-3′) and with plasmid pICAS1 (9) as the template and then digested with EcoRV. The resulting EcoRV-EcoRV DNA fragment was substituted for the PvuII-BamHI section of plasmid pURI24 (16) and for the PvuII-PvuII section of plasmid pRS403 (14) with URA3 and HIS3 as the selective markers, respectively. The resulting plasmids for cell surface display were designated pMUCS and pIHCS. Control plasmid pHCS5 for plasmid pBG211 (9) was constructed by introducing the 2.24-kbp EcoRI-EcoRI DNA fragment of plasmid pWI3 (6) containing a part of 2μm DNA into the AatII site of plasmid pIHCS.
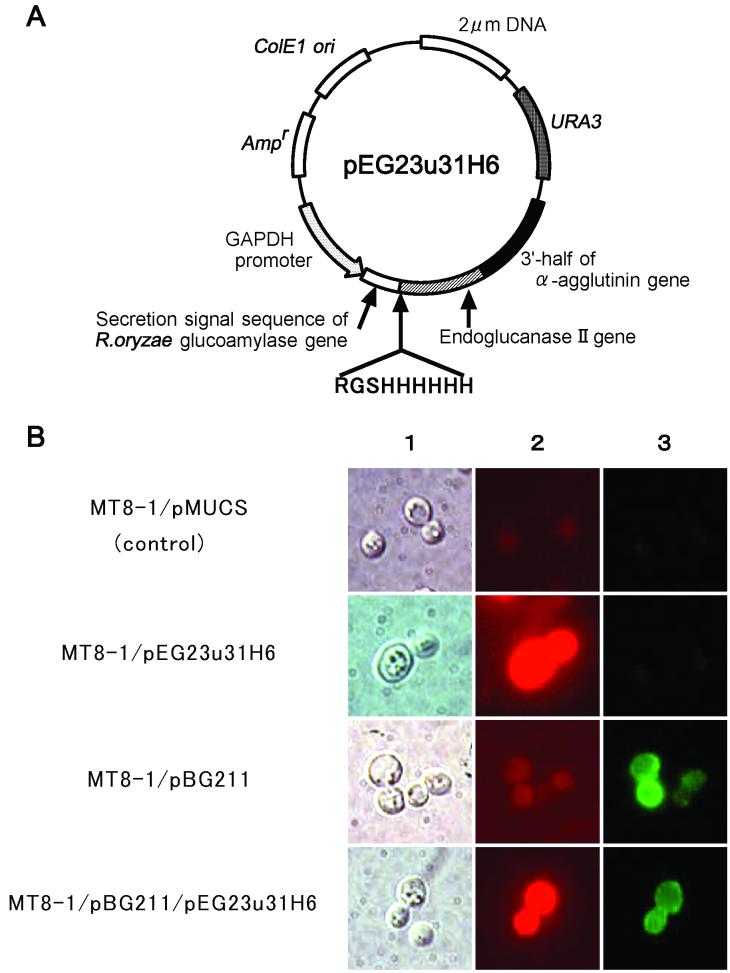
The 1.23-kbp BglII-XhoI DNA fragment encoding the egl2 gene fused with the peptide tag RGSHis6 (Arg-Gly-Ser-His6) at the N terminus was prepared by PCR performed with primers 5′-CCATTGCTGCAGATCTCAAGAGGATCCCATCACCATCACCATCACCAGCAGACTGTCTGGGGCCA-3′ and 5′-GACAGCTCGAGGGCTTTCTTGCGAGACACG-3′) and with the first-strand cDNA prepared from T. reesei QM9414 as the template, as described previously (11). This DNA fragment was introduced into the BglII-XhoI site of plasmid pMUCS. The resulting plasmid was designated pEG23u31H6 (Fig. 1A).
FIG. 1.
(A) Expression plasmid for display of T. reesei EGII (pEG23u31H6) on the yeast cell surface. (B) Immunofluorescence labeling of transformed cells: Nomarski differential interference micrographs (column 1) and immunofluorescence micrographs (columns 2 and 3) of S. cerevisiae MT8-1/pMUCS (control), MT8-1/pEG23u31H6, MT8-1/pBG211 and MT8-1/pBG211/pEG23u31H6. Cells were labeled with mouse anti-RGSHis4 antibody and goat anti-mouse IgG conjugated with Alexa Fluor 546 and with rabbit anti-A. aculeatus BGL1 antibody and goat anti-rabbit IgG conjugated with FITC.
Yeast transformation.
Transformation of plasmids pEG23u31H6, pMUCS, pBG211, and pHCS5 into S. cerevisiae MT8-1 was carried out by the lithium acetate method by using the YEASTMAKER yeast transformation system (Clontech Laboratories, Inc., Palo Alto, Calif.).
Immunofluorescence microscopy.
Immunofluorescence microscopy was performed as described previously (7). Immunostaining was performed as follows. Yeast cells were cultivated in SD medium at 30°C for 48 h, collected by centrifugation at 6,000 × g for 5 min at 4°C, and washed with phosphate-buffered saline (PBS) (50 mM phosphate, 150 mM sodium chloride; pH 7.4). After resuspension in PBS containing 10 g of bovine serum albumin per liter and incubation for 30 min at room temperature (optical density at 600 nm [OD600], 10), the cells and the primary antibody were incubated in PBS containing 10 g of bovine serum albumin per liter for 1.5 h at room temperature. As primary antibodies, mouse immunoglobulin G (IgG) against RGSHis4 (QIAGEN, Valencia, Calif.) and rabbit IgG against A. aculeatus BGL1 were used at dilution rates of 1:500 and 1:1,000. The cells were then incubated for 1 h at room temperature with the second antibody, a 1:300 dilution rate of goat anti-mouse IgG(H+L) conjugated with Alexa Fluor 546 and goat anti-rabbit IgG(H+L) conjugated with fluorescein isothiocyanate (FITC) (Molecular Probes, Inc., Eugene, Oreg.). After the cells were washed with PBS, they were observed by microscopy.
Enzyme assays.
Endoglucanase activity was measured in 50 mM sodium acetate buffer (pH 5.0) at 30°C with 1 g of barley β-glucan (Sigma Chemical Co., St. Louis, Mo.) per liter as the substrate. After cultivation in SD medium for 48 h at 30°C, cells were collected by centrifugation at 6,000 × g for 10 min at 4°C and washed with distilled water twice. Then the cells were resuspended in a reaction mixture, and the OD600 was adjusted to 10. After the hydrolysis reaction, supernatants were separated by centrifugation at 20,000 × g for 3 min at 4°C and used for measurement of the amount of reducing sugar and for high-performance liquid chromatography (HPLC) analysis of hydrolysis products as described below. The amount of reducing sugar released from the substrate was determined by determining the number of glucose equivalents by the Somogyi-Nelson method (19). One unit of enzyme activity was defined as the amount of enzyme that released 1 μmol of reducing sugar as glucose equivalents from the substrate per min.
β-Glucosidase activity was measured in 50 mM sodium acetate buffer (pH 5.0) at 30°C with 0.85 mM p-nitrophenyl-β-d-glucopyranoside (Nacalai Tesque, Inc., Kyoto, Japan) as the substrate. The OD600 of the reaction mixture was adjusted to 1.0. After the reaction, supernatants were separated by centrifugation at 20,000 × g for 3 min at 4°C, and the p-nitrophenol released was determined by measuring the absorbance at 400 nm. One unit of enzyme activity was defined as the amount of enzyme that released 1 μmol of p-nitrophenol from the substrate per min.
HPLC analysis of hydrolysis products.
HPLC analysis of the hydrolysis products was performed by using a refractive index detector (model RID-10A; Shimadzu, Kyoto, Japan). The column used for separation was a Cosmosil 5NH2-MS packed column (Nacalai Tesque, Inc.). The HPLC was operated at 30°C by using acetonitrile-water (70:30, vol/vol) at a flow rate of 0.7 ml/min as the mobile phase.
Fermentation.
The transformants were aerobically precultivated for 24 h and then cultivated in SD medium for 48 h at 30°C. The culture supernatant and cell pellets were separated by centrifugation at 6,000 × g for 10 min at 4°C, the cell pellets were inoculated into synthetic medium containing 45 g of barley β-glucan per liter as the sole carbon source, and fermentation was carried out anaerobically at 30°C. The OD600 of the fermentation medium was 17.8. Ethanol, total sugar (soluble sugar), and glucose concentrations were measured by using gas chromatography, the phenol-sulfuric acid method (4) (total sugar measured as glucose equivalents), and the Glucose CII test (Wako Pure Chemical Industries, Ltd., Osaka, Japan), respectively. A gas chromatograph (model GC-8A; Shimadzu) fitted with a flame ionization detector was operated under the following conditions: glass column (3.0 mm by 3.1 m) packed with Unisole 3000 (GL Science, Tokyo, Japan); temperature of column, injector, and detector, 180°C; and nitrogen carrier gas flow rate, 25 ml/min.
RESULTS
Codisplay of BGL1 and EGII.
To ferment cellulose to ethanol, we constructed a yeast strain codisplaying EGII and BGL1. Plasmid pEG23u31H6, for expression of the RGSHis6-EGII-α-agglutinin fusion gene on the yeast cell surface (Fig. 1A), was transformed into S. cerevisiae MT8-1 and a strain displaying BGL1 on the cell surface (MT8-1/pBG211), and the resultant transformants were designated MT8-1/pEG23u31H6 and MT8-1/pBG211/pEG23u31H6, respectively.
To confirm that EGII and BGL1 were codisplayed on the cell surface, immunofluorescence labeling of the cells was carried out by using mouse anti-RGSHis4 antibody and rabbit anti-A. aculeatus BGL1 antibody simultaneously as the primary antibody. As shown in Fig. 1B, the red fluorescence of Alexa Fluor 546-conjugated goat anti-mouse IgG was observed on strains MT8-1/pEG23u31H6 and MT8-1/pBG211/pEG23u31H6, and the green fluorescence of FITC-conjugated goat anti-rabbit IgG was observed on strains MT8-1/pBG211 and MT8-1/pBG211/pEG23u31H6, indicating that EGII and BGL1 were codisplayed on the cell surface of yeast strain MT8-1/pBG211/pEG23u31H6.
Enzyme activity.
The EGII and BGL1 activities of the yeast strains displaying EGII and BGL1 are summarized in Table 1. EGII activity was determined by using β-glucan as the substrate after aerobic cultivation of cells in SD medium for 48 h at 30°C. The yeast strain displaying EGII (MT8-1/pEG23u31H6) and the yeast strain codisplaying BGL1 and EGII (MT8-1/pBG211/pEG23u31H6) showed high levels of EGII activity (3.64 and 5.94 U/g [dry weight] of cells), while no activity was detected in the yeast strain harboring control plasmid pMUCS (MT8-1/pMUCS) or the strain displaying BGL1 (MT8-1/pBG211). EGII activity in the culture supernatant was not detected for any of the strains. These results suggest that active EGII is displayed on the cell surface without leakage into the culture medium. Strain MT8-1/pBG211/pEG23u31H6 showed higher activity than strain MT8-1/pEG23u31H6, probably because β-glucan is hydrolyzed to glucose, a more powerful reducing agent than cellooligosaccharides, by the sequential reactions of EGII and BGL1. The activity of EGII tagged with RGSHis6 at the N terminus (MT8-1/pEG23u31H6) was nearly equal to that of nontagged EGII (data not shown).
TABLE 1.
Distribution of two enzyme activities
| Strain | Activities (U/g [dry wt] of cells) ina
|
|||
|---|---|---|---|---|
| Culture supernatant
|
Cell pellet
|
|||
| EGII | BGL1 | EGII | BGL1 | |
| MT8-1 | NDb | ND | ND | ND |
| MT8-1/pEG23u31H6 | ND | ND | 3.64 | ND |
| MT8-1/pBG211 | ND | ND | ND | 21.3 |
| MT8-1/pBG211/pEG23u31H6 | ND | ND | 5.94 | 16.0 |
The values are averages of five independent experiments.
ND, not detected.
BGL1 activity was determined by using p-nitrophenyl-β-d-glucopyranoside as the substrate. The yeast strain displaying BGL1 (MT8-1/pBG211) and the strain codisplaying BGL1 and EGII (MT8-1/pBG211/pEG23u31H6) showed BGL1 activity (21.3 and 16.0 U/g [dry weight] of cells), while no activity was detected in strains MT8-1/pMUCS (control) and MT8-1/pEG23u31H6. The BGL1 activity of strain MT8-1/pBG211/pEG23u31H6 was 75.2% of that of MT8-1/pBG211.
Analysis of the hydrolysis products.
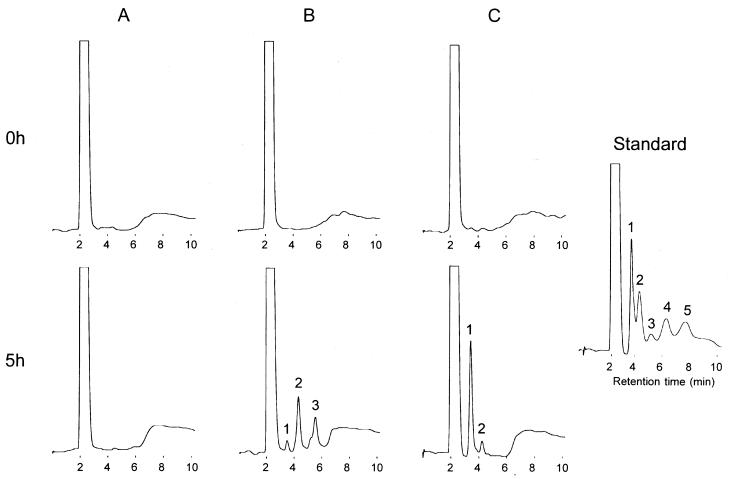
An HPLC analysis was performed to examine the hydrolysis products released from barley β-glucan by the action of the yeast strain displaying EGII (MT8-1/pEG23u31H6) and the strain codisplaying EGII and BGL1 (MT8-1/pBG211/pEG23u31H6). As shown in Fig. 2, cellobiose and cellotriose were detected as the main products of strain MT8-1/pEG23u31H6 (Fig. 2B), but glucose was the main product of yeast strain MT8-1/pBG211/pEG23u31H6 (Fig. 2C). No hydrolysis was observed in the reaction mixture containing the control cells (MT8-1/pMUCS) (Fig. 2A).
FIG. 2.
HPLC analysis of hydrolysis products released from barley β-glucan. (A) MT8-1/pMUCS (control); (B) MT8-1/pEG23u31H6; (C) MT8-1/pBG211/pEG23u31H6. 1, glucose; 2, cellobiose; 3, cellotriose; 4, cellotetraose; 5, cellopentaose.
Growth on β-glucan.
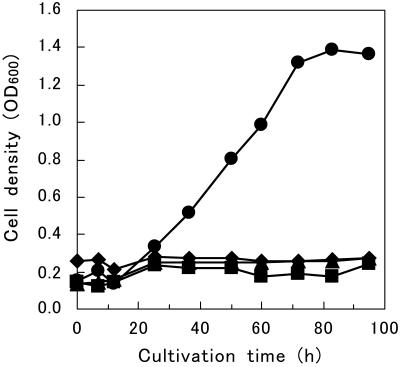
Following precultivation in SD medium, the yeast strain codisplaying EGII and BGL1 (MT8-1/pBG211/pEG23u31H6) was cultivated aerobically in synthetic medium containing 10 g of β-glucan per liter as the sole carbon source. Cell growth was monitored by determining the OD600 of the culture broth. As shown in Fig. 3, strain MT8-1/pBG211/pEG23u31H6 was able to grow on β-glucan and reached an OD600 of about 1.4, but no growth was observed with any of the other strains. Glucose was not detected in the culture medium during cultivation. This result suggests that β-glucan is hydrolyzed to glucose by sequential reactions of EGII and BGL1 and that the resulting glucose is immediately utilized by the yeast.
FIG. 3.
Time course of cell growth in synthetic medium containing barley β-glucan as the sole carbon source. Symbols: ♦, MT8-1/pHCS5/pMUCS (control); ▪, MT8-1/pHCS5/pEG23u31H6; ▴, MT8-1/pBG211/pMUCS; •, MT8-1/pBG211/pEG23u31H6. Cell growth was monitored by determining the OD600 of the culture broth. The data points represent the averages of two independent experiments.
Ethanol production and production efficiency.
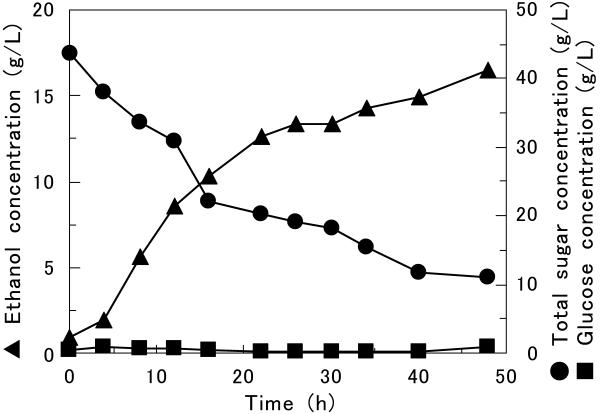
Direct fermentation of β-glucan to ethanol was performed by using the yeast strain codisplaying BGL1 and EGII (MT8-1/pBG211/pEG23u31H6). The OD600 of the fermentation medium (synthetic medium containing 45 g of β-glucan per liter as the sole carbon source) was adjusted to approximately 18. The highest ethanol concentration was around 16.5 g/liter after 48 h of fermentation (Fig. 4). Since the ethanol concentration increased as the total sugar concentration decreased, production of ethanol occurred by simultaneous saccharification and fermentation of β-glucan by MT8-1/pBG211/pEG23u31H6. The ethanol productivity was 0.53 g/liter/h. The yield of ethanol produced was 0.48 g per g of sugar consumed. This corresponds to 93.3% of the theoretical yield (0.51 g of ethanol produced per g of sugar consumed), which was calculated by using the equation of the Embden-Meyerhof pathway. Glucose did not accumulate in the medium during fermentation.
FIG. 4.
Time course of production of ethanol from barley β-glucan as the sole carbon source by MT8-1/pBG211/pEG23u31H6. Symbols: ▴, ethanol; •, total sugar; ▪, glucose in culture broth. The data points represent the averages of two independent experiments.
DISCUSSION
We constructed a novel cellulose-degrading yeast strain with the ability to directly convert β-glucan to ethanol without pretreatment. Although sequential or simultaneous saccharification and fermentation of cellulose with bacterial or fungal cellulases and yeast have been examined previously, the conventional methods have economic disadvantages, such as the production of cellulase and low productivity, and have not been commercialized yet. To overcome these problems, many researchers have constructed yeast strains which produce cellulases and β-glucosidase for direct fermentation. However, attempts to produce ethanol from cellulose have been unsuccessful (3, 9, 18). As demonstrated by the results shown in Fig. 4, this is the first report of direct and efficient ethanol fermentation from cellulosic material with a recombinant yeast strain without pretreatment.
The cellulose-degrading yeast strain which codisplays active EGII and BGL1 on the cell surface was developed with a cell surface engineering system by using α-agglutinin. As summarized in Table 1, the β-glucosidase activity of the yeast strain codisplaying EGII and BGL1 (MT8-1/pBG211/pEG23u31H6) was 75.2% of the β-glucosidase activity of the yeast strain displaying BGL1 (MT8-1/pBG211). Interestingly, flow cytometry analysis of fluorescence-labeled yeast cells also showed that the mean fluorescence intensity of strain MT8-1/pBG211/pEG23u31H6 was 75.9% of the mean fluorescence intensity of strain MT8-1/pBG211 and 82.3% of the mean fluorescence intensity of the yeast strain displaying EGII (MT8-1/pEG23u31H6) (data not shown). This result indicates that the sum of the numbers of the EGII and BGL1 molecules in the codisplay strain is larger than the number of EGII or BGL1 molecules in a single-display strain.
As shown in Fig. 2, HPLC analysis demonstrated that the main hydrolysis products produced by yeast cells displaying EGII were cellobiose and cellotriose and that the main hydrolysis product produced by yeast cells displaying EGII and BGL1 was glucose. Due to the codisplay of EGII and BGL1, β-glucan in the fermentation medium was sequentially hydrolyzed to glucose on the yeast cell surface, immediately utilized, and converted to ethanol by intracellular enzymes. The cell surface-engineered yeast strain could thus grow on β-glucan as a sole carbon source (Fig. 3) and could ferment β-glucan to ethanol (Fig. 4). A high yield (93.3% of the theoretical total yield) and high productivity (0.53 g/liter/h) were achieved for direct ethanol production from β-glucan. We compared these results with the results for fermentation of glucose with wild-type strain S. cerevisiae MT8-1 in synthetic medium by using the same method. When the data for ethanol production from β-glucan and glucose were examined, there was no difference in the yields of ethanol produced. On the other hand, ethanol productivity from β-glucan (0.53 g/liter/h) was lower than ethanol productivity from glucose (1.39 g/liter/h). This was probably because hydrolysis of β-glucan to glucose by cell surface-displayed EGII and BGL1 is the rate-limiting step.
As described above, we demonstrated that direct conversion of barley β-glucan to ethanol can be efficiently achieved by using a yeast strain codisplaying EGII and BGL1, which is the prototype for a cellulose-degrading yeast. The present study could serve as the basis for direct production of ethanol from insoluble celluloses. Meanwhile, further work is needed to improve cellulolytic activity and productivity.
Acknowledgments
This work was financed by the New Energy and Industrial Technology Development Organization (NEDO), Japan.
REFERENCES
- 1.Bayer, E. A., E. Morag, and R. Lamed. 1994. The cellulosome—a treasure-trove for biotechnology. Trends Biotechnol. 12:378-386. [DOI] [PubMed] [Google Scholar]
- 2.Boder, E. T., and K. D. Wittrup. 1997. Yeast surface display for screening combinatorial polypeptide libraries. Nat. Biotechnol. 15:553-557. [DOI] [PubMed] [Google Scholar]
- 3.Cho, K. M., Y. J. Yoo, and H. S. Kang. 1999. δ-Integration of endo/exo-glucanase and β-glucosidase genes into the yeast chromosomes for direct conversion of cellulose to ethanol. Enzyme Microb. Technol. 25:23-30. [Google Scholar]
- 4.Dubois, M., K. A. Gilles, J. K. Hamilton, P. A. Reberse, and F. Smith. 1956. Colorimetric method for determination of sugars and related substances. Anal. Chem. 28:350-356. [Google Scholar]
- 5.Henrissat, B., H. Driguez, C. Viet, and M. Schülein. 1985. Synergism of cellulases from Trichoderma reesei in the degradation of cellulose. Bio/Technology 3:722-726. [Google Scholar]
- 6.Kanai, T., H. Atomi, K. Umemura, H. Ueno, Y. Teranishi, M. Ueda, and A. Tanaka. 1996. A novel heterologous gene expression system in Saccharomyces cerevisiae using the isocitrate lyase gene promoter from Candida tropicalis. Appl. Microbiol. Biotechnol. 44:759-765. [DOI] [PubMed] [Google Scholar]
- 7.Kobori, H., M. Sato, and M. Osumi. 1992. Relationship of actin organization to growth in the two forms of the dimorphic yeast Candida tropicalis. Protoplasma 167:193-204. [Google Scholar]
- 8.Kondo, A., H. Shigechi, M. Abe, K. Uyama, T. Matsumoto, S. Takahashi, M. Ueda, A. Tanaka, M. Kishimoto, and H. Fukuda. 2002. High-level ethanol production from starch by a flocculent Saccharomyces cerevisiae strain displaying cell-surface glucoamylase. Appl. Microbiol. Biotechnol. 58:291-296. [DOI] [PubMed] [Google Scholar]
- 9.Murai, T., M. Ueda, T. Kawaguchi, M. Arai, and A. Tanaka. 1998. Assimilation of cellooligosaccharides by a cell surface-engineered yeast expressing β-glucosidase and carboxymethylcellulase from Aspergillus aculeatus. Appl. Environ. Microbiol. 64:4857-4861. [DOI] [PMC free article] [PubMed] [Google Scholar]
- 10.Nakamura, Y., S. Shibasaki, M. Ueda, A. Tanaka, H. Fukuda, and A. Kondo. 2001. Development of novel whole-cell immunoadsorbents by yeast surface display of the IgG-binding domain. Appl. Microbiol. Biotechnol. 57:500-505. [DOI] [PubMed] [Google Scholar]
- 11.Okada, H., K. Tada, T. Sekiya, K. Yokoyama, A. Takahashi, H. Tohda, H. Kumagai, and Y. Morikawa. 1998. Molecular characterization and heterologous expression of the gene encoding a low-molecular-mass endoglucanase from Trichoderma reesei QM9414. Appl. Environ. Microbiol. 64:555-563. [DOI] [PMC free article] [PubMed] [Google Scholar]
- 12.Schreuder, M. P., A. T. A. Mooren, H. Y. Toschka, C. T. Verrips, and F. M. Klis. 1996. Immobilizing proteins on the surface of yeast cells. Trends Biotechnol. 14:115-120. [DOI] [PubMed] [Google Scholar]
- 13.Shoham, Y., R. Lamed, and E. A. Bayer. 1999. The cellulosome concept as an efficient microbial strategy for the degradation of insoluble polysaccharides. Trends Microbiol. 7:275-281. [DOI] [PubMed] [Google Scholar]
- 14.Sikorski, R. S., and P. Hieter. 1989. A system of shuttle vectors and yeast host strains designed for efficient manipulation of DNA in Saccharomyces cerevisiae. Genetics 122:19-27. [DOI] [PMC free article] [PubMed] [Google Scholar]
- 15.Tajima, M., Y. Nogi, and T. Fukasawa. 1985. Primary structure of the Saccharomyces cerevisiae GAL7 gene. Yeast 1:67-77. [DOI] [PubMed] [Google Scholar]
- 16.Takahashi, S., M. Ueda, and A. Tanaka. 2000. Effect of truncation of the C-terminal region of Kex2 endoprotease on processing of the recombinant Rhizopus oryzae lipase precursor in the co-expression system in yeast. J. Mol. Catal. B Enzymes 10:233-240. [Google Scholar]
- 17.Ueda, M., and A. Tanaka. 2000. Genetic immobilization of proteins on the yeast cell surface. Biotechnol. Adv. 18:121-140. [DOI] [PubMed] [Google Scholar]
- 18.Van Rensburg, P., W. H. Van Zyl, and I. S. Pretorius. 1998. Engineering yeast for efficient cellulose degradation. Yeast 14:67-76. [DOI] [PubMed] [Google Scholar]
- 19.Wood, T. M., and K. M. Bhat. 1988. Methods for measuring cellulase activities. Methods Enzymol. 160:87-112. [Google Scholar]
- 20.Woodward, J. 1991. Synergism in cellulase systems. Bioresour. Technol. 36:67-75. [Google Scholar]


