Abstract
The nor-1 gene in the filamentous fungus Aspergillus parasiticus encodes a ketoreductase involved in aflatoxin biosynthesis. To study environmental influences on nor-1 expression, we generated plasmid pAPGUSNNB containing a nor-1 promoter-β-glucuronidase (GUS) (encoded by uidA) reporter fusion with niaD (encodes nitrate reductase) as a selectable marker. niaD transformants of A. parasiticus strain NR-1 (niaD) carried pAPGUSNNB integrated predominantly at the nor-1 or niaD locus. Expression of the native nor-1 and nor-1::GUS reporter was compared in transformants grown under aflatoxin-inducing conditions by Northern and Western analyses and by qualitative and quantitative GUS activity assays. The timing and level of nor-1 promoter function with pAPGUSNNB integrated at nor-1 was similar to that observed for the native nor-1 gene. In contrast, nor-1 promoter activity in pAPGUSNNB and a second nor-1::GUS reporter construct, pBNG3.0, was not detectable when integration occurred at niaD. Because niaD-dependent regulation could account for the absence of expression at niaD, a third chromosomal location was analyzed using pAPGUSNP, which contained nor-1::GUS plus pyrG (encodes OMP decarboxylase) as a selectable marker. GUS expression was detectable only when pAPGUSNP integrated at nor-1 and was not detectable at pyrG, even under growth conditions that required pyrG expression. nor-1::GUS is regulated similarly to the native nor-1 gene when it is integrated at its homologous site within the aflatoxin gene cluster but is not expressed at native nor-1 levels at two locations outside of the aflatoxin gene cluster. We conclude that the GUS reporter system can be used effectively to measure nor-1 promoter activity and that nor-1 is subject to position-dependent regulation in the A. parasiticus chromosome.
Aflatoxins are highly toxic secondary metabolites produced predominantly by the imperfect fungi Aspergillus flavus, A. parasiticus, and A. nomius (4–6, 18, 23). These toxins frequently contaminate food and feed crops, including peanuts, corn, cottonseed, and tree nuts, and generate a large health and economic impact in the United States and in other countries (4). To help eliminate aflatoxin contamination of food and feed, we have studied the mechanisms that regulate aflatoxin gene expression. This knowledge will be used to design novel, effective control strategies to reduce aflatoxin contamination of crops in the field and during storage.
Aflatoxin synthesis requires at least 16 enzyme activities (16) encoded by up to 25 individual genes (10). These genes are clustered in A. flavus, A. parasiticus, and A. nidulans (A. nidulans synthesizes the late aflatoxin pathway intermediate sterigmatocystin) (4, 10, 16, 23, 24, 27). It was previously hypothesized that clustering of aflatoxin genes may allow coregulation in response to environmental cues, although no conclusive data were reported (23).
Preliminary evidence for a role for clustering in aflatoxin gene regulation was reported by Liang et al. (14). The ver-1 promoter, which drives expression of one aflatoxin structural gene, was fused to uidA (encodes β-glucuronidase [GUS]) (9) to generate a reporter plasmid, pHD6.6, containing niaD (encodes nitrate reductase) as a selectable marker (8). pHD6.6 was transformed into A. parasiticus NR-1 (niaD), resulting in integration predominantly at the ver-1 or niaD locus via homologous recombination. Single-copy integration of pHD6.6 at niaD resulted in a 500-fold reduction in ver-1 promoter activity when compared with single-copy integration at the ver-1 locus; however, the temporal pattern of expression appeared to be similar at both loci. One explanation for reduced ver-1 promoter function at the niaD locus is that the location in the aflatoxin cluster results in positive, position-dependent regulation of ver-1 expression. An alternative hypothesis is that expression of ver-1 integrated at niaD is negatively influenced by niaD regulation. In A. nidulans, niaD expression is under dual control: (i) nitrogen catabolite repression is mediated by areA, and (ii) pathway specific induction is mediated by nirA (17). In the absence of ammonia or glutamine and in the presence of nitrate, niaD is expressed. Under the rich growth conditions utilized by Liang et al. (14), niaD may have been repressed, and therefore the lack of ver-1 expression at the niaD site could have resulted from niaD-dependent regulation.
Our goals in this study were (i) to generate a nor-1::GUS reporter construct and validate its use for monitoring effects of growth environment on nor-1 promoter function and (ii) to monitor nor-1 promoter activity when integrated at different chromosomal loci. The data demonstrate the utility of the GUS reporter as a sensitive and reproducible means to monitor environmental influences on nor-1 expression. The cloned nor-1 promoter functioned similarly to the native nor-1 promoter at its appropriate location within the aflatoxin gene cluster, but not outside this cluster, providing us with clear supporting evidence for the hypothesis that the aflatoxin gene cluster exerts a positive position-dependent regulatory influence on the nor-1 promoter.
MATERIALS AND METHODS
Strains and growth conditions.
Escherichia coli DH5α F′e [F′ endA1 hsdR17 (rk− mk−) supE44 thi-1 recA1 gyrA (Nalr) ΔrelA1 (lacZYA argF)u169:(m80 ΔlacZ M15)] (Gibco BRL, Life Technologies Inc., Rockville, Md.) was used to amplify plasmid DNA using standard procedures (1). A. parasiticus NRRL 5862 (SU1; ATCC 56775) was used as the wild-type aflatoxin-producing strain. A. parasiticus NR-1 (niaD) was derived from A. parasiticus SU1 by spontaneous mutation (8) and served as the recipient strain for reporter plasmids containing the niaD selectable marker (pAPGUSNNB; pBNG3.0). A. parasiticus CS10 (wh-1 ver-1 pyrG) (20) was derived from A. parasiticus ATCC 36537 (wh-1 ver-1) by nitrosoguanidine mutagenesis and was used as a recipient for the reporter construct carrying the pyrG selectable marker (pAPGUSNP).
To measure nor-1 promoter activity via GUS activity assay, to analyze dry weight, to quantify aflatoxin accumulation, and to isolate RNA and protein, fungi were grown in liquid shake culture (batch fermentation) at 29°C in the dark, with shaking at 150 rpm as previously described (14). The culture media consisted of YES liquid (2% yeast extract, 6% sucrose; pH 5.8) and solid medium (1.5% agar). To grow the recipient strain CS10, YES medium or Czapek-Dox medium (CZ; Difco, Detroit, Mich.) was supplemented with uridine (100 μg/ml).
Plasmid constructs. (i) pAPGUSNNB.
The pAPGUSNNB nor-1::GUS fusion construct was derived from pAPGUSN (Fig. 1A) by insertion of a 7.4-kb SalI/XhoI fragment carrying niaD from A. parasiticus (8). This restriction fragment was isolated from plasmid pSL82 (8). The nor-1 promoter region (5′ nor-1) consists of a 3-kb HindIII DNA restriction fragment carrying flanking sequences, promoter, and the first 21 amino acid residues of Nor-1 fused in frame to uidA from E. coli (9). The nor-1 terminator region (3′ nor-1) is a 1.8-kb EcoRI/SalI genomic DNA fragment containing the last six amino acids of Nor-1, the transcription terminator, and flanking sequences. Note that niaD is transcribed from the opposite DNA strand as nor-1::GUS (divergent promoters).
FIG. 1.
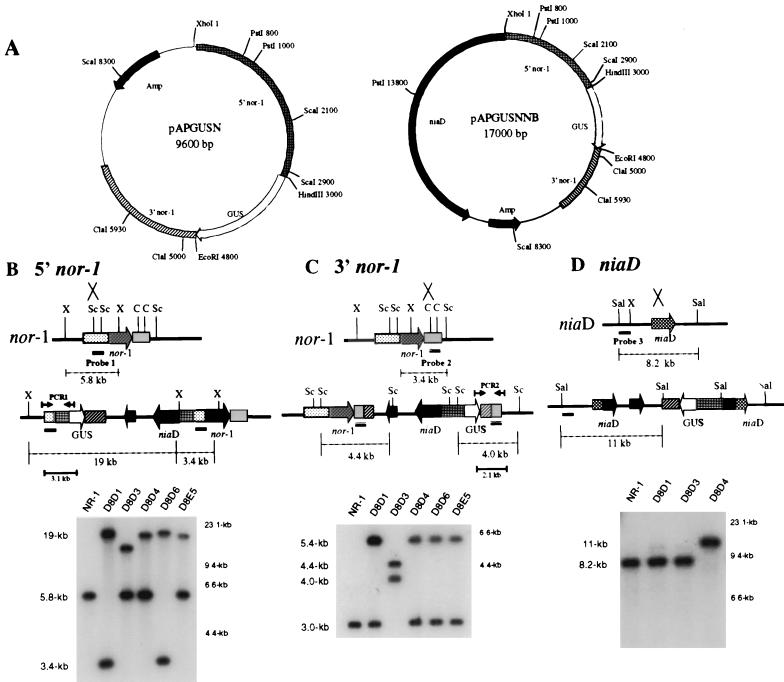
Southern hybridization analysis of site of integration in pAPGUSNNB transformants. (A) Restriction endonuclease maps of pAPGUSN and pAPGUSNNB. Only restriction endonuclease sites relevant to this study are shown. (B) Schematic for Southern hybridization and PCR analyses of pAPGUSNNB integration into the 5′ region of nor-1 and Southern hybridization data. A. parasiticus genomic DNA was digested with XhoI and probed with probe 1. Single-crossover integration of pAPGUSNNB into the 5′ region of nor-1 results in two bands, of 19 and 3.4 kb, and the disappearance of the 5.8-kb wild-type band. (C) Schematic for Southern hybridization and PCR analysis of pAPGUSNNB integration into the 3′ region of nor-1 and Southern hybridization data. Genomic DNA was digested with ScaI and probed with probe 2. Single-crossover integration of pAPGUSNNB into the 3′ region of nor-1 results in two bands, of 4.0 and 4.4 kb, and the disappearance of the 3.0-kb wild-type band. (D) Schematic for Southern hybridization and PCR analysis of pAPGUSNNB integration into niaD and Southern hybridization data. Genomic DNA was digested with SalI and probed with probe 3. Single-crossover integration of pAPGUSNNB into niaD results in an 11-kb Southern hybridization signal and the disappearance of the 8.2-kb wild-type band. Abbreviations: X, XhoI; Sc, ScaI; C, ClaI; Sal, SalI. The numbers in kilobases to the right of the Southern blots in panels B, C, and D represent molecular size markers. The numbers in kilobases to the left represent the sizes of actual restriction fragments observed in the analysis.
(ii) pAPGUSNP.
pAPGUSN was digested with NheI and the ends were filled in with the Klenow fragment of DNA polymerase I (Roche Molecular Biochemicals, Indianapolis, Ind.). The 2.5-kb pyrG gene was amplified by PCR with Taq DNA polymerase (Gibco BRL), pPG3J (20) as template, and appropriate primers (5′-GTAGAAGTTGTTCAGTAGCTGATGG-3′ and 5′-CGAGTATCACAGTCAGGACTCCACG-3′). The resulting PCR fragment was end polished by Pfu polymerase (Stratagene, LaJolla, Calif.) and blunt-end ligated into pAPGUSN to generate pAPGUSNP.
(iii) pBNG3.0.
pNEB193 (New England Biolabs, Beverly, Mass.) was first cut with BamHI, the protruding ends were filled in by Klenow fragment, and a NotI linker (5′-AGCGGCCGCT-3′) was ligated onto the blunt ends, creating pNebN1. Next, the 7.4-kb XhoI/SalI fragment from pSL82 (8) containing the niaD gene was ligated into the SalI site in pNebN1 to create pNiaD-A1. To insert the uidA gene (GUS), the reporter construct pAPGUSNNB was utilized as template in a PCR. Primers were designed to amplify a 4-kb fragment from pAPGUSNNB that contained the terminator region, the GUS coding sequence, and the nor-1 coding sequence upstream of the fusion point. The primers carried restriction enzyme sites to facilitate cloning: the 5′ primer (5′-TAGCGGCCGCGATCAAGAGAAGCTCTATACG-3′) contained NotI and the 3′ primer (5′-TTGGCGCGCCCTCGATGATGATGCTCTG-3′) contained AscI. Since the NotI site was located within the coding sequence, care was taken to maintain the correct reading frame. The 4-kb NotI/AscI PCR product was cloned into the NotI and AscI sites in pNiaD-A1, resulting in pNANG-3F. Finally, a 3.0-kb nor-1 promoter piece was amplified by using PCR with pAPGUSNNB as template and appropriate primers with NotI tails (5′-TCGCGGCCGCTAAGTGATCCATTCATTATGTC-3′ and 5′-TTGCGGCCGCTCCTTGTCTCTGTACTGATAAA-3′). In this way, the nor-1 promoter could be easily removed and replaced with other putative promoters to test for function. The nucleotide sequence from pBNG3.0 was analyzed from the nor-1::GUS fusion site to 332 bp upstream from the transcriptional start site and confirmed the correct nucleotide sequence in this reporter construct.
(iv) pGAPN2B.
The pGAPN2B plasmid was used as a control for constitutive GUS expression. It contains the β-tubulin promoter from A. flavus fused in frame to uidA (β-tubulin::GUS) and A. parasiticus niaD as a selectable marker.
Transformation and identification of the site of plasmid integration. (i) Transformation.
For transformation of NR-1, protoplasts were generated and transformed essentially as described previously (8). Selection of transformants was conducted on CZ agar medium with 20% sucrose as an osmotic stabilizer. Agar plates were incubated in the dark at 29°C for 3 to 5 days. The same procedure was used to generate protoplasts for transformation of A. parasiticus CS10 except mycelia were grown in CZ medium supplemented with uridine (100 μg/ml).
(ii) Rapid DNA extraction procedure for PCR analysis.
Transformants were grown until sporulation (usually 3 to 5 days) and conidiospores were transferred to duplicate CZ agar plates using a sterile toothpick or sterile pipette tip. After 3 to 4 days (or as soon as colonies could be observed), colonies were analyzed. A sterile 200-μl plastic pipette tip was used to transfer a portion of the fungal colony (including conidiospores and mycelia) into a microcentrifuge tube containing 100 μl of TE buffer (10 mM Tris-HCl [pH 8.0], 1 mM EDTA). The process was repeated up to three times to ensure that sufficient fungal cells were transferred. Tubes were heated in a boiling water bath for 5 min and placed on ice. The samples were centrifuged at 12,000 × g for 5 min at 4°C. The supernatant (fungal extract) containing DNA was transferred to a new microcentrifuge tube. The extract was diluted with TE buffer (undiluted, 1:5, 1:20, and 1:100). In most assays, 2.5 μl of the 1:5 dilution resulted in good amplification in a 50-μl PCR. The remainder of the fungal extract was stored at −80°C and could be analyzed by PCR for at least 3 months. Diluted samples stored at 4°C could be analyzed for at least 1 week.
(iii) PCR analysis.
PCR analysis was conducted on DNA extracted from A. parasiticus transformants and the recipient strains A. parasiticus CS10 and NR-1. The primer pairs utilized depended upon the plasmid vector used and the site of integration analyzed (Table 1). A 50-μl reaction consisted of 2.5 μl of the diluted fungal extract, 20 mM Tris-HCl (pH 8.8), 10 mM KCl, 10 mM (NH4)2SO4, 0.15% Triton X-100, 0.1 mg of bovine serum albumin per ml, 0.5 to 1.0 μM (each) primer, 200 μM (each) dNTPs, 2.0 to 3.0 mM MgCl2, and either 2.5 U of Pfu Turbo polymerase (2.5 U/μl; Stratagene) or 2.5 U of Taq polymerase (5 U/μl) (Gibco BRL). PCR cycling depended on primer design and the target size (Table 1). PCR was performed in a Gene Ampli System 9600 (Perkin-Elmer) thermal cycler. All PCRs were initiated by a denaturation step at 95°C for 3 min followed by 35 cycles of denaturation, annealing, and extension. Reactions were terminated with an extension reaction at 72°C for 10 min. PCR products were observed by electrophoresis on a 1% agarose gel using standard procedures (1).
TABLE 1.
Primers and PCR parameters for analysis of DNA templates prepared by the boiling method
| Primera | Target size (kb) | Primer sequence (5′-3′) | PCR cycling parameters |
|---|---|---|---|
| PCR1 | |||
| JL99 | 3.1 | TTT CAC GGG TTG GGG TTT CTA CAG G | 95°C for 1 min, 62°C for 1 min, 72°C for 5 min |
| JL100 | 3.1 | GAC GGG GAA CCT CTT TAC AAA CAT C | |
| PCR2 | |||
| JL102 | 2.1 | CGC AAG GTG AGG GTT CGA ACC GAG G | 95°C for 1 min, 68°C for 1 min, 72°C for 3 min |
| JL103 | 2.1 | CCG CAG CAG GGA GGC AAA CAA TGA A | |
| PCR3 | |||
| JL221 | 3.5 | CCA GAA AAT GCG AAG GTA AGT GCT TC | 95°C for 1 min, 55°C for 1 min, 72°C for 5 min |
| JL222 | 3.5 | GCG ACA CGG AAA TGT TGA ATA CTC AT | |
| Control | |||
| JL136 | 1.4 | AGG CTC GAA AGG CGC ATA CGA | 95°C for 1 min, 68°C for 1 min, 72°C for 2 min |
| JL137 | 1.4 | GTG GTC TAC TGC CCA GCC ATC |
PCR1 primers are for integration into the 5′ region of nor-1 (pAPGUSNP, pBNG3.0), PCR2 primers are for integration into the 3′ region of nor-1 (pAPGUSNP, pBNG3.0), PCR3 primers are for integration into pyrG (pAPGUSNP), and control primers are for endogenous vbs exon II (pAPGUSNP).
Measurement of mycelial dry weight and aflatoxin.
Mycelial dry weight and aflatoxin were measured by enzyme-linked immunosorbent assay as described previously (19).
GUS activity assays. (i) Qualitative assay.
Samples of mycelia (either stored frozen at −80°C after harvest or frozen in liquid nitrogen immediately before the assay) were ground with a mortar and pestle in liquid nitrogen. Approximately 100 mg of crushed tissue was mixed with 500 μl of GUS lysis buffer (50 mM NaH2PO4 [pH 7.0], 10 mM EDTA, 0.1% Triton X-100, 0.1% sodium lauryl sulfate, 10 mM β-mercaptoethanol, 25 μg of phenylmethylsulfonyl fluoride per ml) and centrifuged at 12,000 × g at 4°C for 10 min. The protein concentration was determined by the Bradford method (2) using bovine serum albumin as a protein standard and Protein Assay Dye reagent (Bio-Rad Laboratories, Hercules, Calif.) according to the manufacturer’s instructions. One microgram of total protein from each extract was incubated in a 200-μl volume of 2 mM 4-methylumbelliferyl-β-D-glucuronide (MUG) at 37°C for up to 30 min as necessary. To determine GUS activity, the fluorescence of each reaction mixture was measured at an excitation wavelength of 365 nm and an emission wavelength of 455 nm with an SLM-4000 fluorometer (SLM Instruments, Champaign, Ill.). GUS activity was expressed as nanomoles of 4-methylumbelliferone generated per minute per milligram of protein.
Southern and Northern hybridization analyses.
DNA and RNA were isolated and hybridization analyses were conducted essentially as described previously (19) using standard procedures (1). Restriction enzyme digestion and probes used to confirm the site of integration (see Fig. 1, 5, and 8) were as follows.
FIG. 5.
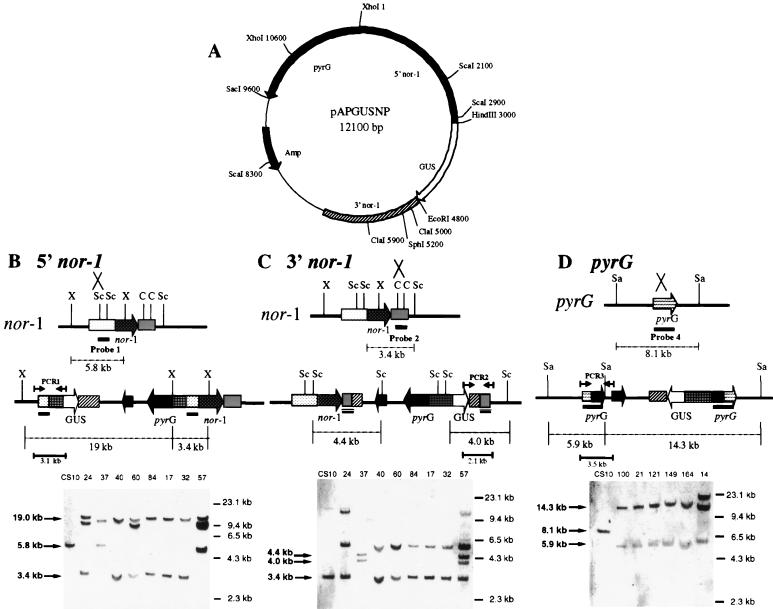
Southern hybridization analysis of site of integration in pAPGUSNP transformants. (A) Restriction endonuclease map of pAPGUSNP. Only restriction endonuclease sites relevant to this study are shown. (B) Schematic for Southern hybridization and PCR analyses of pAPGUSNP integration into the 5′ region of nor-1 and Southern hybridization data. A. parasiticus genomic DNA was digested with XhoI and probed with probe 1. Single-crossover integration of pAPGUSNP into the 5′ region of nor-1 results in two bands, of 19 and 3.4 kb, and the disappearance of the 5.8-kb wild-type band. (C) Schematic for Southern hybridization and PCR analysis of pAPGUSNP integration into the 3′ region of nor-1 and Southern hybridization data. Genomic DNA was digested with ScaI and probed with probe 2. Single-crossover integration of pAPGUSNNB into the 3′ region of nor-1 results in two bands, of 4.0 and 4.4 kb, and the disappearance of the 3.4-kb wild-type band. (D) Schematics for Southern hybridization and PCR analysis of pAPGUSNP integration into pyrG and Southern hybridization data. Genomic DNA was digested with SacI and probed with probe 4. Single-crossover integration of pAPGUSNP into pyrG results in two bands, of 14.3 and 5.9 kb, and the disappearance of the 8.1-kb wild-type band. Abbreviations: X, XhoI; Sc, ScaI; C, ClaI; Sal, SalI. The numbers in kilobases to the right of the Southern blots in panels B, C, and D represent molecular size markers. The numbers in kilobases to the left represent the sizes of actual restriction fragments observed in the analysis.
FIG. 8.
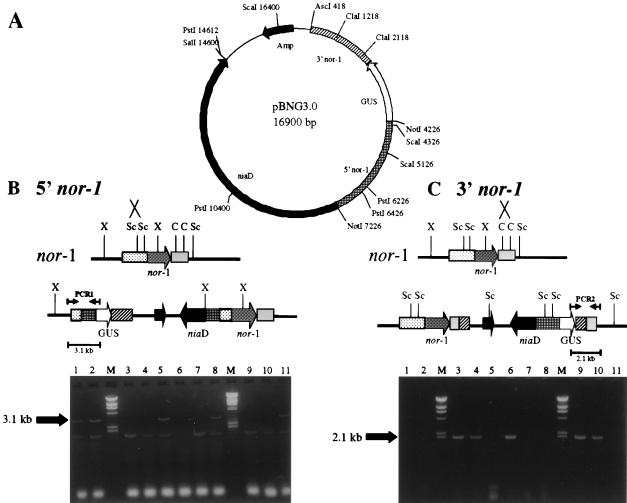
PCR analysis of site of integration in pBNG3.0 transformants. (A) Restriction endonuclease map of pBNG3.0. Only restriction endonuclease sites relevant to this study are shown. Template DNA was prepared using a rapid boiling procedure. Ten GUS+ transformants (lanes 1 to 6 and 8 to 11) and one GUS− transformant (lane 7) were analyzed for both 5′ and 3′ nor-1 integration. (B) Schematic for 5′ nor-1 integration with PCR data. 5′ nor-1 integrants resulted in a 3.1-kb PCR fragment (lanes 1, 2, 5, 8, 11) with PCR1 primers. (C) Schematic for 3′ nor-1 integration with PCR data. 3′ nor-1 integrants resulted in a 2.1-kb PCR fragment (lanes 3, 4, 6, 9, 10) with PCR2 primers. All GUS+ transformants were 5′ or 3′ nor-1 integrants while the GUS− transformant (lane 7) was negative for both 5′ (9B) and 3′ (9C) nor-1 integration. Lanes labeled M in panels B and C represent molecular size markers.
(i) pAPGUSNNB, 5′ nor-1 integration.
Genomic DNA of transformants was digested with XhoI and probed with a 750-bp ScaI fragment (probe 1) isolated from the 5′ region of nor-1 in pAPGUSNNB. DNA from A. parasiticus NR-1 generates a 5.8-kb band, while DNA from a 5′ integrant of pAPGUSNNB generates 19- and 3.4-kb bands.
(ii) pAPGUSNNB, 3′ nor-1 integration.
Genomic DNA of transformants was digested with ScaI and probed with a 900-bp ClaI fragment isolated from the 3′ region of nor-1 in pAPGUSNNB (probe 2). DNA from the recipient strain A. parasiticus NR-1 generates a 3.0-kb band, while DNA from a 3′ integrant of pAPGUSNNB generates 4.0- and 4.4-kb bands.
(iii) pAPGUSNNB, niaD integration.
Genomic DNA of transformants was digested with SalI and probed with an 800-bp SalI/XhoI fragment (probe 3) isolated from niaD in pSL82 (8). DNA from A. parasiticus NR-1 generates an 8.2-kb band, while DNA from a niaD integrant of pAPGUSNNB generates an 11-kb band.
(iv) pBNG3.0, 3′ nor-1 integration.
Genomic DNA of transformants was digested with ScaI and probed with probe 2. DNA from A. parasiticus NR-1 generates a 3.0-kb band, while DNA from a 3′ integrant of pBNG3.0 generates 3.7- and 4.0-kb bands.
(v) pAPGUSNP, 5′ nor-1 integration.
Genomic DNA of transformants was digested with XhoI and probed with probe 1. DNA from A. parasiticus CS10 generates a 5.8-kb band, while DNA from a 5′ integrant of pAPGUSNP generates 13.0- and 3.4-kb bands.
(vi) pAPGUSNP, 3′ nor-1 integration.
Genomic DNA of transformants was digested with ScaI and probed with probe 2. DNA from A. parasiticus CS10 generates a 3.0-kb band, while DNA from a 3′ integrant of pAPGUSNP generates 4.0- and 4.4-kb bands.
(vii) pAPGUSNP, integration at pyrG.
Genomic DNA of transformants was digested with SacI and probed with a 2.5-kb pyrG fragment generated by PCR (probe 4). DNA from A. parasiticus CS10 generates an 8.1-kb band, while DNA from a pyrG integrant generates 5.9- and 14.3-kb bands.
Probes used for analysis of transcript accumulation via Northern analysis were as follows. For the GUS transcript, a 1.7-kb amplification product within the GUS coding region was generated using specific primers (5′-CACCGAAGTTCATGCCAGTCCAGCG-3′ and 5′-CTCGACGGCCTGTGGGCATTCAGTC-3′). The GUS transcript is approximately 2.2 kb in size. For nor-1 transcripts, a 780-bp PCR product was generated from a nor-1 cDNA (29) using specific primers (5′-CGTCCCAAAAGCACC-3′ and 5′-GCGACACGAACCCAG-3′). The nor-1 transcript was approximately 1.3 kb in size, in agreement with a value reported previously (19).
Probes for Southern and Northern analyses were radiolabeled with the Random Primed DNA labeling kit from Boehringer-Mannheim Biochemicals GmbH (Mannheim, Germany) using a protocol provided by the manufacturer. Alternatively, probes were prepared using digoxigenin and a nonradioactive detection kit and procedure (Roche Molecular Biochemicals).
Western blot analysis.
Protein purification and Western blot analysis were conducted essentially as described previously (14). Rabbit polyclonal antibodies for GUS protein were purchased from Clontech Laboratories (Palo Alto, Calif.) and used according to instructions supplied by the manufacturer. Highly specific polyclonal antibodies for Nor-1 have been described previously (28; M. Miller, M. Rarick, R. Zhou, F. Trail, and J. E. Linz, submitted).
RESULTS
Transformation of A. parasiticus NR-1 with pAPGUSNNB and screening by qualitative GUS assay.
Transformation of A. parasiticus strain NR-1 with plasmid pAPGUSNNB in three separate experiments resulted in transformation frequencies of 4.0 × 10⁻⁵, 5.0 × 10⁻⁵, and 5.1 × 10⁻⁵ CFU/protoplast using presumably saturating levels of DNA at 3 to 7 μg per transformation. niaD-positive colonies were screened for GUS activity in a qualitative assay (not shown). Thirty-five of 149 pAPGUSNNB transformants (23%) produced the GUS+ phenotype.
Southern hybridization analysis of pAPGUSNNB transformants.
Transforming DNA can integrate at either homologous or heterologous locations in the genomes of filamentous fungi. Southern hybridization analysis of pAPGUSNNB transformants identified three types of single-crossover recombinants as predicted (Fig. 1). Transformants D8D1 and D8D6 were GUS+ and represented single-crossover integration of pAPGUSNNB into the 5′ region of nor-1 (Fig. 1B). Multiple integration of the vector may have occurred in D8D1, while D8D6 carried a single integrated copy of the vector. Transformant D8D3 was GUS+ and resulted from a single-crossover integration into the 3′ region of nor-1 (Fig. 1C). Transformant D8D4 was GUS− and resulted from single-crossover integration into the niaD locus (Fig. 1D). In a separate transformation experiment, 10 of 11 GUS+ isolates had pAPGUSNNB integrated at either a 5′ nor-1 locus (isolates 8, 34, 67, and 73) or a 3′ nor-1 locus (isolates 50, 59, 61, 68, 85, and 96). The site of integration in the eleventh GUS+ isolate (isolate 15) could not be conclusively assigned to either the 5′ or 3′ region of nor-1. However, the vector was clearly not integrated at niaD. In contrast, none of the six GUS− isolates had pAPGUSNNB at either a 5′ or 3′ nor-1 locus. Two isolates (isolates 10 and 20) were niaD single-crossover integrants and four (isolates 25, 35, 40, and 45) were double-crossover gene replacements of the niaD selectable marker.
PCR analysis to determine integration site of pAPGUSNNB.
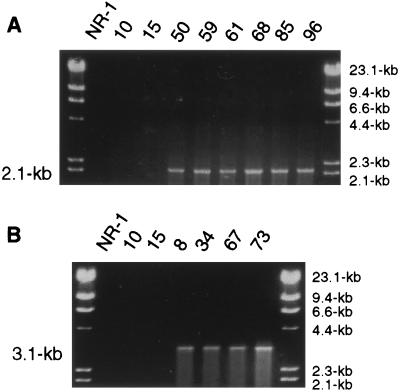
As predicted (Fig. 1C), pAPGUSNNB transformants 50, 59, 61, 68, 85, and 96 produced a 2.1-kb amplicon with primers PCR2 (JL102 and JL103) (Fig. 2A). This amplicon is specific for pAPGUSNNB integration into the 3′ region of nor-1. Transformants 8, 34, 67, and 73 produced a 3.4-kb amplicon with primers PCR1 (JL99 and JL100), indicating 5′ nor-1 integration of pAPGUSNNB (Fig. 2B). These PCR integration assays were confirmed by Southern hybridization analysis (data not shown). Transformants 10 and 15 did not produce PCR products in either nor-1 integration PCR assay, supporting the Southern hybridization data showing transformant 10 to be a pAPGUSNNB niaD integrant and isolate 15 to be nondefinable (possible ectopic integration).
FIG. 2.
PCR analysis of pAPGUSNNB transformants to detect 3′ and 5′ nor-1 integration. Genomic DNA was isolated from A. parasiticus and amplified by PCR using the primers (Table 1) represented in Fig. 1 by arrows (PCR 1 [5′ nor-1] and PCR2 [3′ nor-1]). (A) PCR analysis of 3′ nor-1 integrants of pAPGUSNNB (transformants 50, 59, 61, 68, 85, and 96). (B) PCR analysis of 5′ nor-1 integrants (transformants 8, 34, 67, and 73). NR-1 (parent strain) and transformants 10 (pAPGUSNNB integrated at niaD) and 15 (site of integration not completely defined) were used as negative controls.
Comparison of nor-1 and uidA transcription in pAPGUSNNB transformant D8D3.
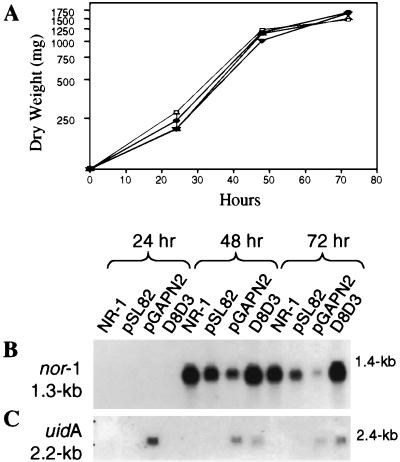
Transformant D8D3, with the nor-1::GUS reporter construct integrated into the 3′ region of nor-1, was grown in aflatoxin-inducing medium and the expression of nor-1 and uidA was analyzed 24, 48, and 72 h after inoculation. The dry weight of D8D3 (Fig. 3A) and control strains (NR-1, NR-1/pSL82, and NR-1/pGAPN2B) was similar (less than 15% variability) at each time point. Active growth occurred between 0 and 48 h (log phase). A transition from active growth to stationary phase was observed between 48 and 72 h as previously described (3, 12, 17, 20).
FIG. 3.
Analysis of growth and expression of the nor-1 promoter in transformant D8D3 and control strains. (A) D8D3 (•) and control strains of A. parasiticus, NR-1 (▵), NR-1/pSL82 (▿), and NR-1/pGAPN2B (□) were inoculated into an aflatoxin-inducing growth medium (YES broth). Mycelia were harvested at 24, 48, and 72 h after inoculation. A portion of each sample was dried for weight determination (milligrams per 100 ml of culture). For the control strains, the points on the graph represent data from a single culture. D8D3 was grown in triplicate and the error bars indicate standard errors. (B and C) Northern hybridization analysis of nor-1 and uidA transcripts. Thirty micrograms of total RNA was loaded into each lane. Each autoradiogram represents RNA isolated from mycelia after growth for 24, 48, and 72 h in aflatoxin-inducing medium. Blotted RNA was hybridized with a PCR-amplified 780-bp nor-1 probe (B) or a 1.7-kb amplification product of the uidA gene (C). The nor-1 transcript is approximately 1.3 kb and the predicted nor-1::GUS transcript is approximately 2.2 kb. This estimate is based on the size of the uidA gene in nor-1::GUS and the nor-1 transcription initiation and polyadenylation sites which are also included in the fusion.
RNA isolated at 24, 48, and 72 h from D8D3 and each of the three control strains was subjected to Northern hybridization analysis using nor-1 and uidA PCR probes (Fig. 3B and C). The nor-1 transcript was not observed in D8D3 at 24 h but was detected at high levels at 48 and 72 h. uidA transcript accumulation in D8D3, though less abundant than nor-1, followed the same pattern of accumulation as the native nor-1 transcript, suggesting that both copies of the nor-1 promoter functioned similarly under these growth conditions. The specific activities of the nor-1 and uidA probes in these experiments were roughly equivalent.
The nor-1 transcript accumulation pattern was similar in each of the three control strains (Fig. 3B); however, the level of transcript in NR1/pSL82 and NR-1/pGAPN2B was lower than in the other strains. As expected, uidA transcript was not detected at any time point in NR-1 or NR-1/pSL82 but was present in NR-1/pGAPN2B at relatively high levels at 24 h and at decreasing concentrations at 48 and 72 h. This pattern of uidA transcript accumulation is significant because the promoter of the housekeeping gene (β-tubulin) is transcribed during active growth and then declines after the transition to stationary phase. This pattern differs from that for the aflatoxin promoters, which are not actively transcribed until the transition from active growth to stationary phase.
Nor-1 and GUS protein accumulation patterns were similar to accumulation of their respective transcripts (data not shown), suggesting that nor-1 regulation under these growth conditions occurs primarily at the level of transcription.
Comparison of aflatoxin levels and GUS activity in pAPGUSNNB transformant D8D3.
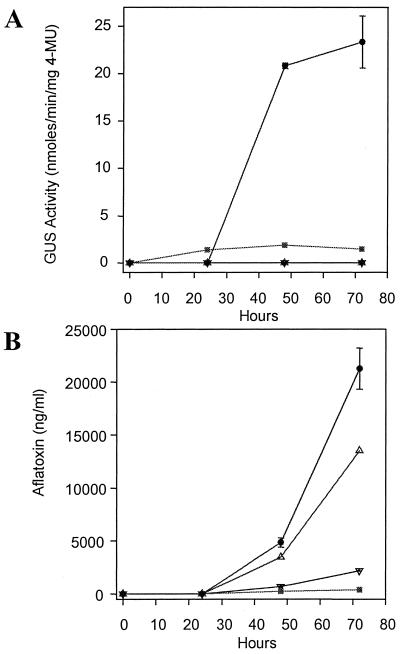
The same time course experiment that provided data on nor-1 and uidA transcription was also the source for data on aflatoxin levels and GUS activity. Neither aflatoxin nor GUS activity was detected in D8D3 at 24 h of fungal growth (Fig. 4), but relatively high levels of both were observed at 48 and 72 h. This pattern is consistent with the accumulation of nor-1 and uidA transcripts (Fig. 3B and C) from D8D3 mycelial samples. Although GUS activity in D8D3 increased slightly from 48 to 72 h, a greater increase in aflatoxin levels during this period was observed. This difference in proportion could be explained by aflatoxin instability and would probably be absent if Nor-1 activity was measured directly.
FIG. 4.
GUS activity and aflatoxin production in transformant D8D3 and control strains. Mycelia of pAPGUSNNB transformant D8D3 (•) and control strains NR-1 (▵), NR-1/pSL82 (▿), and NR-1/pGAPN2B (▪) were harvested at 24, 48, and 72 h after inoculation in aflatoxin-inducing medium (YES broth). (A) One microgram of protein from each mycelial sample was used to determine GUS activity. The substrate for GUS analysis was MUG. 4MU, 4-methylumbelliferone. (B) Culture filtrate was used for the determination of aflatoxin levels via enzyme-linked immunosorbent assay. For the control strains, the points on the graph represent data from a single culture. D8D3 was grown in triplicate and the error bars indicate standard errors.
The NR-1/pSL82 and NR-1/pGAPN2B controls were relatively weak producers of aflatoxin, as might be expected when comparing the nor-1 transcripts of these strains with those of D8D3 and NR-1. GUS activity was absent in NR-1 and NR-1/pSL82 at all three time points and present in NR-1/pGAPN2B at all three time points. At 48 h, D8D3 expressed 11 times more GUS activity than NR-1/pGAPN2B, and at 72 h D8D3 expressed 48 times more activity. Since uidA transcript levels were similar in both of these transformants, the lower level of GUS activity in NR-1/pGAPN2B might be the result of relatively inefficient translation or stability of the β-tubulin fusion protein.
To measure the reproducibility of GUS expression in transformants that are presumably genetically identical to D8D3, five independent pAPGUSNNB 3′ nor-1 integrants were assayed in duplicate for GUS activity (quantitative assay). The difference in GUS activity between duplicate samples for any one isolate did not exceed 10% of the mean. The difference between the mean of GUS activity for duplicate samples from any two isolates did not exceed 60% (GUS activity at 48 h ranged from 12 to 19 nmol of 4-methylumbelliferone/min/mg of protein).
Transformation of A. parasiticus CS10 with pAPGUSNP.
Based on previously reported ver-1 regulation studies (12) and the data presented above, we hypothesized that the location within the aflatoxin cluster provided a positive regulatory influence on nor-1 promoter function under aflatoxin-inducing growth conditions. To test this hypothesis, we determined if the nor-1 promoter would function at a different chromosomal location outside of the aflatoxin cluster. The pyrG locus was chosen because this selectable marker was cloned previously (20).
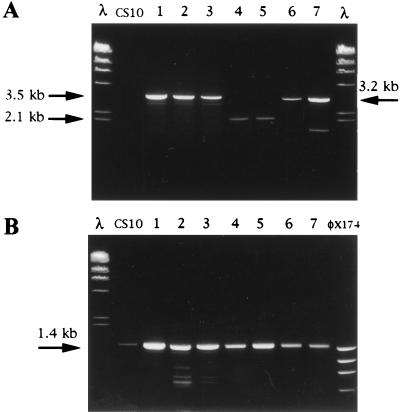
A. parasiticus CS10 was transformed with pAPGUSNP (Fig. 5A). Transformants (178 in total) were selected on CZ medium, transferred to aflatoxin-inducing YES agar medium, and analyzed by qualitative GUS assay, resulting in the identification of 42 GUS+ isolates. Fourteen GUS+ isolates were arbitrarily selected and screened by a rapid PCR assay for site of integration (Fig. 6). All 14 GUS+ isolates had pAPGUSNP integrated at 5′ nor-1 (11 isolates) or 3′ nor-1 (3 isolates) locus. The site of integration of pAPGUSNP was confirmed in four of these isolates and six additional arbitrarily selected GUS+ isolates by Southern hybridization analysis (Fig. 5). Of these 10 isolates, 7 had pAPGUSNP integrated at 5′ nor-1 and 2 carried pAPGUSNP at 3′ nor-1. Isolate 57 was likely a multiple integrant of pAPGUSNP, with one copy of pAPGUSNP at both 5′ and 3′ nor-1 (26). In contrast, of 11 isolates with pAPGUSNP integrated at pyrG, none expressed GUS activity.
FIG. 6.
PCR analysis to detect site of integration in pAPGUSNP transformants. Template DNA for 5′ and 3′ nor-1 and pyrG integration assays was prepared with a rapid boiling procedure. (A) GUS+ and GUS− transformants (lanes 1 through 7) and CS10 (negative control) analyzed for 5′ nor-1, 3′ nor-1, or pyrG integration. Primers PCR3 were used to detect pyrG integration (lanes 1, 2, and 3; GUS− transformants) and generated a 3.5-kb PCR fragment. Primers PCR2 were used to detect 3′ nor-1 integration (lanes 4 and 5; GUS+ transformants) and generated a 2.1-kb PCR fragment. Primers PCR1 were used to detect 5′ nor-1 integration (lanes 6 and 7; GUS+ transformants) and generated a 3.1-kb PCR fragment. (B) DNA from all seven transformants and the control strain CS10 amplified with a primer pair specific for exon III of the versicolorin B synthase gene (positive control). A 1.4-kb PCR fragment was expected for all fungal isolates. Lanes containing molecular size markers in panels A and B are represented by λ HindIII digest and φx174 HaeIII digest. Nucleotide sequences of all primers are found in Table 1.
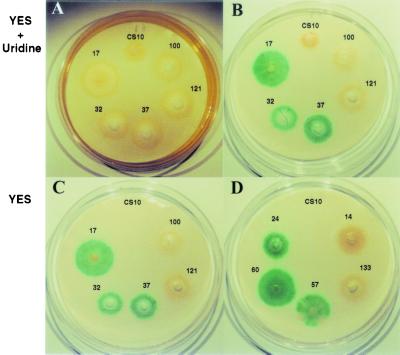
pyrG is also expressed in A. parasiticus CS10 (used as the recipient) under these aflatoxin-inducing growth conditions (Fig. 7). Growth of A. parasiticus CS10 (wh-1 ver-1 pyrG) on YES medium required supplementation with uridine (100 μg/ml) while transformation of CS10 with a functional pyrG gene overcame this requirement, demonstrating that a functional copy of pyrG must be present and expressed for growth of CS10 on YES medium.
FIG. 7.
Qualitative GUS activity assay on CS10 transformants harboring pAPGUSNP. The recipient strain CS10 (control) and representative pyrG+ transformants were inoculated onto nytran membranes overlaid onto YES agar medium (C and D) or YES supplemented with 5 mg of uridine per plate (A and B). A qualitative GUS assay was conducted on filters for panels B, C, and D. Transformants carried a single copy of pAPGUSNP integrated at 5′ nor-1 (transformants 17 and 32), 3′ nor-1 (transformant 37), or pyrG (transformants 100 and 121). Transformants 24 and 60 carried multiple copies of pAPGUSNP with at least one copy integrated at 5′ nor-1. Transformant 57 carried multiple copies of pAPGUSNP with at least one copy integrated at 3′ nor-1. Transformants 14 and 133 carried multiple copies of pAPGUSNP with at least one copy at pyrG and no copies at nor-1.
Confirmation of positional effect at niaD:pBNG3.0.
We analyzed the function of a different nor-1::GUS reporter construct (pBNG3.0) (Miller et al. submitted) at niaD and nor-1. Transformation of pBNG3.0 into NR-1 (niaD) resulted in 117 transformants. The transformants were tested for GUS activity by the qualitative assay, resulting in 29 GUS+ colonies (25%). Of the 29 GUS+ transformants, 21 were tested for site of integration using the rapid PCR assay (Fig. 8B and C). All 21 transformants were positive for either 5′ (12 transformants) or 3′ (9 transformants) nor-1 integration. Conversely, 22 arbitrarily selected GUS− transformants were tested for site of integration using the rapid PCR assay and all were negative for 5′ and 3′ nor-1 integration (data not shown). Identification of 3′ integrants was important because it results in the nor-1 promoter from the plasmid (pBNG3.0) being connected to the GUS gene while 5′ nor-1 integration results in the chromosomal nor-1 promoter being connected to the GUS gene. All 3′ nor-1 integrants tested (eight isolates) were confirmed for 3′ integration by Southern hybridization analysis (data not shown). These data confirmed the results reported above for pAPGUSNNB, i.e., that integration at nor-1 results in wild-type nor-1 promoter activity while integration at niaD results in undetectable levels of nor-1 promoter activity.
DISCUSSION
Our experiments demonstrate that the nor-1::GUS reporter and the wild-type nor-1 gene are regulated in a similar manner in pAPGUSNNB transformant strain D8D3. On an aflatoxin-inducing growth medium (YES), the timing and pattern of transcript and protein accumulation driven by the nor-1 promoter for these two genes were similar. Data obtained from the same time course experiment also showed that the time of onset of accumulation of aflatoxin and GUS activity was the same, while the pattern of increase in aflatoxin accumulation was consistent with the pattern of increase in accumulation of GUS activity at 48 and 72 h (i.e., relatively high GUS activity preceded high levels of aflatoxin accumulation). Furthermore, when qualitative GUS assays were performed on D8D3 grown on CZ medium, a non-aflatoxin-inducing growth medium, GUS activity was not detected (data not shown). There also was a relatively low level of variation in GUS expression in transformants that were genotypically identical to D8D3 based on Southern hybridization analysis. When five arbitrarily selected isolates were cultured under identical growth conditions and then assayed for GUS activity, the difference in GUS activity at any time between isolates did not exceed 60%. These data validate the use of the nor-1::GUS reporter as a sensitive and reproducible system to monitor environmental influences on expression of this aflatoxin gene.
While nor-1::GUS expression at the nor-1 locus was regulated similarly to the native nor-1 gene, placement at two other positions (niaD and pyrG) outside of the aflatoxin gene cluster resulted in no detectable GUS activity. These data support the preliminary observation by Liang et al. (14) that chromosome location plays a role in regulation of aflatoxin gene expression. The targeting of reporter constructs to specific chromosomal locations for promoter analysis has been suggested by other investigators studying expression of fungal genes (7, 22, 25). Although the mechanisms of position-dependent gene expression have not been fully elucidated in filamentous fungi, it has been hypothesized that enhancer elements may be responsible for the position-dependent effect (12). The hypothesis that positive cis-acting factors have regional control over the transcription of aflatoxin genes is reasonable, since removal of aflatoxin reporter fusions from the aflatoxin gene cluster results in reduced GUS expression.
An alternative explanation for the lack of GUS activity at the niaD and pyrG loci is that a transcriptionally inactive chromatin structure exists at these two sites. We think that such inactivation is unlikely for two reasons. First, NR-1 transformed with pGAPN2B (β-tubulin::GUS) expressed GUS activity at similar levels at 24, 48, and 72 h when integrated at the niaD locus, although the level of GUS activity in the pGAPN2B transformants was approximately 10-fold lower than those of D8D3 at 48 and 72 h. In contrast, transformant D8D4 (pAPGUSNNB integrated at niaD), when grown under the same conditions, produced no detectable GUS activity at any of these time points (data not shown). Second, in transformants carrying pAPGUSNP, the nor-1 promoter carried on this plasmid was not active at the pyrG locus even though growth on YES medium required expression of the pyrG gene. In addition, several pAPGUSNP transformants had no detectable GUS activity even when they carried multiple copies of the plasmid (none integrated at nor-1). In contrast, other multiple integtrants with at least one copy of pAPGUSNP integrated at nor-1 were GUS+. Based on these data and preliminary data reported by Liang et al. (14), we hypothesize that aflatoxin gene expression is influenced by an enhancer element.
The clustering, or close linking, of genes involved in the same secondary metabolic pathway is a common theme in the filamentous fungi (11). However, cis-acting elements that regulate many genes simultaneously in fungal gene clusters have not been identified. If an enhancer element does influence the regulation of nor-1 transcription, it is located at least 3 kb upstream from the transcription initiation site in the 5′ nor-1 region, at least 1.8 kb downstream of the transcription termination site in the 3′ region of nor-1, or within the nor-1 coding region. Because of similar position-dependent expression observed with the ver-1::GUS reporter construct (14), it is also possible that the same cis-acting element is influencing the regulation of both nor-1 and ver-1. Studies performed on the SpoC1 gene cluster in A. nidulans showed that clustered genes can be coordinately expressed during development and that placement of cluster genes at ectopic chromosomal locations results in the loss of that coordination (15, 21). The physical linkage of aflatoxin biosynthesis genes also may have a regulatory role. Studies designed to establish such a phenomenon and to determine the nature of the regulatory mechanism may eventually lead to a broader understanding of the expression of secondary metabolism genes and the ability to manipulate its expression in microorganisms.
We developed a rapid procedure to prepare DNA templates from fungal colonies that are sufficiently pure for PCR analysis of the site of plasmid integration into the A. parasiticus genome. This development was critical for current and future studies on the regulation of the nor-1 and ver-1 promoters because detection of the correct site of integration in the genome is essential to accurately measure environmental influences on the aflatoxin gene promoters. In this regard, the speed and effectiveness of the rapid assay make screening of large numbers of fungal transformants practical.
Acknowledgments
This work was supported by the Michigan Agricultural Experiment Station (MSU), the National Food Safety and Toxicology Center (MSU), the Center for Environmental Toxicology (MSU), and the National Institutes of Health (RO1 CA52003-11).
We thank Gary Payne, North Carolina State University, for providing plasmid pGAPN2B.
REFERENCES
- 1.Ausubel, F. M., R. Brent, E. Kingston, D. D. Moore, J. G. Seidman, J. A. Smith, and K. Struhl. 2001. Current protocols in molecular biology. John Wiley and Sons, New York, N.Y.
- 2.Bradford, M. M. 1976. A rapid and sensitive method for the quantification of microgram quantities of protein utilizing the principle of protein-dye binding. Anal. Biochem. 72:248–254. [DOI] [PubMed] [Google Scholar]
- 3.Buchanan, R. L., S. B. Jones, W. V. Gerasimowicz, L. L. Zaika, H. G. Stahl, and L. A. Ocker. 1987. Regulation of aflatoxin biosynthesis: assessment of the role of cellular energy status as a regulator of the induction of aflatoxin production. Appl. Environ. Microbiol. 53:1224–1231. [DOI] [PMC free article] [PubMed] [Google Scholar]
- 4.Cary, J., J. Linz, and D. Bhantnagar. 2000. Aflatoxins: biological significance and regulation of synthesis, p.317–362. In J. Cary, D. Bhatnagar, and J. Linz (ed.), Microbial foodborne disease: mechanisms of pathogenesis and toxin synthesis. Technomic Publishing, Lancaster, Pa.
- 5.Cotty, P. J. 1994. Agriculture, aflatoxins, and Aspergillus, p.1–27. In K. A. Powell, A. Fenwick, and J. F. Peberdy (ed.), The genus Aspergillus. Plenum Press, New York, N.Y.
- 6.Ellis, W. O., J. P. Smith, B. K. Simpson, and J. H. Oldham. 1991. Aflatoxins in food: occurrence, biosynthesis, effects on organisms, detection, and methods of control. Crit. Rev. Food Sci. Nutr. 30:403–439. [DOI] [PubMed] [Google Scholar]
- 7.Hamer, J. E., and W. E. Timberlake. 1987. Functional organization of the Aspergillus nidulans trpC promoter. Mol. Cell. Biol. 7:2352–2359. [DOI] [PMC free article] [PubMed] [Google Scholar]
- 8.Horng, J. S., P. K. Chang, J. J. Pestka, and J. E. Linz. 1990. Development of a homologous transformation system for Aspergillus parasiticus with the gene encoding nitrate reductase. Mol. Gen. Genet. 224:294–296. [DOI] [PubMed] [Google Scholar]
- 9.Jefferson, R. A. 1989. The GUS reporter gene system. Nature 342:837–838. [DOI] [PubMed] [Google Scholar]
- 10.Keller, N. P., and T. H. Adams. 1995. Analysis of a mycotoxin gene cluster in Aspergillus nidulans. SAAS. Bull. Biochem. Biotechnol. 8:14–21. [PubMed] [Google Scholar]
- 11.Keller, N. P., and T. M. Hohn. 1997. Metabolic pathway gene clusters in filamentous fungi. Fungal Genet. Biol. 21:17–29. [PubMed] [Google Scholar]
- 12.Kinsey, J. A., and J. A. Rambosek. 1984. Transformation of Neurospora crassa with the cloned amdH (glutamate dehydrogenase) gene. Mol. Cell. Biol. 4:117–122. [DOI] [PMC free article] [PubMed] [Google Scholar]
- 13.Kolar, M., K. Holzman, G. Weber, E. Leitner, and H. Schwab. 1991. Transformation of Penicillium chrysogenum using dominant selection markers and expression of an Escherichia coli lacZ fusion gene. Gene 62:127–134. [DOI] [PubMed] [Google Scholar]
- 14.Liang, S. H., T. S. Wu, R. Lee, F. S. Chu, and J. E. Linz. 1997. Analysis of mechanisms regulating expression of the ver-1 gene, involved in aflatoxin biosynthesis. Appl. Environ. Microbiol. 63:1058–1065. [DOI] [PMC free article] [PubMed] [Google Scholar]
- 15.Miller, B. L., K. Y. Miller, K. A. Roberti, and W. E. Timberlake. 1987. Position-dependent and -independent mechanisms regulate cell-specific expression of the SpoC1 gene cluster of Aspergillus nidulans. Mol. Cell. Biol. 7:427–434. [DOI] [PMC free article] [PubMed] [Google Scholar]
- 16.Minto, R. E., and C. A. Townsend. 1997. Enzymology and molecular biology of aflatoxin biosynthesis. Chem. Rev. 97:2537–2555. [DOI] [PubMed] [Google Scholar]
- 17.Muro-Pastor, M. I., R. Gonzalez, J. Strauss, F. Narendja, and C. Scazzocchio. 1999. The GATA factor areA is essential for chromatin remodeling in a eukaryotic bidirectional promoter. EMBO J. 18:1584–1597. [DOI] [PMC free article] [PubMed] [Google Scholar]
- 18.Payne, G. A., and M. P. Brown. 1998. Genetics and physiology of aflatoxin biosynthesis. Annu. Rev. Phytopathol. 36:329–362. [DOI] [PubMed] [Google Scholar]
- 19.Skory, C. D., P. K. Chang, and J. E. Linz. 1993. Regulated expression of the nor-1 and ver-1 genes associated with aflatoxin biosynthesis. Appl. Environ. Microbiol. 59:1642–1646. [DOI] [PMC free article] [PubMed] [Google Scholar]
- 20.Skory, C. D., J. S. Horng, J. J. Pestka, and J. E. Linz. 1990. Transformation of Aspergillus parasiticus with a homologous gene (pyrG) involved in pyrimidine biosynthesis. Appl. Environ. Microbiol. 56:3315–3320. [DOI] [PMC free article] [PubMed] [Google Scholar]
- 21.Timberlake, W. E., and E. C. Barnard. 1981. Organization of a gene cluster expressed specifically in the asexual spores of A. nidulans. Cell 26:29–37. [DOI] [PubMed] [Google Scholar]
- 22.Timberlake, W. E., and M. A. Marshall. 1989. Genetic engineering of filamentous fungi. Science 244:1313–1317. [DOI] [PubMed] [Google Scholar]
- 23.Trail, F., N. Mahanti, and J. Linz. 1995. Molecular biology of aflatoxin biosynthesis. Microbiology 141:755–765. [DOI] [PubMed] [Google Scholar]
- 24.Trail, F., N. Mahanti, M. Rarick, R. Mehigh, S. H. Liang, R. Zhou, and J. E. Linz. 1995. Physical and transcriptional map of an aflatoxin gene cluster in Aspergillus parasiticus and functional disruption of a gene involved early in the aflatoxin pathway. Appl. Environ. Microbiol. 61:2665–2673. [DOI] [PMC free article] [PubMed] [Google Scholar]
- 25.van Gorcom, R. F., P. J. Punt, P. H. Pouwels, and C. A. van den Hondel. 1986. A system for the analysis of expression signals in Aspergillus. Gene 48:211–217. [DOI] [PubMed] [Google Scholar]
- 26.Verdoes, J. C., P. J. Punt, A. H. Stouthamer, and C. A. M. J. J. van den Hondel. 1994. The effect of multiple copies of the upstream region on expression of the Aspergillus niger glucoamylase encoding gene. Gene 145:179–187. [DOI] [PubMed] [Google Scholar]
- 27.Woloshuk, C. P., and R. Prieto. 1998. Genetic organization and function of the aflatoxin B1 biosynthetic genes. FEMS Microbiol. Lett. 160:169–176. [DOI] [PubMed] [Google Scholar]
- 28.Zhou, R. 1997. The function, accumulation, and localization of the Nor-1 protein involved in aflatoxin biosynthesis; the function of the fluP gene associated with sporulation in Aspergillus parasiticus. Ph.D. dissertation, Michigan State University, East Lansing.
- 29.Zhou, R., and J. E. Linz. 1999. Enzymatic function of the Nor-1 protein in aflatoxin biosynthesis in Aspergillus parasiticus. Appl. Environ. Microbiol. 65:5639–5641. [DOI] [PMC free article] [PubMed] [Google Scholar]


