Abstract
Two members of the MTG/ETO family of transcriptional corepressors, MTG8 and MTG16, are disrupted by chromosomal translocations in up to 15% of acute myeloid leukemia cases. The third family member, MTGR1, was identified as a factor that associates with the t(8;21) fusion protein RUNX1-MTG8. We demonstrate that Mtgr1 associates with mSin3A, N-CoR, and histone deacetylase 3 and that when tethered to DNA, Mtgr1 represses transcription, suggesting that Mtgr1 also acts as a transcriptional corepressor. To define the biological function of Mtgr1, we created Mtgr1-null mice. These mice are proportionally smaller than their littermates during embryogenesis and throughout their life span but otherwise develop normally. However, these mice display a progressive reduction in the secretory epithelial cell lineage in the small intestine. This is not due to the loss of small intestinal progenitor cells expressing Gfi1, which is required for the formation of goblet and Paneth cells, implying that loss of Mtgr1 impairs the maturation of secretory cells in the small intestine.
Chromosomal translocations disrupt master regulatory genes that control cellular proliferation, apoptosis, and the lineage decisions that affect stem cell self-renewal and differentiation of progenitor cells (15, 29). The myeloid translocation gene on chromosome 8 (MTG8, also known as eight-twenty-one or ETO) is disrupted by t(8;21) in up to 15% of acute myeloid leukemia cases (7, 26, 27). MTG8 is the founding member of a gene family that includes the myeloid translocation gene on chromosome 16 (MTG16 or ETO2), which is disrupted by t(16;21), and myeloid translocation gene-related 1 (MTGR1) (5, 6, 12, 18). t(8;21) and t(16;21) fuse MTG8 and MTG16, respectively, to the DNA binding domain of Runt-related 1 (RUNX1, also known as acute myeloid leukemia 1 or AML1) (7, 12, 26, 27). The resulting fusion proteins repress RUNX1-regulated genes (11, 20, 25). For RUNX1-MTG8, this repression requires the MTG8 sequences, leading to the hypothesis that MTG8 is a transcriptional corepressor (20). Consistent with this hypothesis, MTG8 associates with multiple corepressors, including N-CoR/SMRT, mSin3, and histone deacetylase 1 (HDAC1), HDAC2, and HDAC3 (1, 13, 14, 23, 34).
MTG family members display approximately 85% sequence similarity (3) and contain four conserved subdomains with up to 95% identity (5, 8). Based on homology to MTG8, it was anticipated that MTG16 and MTGR1 also act as transcriptional corepressors. MTG16 is 92% homologous to MTG8, and the murine form of MTG16, Eto2, interacts with multiple HDACs and N-CoR (1). In contrast to MTG8, Eto2 failed to interact with mSin3A (1). The MTG family members also heterodimerize, and this property allowed the identification of MTGR1 as a RUNX1-MTG8-associated protein (18). Although it associates with MTG8 and the t(8;21) fusion protein, the molecular function of MTGR1 is unknown.
While two of the three MTG family members are disrupted by chromosomal translocations, the MTG family members are widely expressed, suggesting that this gene family functions in multiple tissues. Indeed, targeted disruption of Mtg8 (CBFA2T1) revealed that it plays a critical role in gut development as 25% of the Mtg8-deficient mice showed a deletion of the midgut, fusing the proximal small intestine to the distal colon (4). The mice that retained the midgut were 30 to 50% smaller than controls and showed reduced viability, with approximately 80% dying by 15 days of age. The failure to thrive was presumed to be due to thinning of the intestinal wall, with fewer, blunted, and disorganized villi leading to poor absorption of nutrients. However, all four epithelial cell types were present in the gut and the ratios of each cell type were not significantly different from those of wild-type littermates (4).
Based on its homology to MTG8 and MTG16, we investigated the role of Mtgr1 in transcriptional control. When tethered to a promoter, Mtgr1 is a strong transcriptional repressor that recruits corepressors and HDAC3. To gain insight into the physiological role of Mtgr1, we generated mice with a targeted disruption of Mtgr1 (also known as CBFA2T2). Although the mice are grossly normal, by 6 weeks of age there is a dramatic decrease in the number of cells comprising the secretory lineage of the small intestine, including goblet, Paneth, and enteroendocrine cells. Thus, this transcriptional corepressor is required for the maintenance of the secretory cell lineage in the small intestine.
MATERIALS AND METHODS
Reporter assays and plasmids.
The Gal-TK-luciferase reporter construct and the CMV-SEAP construct, used as an internal control in the transcription assays, were described previously (1, 9). NIH 3T3 cells were cotransfected with a constant amount of Gal-TK-luciferase and CMV-SEAP and increasing amounts of the plasmid expressing the GAL4-Mtgr1 fusion protein. The amounts of DNA transfected were balanced by the addition of pCMV5. DNA was transfected with Superfect, and the luciferase activity was measured 40 h later. The values were corrected by using SEAP activity for transfection efficiency and expressed as fold repression, which was calculated by dividing 100% by the percentage of the activity remaining.
A murine Mtgr1 cDNA was obtained as an IMAGE clone and sequenced (accession number pending). The cDNA representing the short form of the molecule, Mtgr1a (28), was isolated from the IMAGE clone and the 5′ end engineered to contain XbaI and MluI restriction sites. This cDNA was subcloned into the XbaI and SalI sites of the pBluescript KS vector. The cDNA was released with MluI and SalI and subcloned into the pCMV5 M2 vector, described previously (9), to create Gal-Mtgr1a. In the cloning of this cDNA, we noted that alternative splicing creates two forms of Mtgr1a, with one containing a single glutamic acid at codon 413, which we designated Mtgr1a, and the other form containing two glutamic acids at codons 413 and 414, which we call Mtgr1a(+E). While we used Mtgr1a for all of our experiments, the Mtgr1(+E) form of the protein gave the same results in transcription assays; thus, the two forms of the protein appear to be functionally equivalent. The Gal-MTG8 expression plasmid was constructed previously (1).
Several plasmids used in our assays were kindly provided by the following investigators. FLAG-tagged HDAC1 to -6 constructs were provided by E. Seto (Moffitt Cancer Center, Tampa, FL). Myc-HDAC8 was provided by E. Hu (SmithKline Beecham Pharmaceuticals). Hemagglutinin-HDAC7 and full-length N-CoR tagged with the FLAG epitope were kindly provided by R. Evans (17). The mSin3A cDNA was provided by D. Ayer (University of Utah) in the pVZ vector. The FLAG epitope tag was added to mSin3A by engineering a KpnI site at the 5′ end and subcloning the mSin3A cDNA into the pFLAG-CMV-2 expression vector (Sigma).
The pPNT vector used for making the targeting construct was provided by the Vanderbilt-Ingram Cancer Center Transgenic Mouse/Embryonic Stem Cell Shared Resource as previously described (32). The construct used for targeting the Mtgr1/CBFA2T2 locus was made by restriction mapping a BAC clone isolated from an AB1 library. An 11-kb XbaI fragment was identified that contained the region to be disrupted. From this 11-kb XbaI fragment, a 6.5-kb StuI-SmaI fragment was subcloned into a blunt-ended, XbaI-cut pPNT vector. A construct containing the StuI-SmaI fragment in the correct orientation was isolated, digested with XhoI, and filled in with the Klenow fragment of DNA polymerase. A 1.7-kb SmaI-XbaI fragment was filled in with Klenow and subcloned into the filled-in XhoI site. The resulting construct was linearized with NdeI and electroporated into TL1 embryonic stem (ES) cells. DNA isolated from the resulting single-cell clones was digested with EcoRI and analyzed by Southern blotting for homologous recombination. Of the multiple clones shown to have a targeted disruption of the CBFA2T2 locus, three were chosen for injection into C57BL/6 blastocysts. Male chimeric mice were mated with C57BL/6 females, and agouti pups were tested for disruption of the CBFA2T2 locus. All three ES cell clones produced chimeras capable of transmitting mutated CBFA2T2 to their progeny. Two of these lines, A7 and 6A6, were continued for further analysis.
In addition, the 5′ end of Mtgr1 was amplified by PCR to generate a 380-bp fragment and subcloned into BamHI/XhoI-digested pGEX4T-1 (Amersham-Pharmacia) to generate Mtgr1 recombinant protein for making antiserum. The oligonucleotides used to generate the PCR product were Mtgr1-138T (5′-GCGGATCCGAGAAAAGGGTGCCAGCAATG-3′) and Mtgr1-518B (5′-GCCTCGAGTTAAGTAGCCGGCAGCTGTTGATT-3′).
Cell culture.
Cos-7 and K562 cells were maintained in Dulbecco modified Eagle medium (DMEM; BioWhittaker Inc., Walkersville, MD) or RPMI medium, respectively, containing 10% fetal calf serum (Sigma or Atlanta Biologicals), 50 U/ml penicillin, 50 μg/ml streptomycin, and 2 mM l-glutamine (all from BioWhittaker). NIH 3T3 cells were maintained in DMEM containing 10% calf serum (HyClone), 50 U/ml penicillin, 50 μg/ml streptomycin, and 2 mM l-glutamine (all from BioWhittaker). ES cells were grown on irradiated mouse embryo fibroblast (MEF) feeder layers in DMEM containing 15% fetal calf serum, 0.1 mM nonessential amino acids, 2 mM l-glutamine, 50 μg/ml gentamicin, 103 U/ml leukemia inhibitory factor, and 55 μM β-mercaptoethanol (all from Gibco/Invitrogen). MEFs were generated from single embryos by standard procedures. They were maintained in DMEM containing10% calf serum (HyClone), 50 U/ml penicillin, 50 μg/ml streptomycin, and 2 mM l-glutamine (all from BioWhittaker) by using a standard 3T3 protocol. Some were grown in DMEM containing 10% fetal calf serum, 0.1 mM nonessential amino acids, 50 U/ml penicillin, 50 μg/ml streptomycin, 2 mM l-glutamine (BioWhittaker), and 55 μM β-mercaptoethanol (Sigma) by using a 3T9 protocol.
Coimmunoprecipitations and immunoblotting.
Cos-7 cells (3 × 10⁶ cells in 100-mm-diameter dishes) were transfected with Lipofectamine reagent (Invitrogen) according to the manufacturer's instructions. Typically, 1.5 to 3.5 μg of each of the expression plasmids was cotransfected. When necessary, vector DNA (pCMV5 or pCMV5 M2) was added to normalize the amount of DNA (5 μg total). Approximately 48 to 52 h posttransfection, cells were harvested and extracted with lysis buffer (phosphate-buffered saline supplemented with 1 μg/ml leupeptin, 0.2 mM phenylmethylsulfonyl fluoride, and 0.1 trypsin inhibitor U/ml aprotinin and containing 0.5% Triton X-100, 0.1% sodium deoxycholate, and 0.1% sodium dodecyl sulfate). A portion of the cell lysate was removed for immunoblot analysis and the remainder incubated for 1 h with affinity-purified primary antibody (anti-Mtgr1, anti-Myc 9E10 [Covance], and anti-HA [Covance]). A 20-μl aliquot of a 50% slurry of protein A (Amersham-Pharmacia)- or protein G-Sepharose (Sigma) was then added, the mixture was incubated for 30 min to collect the immune complexes, and these complexes were washed three times at 4°C with lysis buffer. For FLAG or GAL4 coimmunoprecipitations, 20 μl of a 50% slurry of anti-FLAG M2 beads (Sigma) or anti-GAL4 beads (Santa Cruz Biotechnology), respectively, was added to the lysates and the mixture was incubated for 90 min at 4°C and washed three times at 4°C with lysis buffer. For the endogenous association, lysates from K562 cells were immunoprecipitated with anti-mSin3A (K-20; Santa Cruz) or nonspecific rabbit immunoglobulin G and collected with protein A-Sepharose as described above. Immunoblot analysis was performed with the antibodies indicated in the figures as previously described (1).
In situ hybridization.
Two probes for in situ analysis were generated by PCR with the oligonucleotides MTGR1-776T (5′-GAATTCCAGTCCGGAAAGGAGGGACGA-3′) and MTGR1-1094B (5′-GAATTCCCTTTCTGTCAAACGGTGGTC-3′) as one primer set and MTGR1-1699T (5′-GAGTCTACATGGCCACAGTCC-3′) and MTGR1-2020B (5′-GAAGCTGTGGAGTGCCTCTTG-3′) as a second primer set. Both PCR products were subcloned into pBluescript KS II. RNA probes, labeled with digoxigenin (DIG), were made from linearized plasmid and T7 polymerase for antisense probes or T3 polymerase for sense probes by using DIG RNA labeling mix (Roche, Indianapolis, IN). In situ hybridization was performed on frozen sections of paraformaldehyde-fixed small intestine isolated from mice perfused with 4% paraformaldehyde and placed into 4% paraformaldehyde at 4°C for overnight fixation. Rolls of the duodenum, jejunum, and ileum were quick-frozen with Super Friendly Freeze-it (Fisher) and 10-μm sections placed on glass slides. Sections were desiccated at room temperature and fixed in methanol at −20°C for 2 h. After inactivating endogenous peroxidases with 1% peroxide, sections were prehybridized at 60°C for 1 h, followed by hybridization with either antisense or sense probes for 18 h at 60°C. Slides were then washed with 0.2× SSC (1× SSC is 0.15 M NaCl plus 0.015 M sodium citrate)-0.1% Tween 20 at 60°C for 1 h. Sections were then blocked with 5% goat serum and 2% hybridization blocking reagent (Roche) for subsequent incubation with an anti-DIG antibody conjugated with horseradish peroxidase overnight (Roche). After washing the sections with phosphate-buffered saline-0.1% Tween 20, the locations of the probes were visualized with a TSA kit (Perkin-Elmer, Boston, MA) in accordance with the manufacturer's protocol. TSA cy3 was used with the TSA kit and probes visualized with a Zeiss Axiophot II with a cy3 fluorescence filter set. Pictures were taken with a spot camera with equal exposure times for antisense and sense probes.
Immunohistochemistry and histology.
Tissue was fixed in buffered formalin overnight at room temperature prior to embedding in paraffin and sectioning. Antibodies used for immunohistochemistry included anticryptdin antiserum (30), anti-chromogranin A (ImmunoStar, Hudson, WI), anti-Gfi1 (a kind gift from H. Bellen, Baylor College of Medicine), and antivillin (Chemicon). Antigen retrieval was performed on all of the sections with a neutral-pH antigen retrieval agent (DakoCytomation, Carpinteria, CA). The rabbit Envision+HRP System (DakoCytomation) and diaminobenzidine or NovaRed (Vector Laboratories, Burlingame, CA) was used to produce visible results. Sections were lightly counterstained with Mayer's hematoxylin prior to mounting. Hematoxylin-and-eosin (H&E) and periodic acid-Schiff (PAS) staining was performed according to standard procedures.
Northern blot analysis.
Tissue isolated from mice was frozen in liquid nitrogen and stored at −80°C. Frozen tissue was pulverized with a mortar and pestle and total RNA isolated with Trizol reagent (Invitrogen). Total RNA (15 μg) was analyzed by RNA blot analysis as previously described (21), with Hybond-N+ membrane (Amersham-Pharmacia). The Math1 and Hes1 cDNA probes were made by reverse transcription-PCR from total RNA isolated from mouse small intestine and subcloned into pBluescript KS II (Stratagene). The probe for Mtgr1 was a mouse EcoRI fragment spanning codons 129 through 395.
Bone marrow transplantation.
Bone marrow was harvested from 6- to 8-week-old Mtgr1-null donor mice injected 4 days before with 140 mg 5′-fluorouracil (Acros) per kg of weight. Approximately 5 × 10⁵ to 1 × 10⁶ cells were injected via the tail vein into lethally irradiated 6- to 8-week-old syngeneic recipient mice. Irradiation was 9 rads in a single dose, which caused death in nontransplanted control mice within 10 to 12 days. Six weeks posttransplantation, the small intestine was harvested, fixed, and sectioned prior to staining with H&E.
RESULTS
MTGR1 is a transcriptional corepressor.
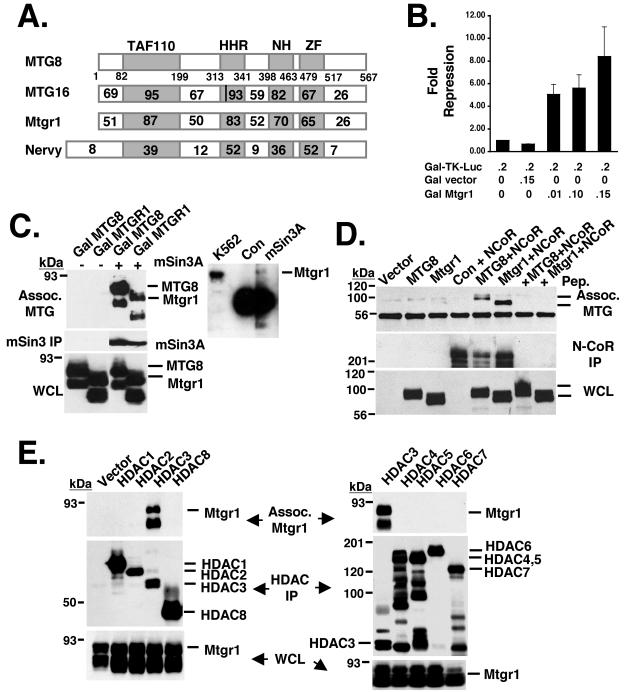
As a member of the MTG gene family (Fig. 1A), it would be expected that Mtgr1, like MTG8/ETO and MTG16/Eto2, encodes a factor that is capable of repressing a promoter when recruited to DNA. Therefore, we fused the DNA binding domain from the yeast transcription factor GAL4 to the N terminus of Mtgr1. Cotransfection of this construct with a reporter containing four GAL4 binding sites upstream of a minimal thymidine kinase promoter controlling expression of the firefly luciferase cDNA resulted in dose-dependent repression by Mtgr1 (Fig. 1B).
FIG. 1.
Mtgr1 is a transcriptional corepressor. (A) Schematic diagram showing the MTG family members, including Nervy. The number within each box indicates the percent identity of the region compared to MTG8. The vertical line in the HHR domain of MTG16 indicates the two amino acid changes that affect mSin3A binding. TAF110, transcriptional activating factor; HHR, hydrophobic heptad repeat; NH, Nervy homolog; ZF, zinc finger. (B) Mtgr1 repressed the transcription of a heterologous promoter in a dose-dependent fashion. The GAL-TK-luciferase reporter construct was cotransfected into NIH 3T3 cells with a control vector or increasing amounts of pCMV5-GAL-Mtgr1 as shown. Cells were harvested 48 h posttransfection and assayed for luciferase activity. The values shown were normalized with secreted alkaline phosphatase (pCMV-SEAP) as an internal control for transfection efficiency. Numbers shown below the bars are the amounts of DNA in micrograms. (C) FLAG-tagged mSin3A was cotransfected into Cos-7 cells with either empty vector; GAL-MTG8/ETO, used as a positive control (Con); or GAL-Mtgr1. After immunoprecipitation with anti-FLAG, GAL-MTG8 and GAL-Mtgr1 were detected by immunoblotting with anti-GAL4 (top). The expression of mSin3A was confirmed with anti-FLAG after immunoprecipitation (IP) (middle). The expression levels of Gal-MTG8 and Gal-Mtgr1 were confirmed by immunoblotting with anti-GAL (whole-cell lysate [WCL], bottom). In addition, endogenous mSin3A was precipitated with anti-mSin3A and copurifying Mtgr1 was identified by immunoblotting (right). (D) FLAG-N-CoR was cotransfected into Cos-7 cells with either GAL-MTG8 or GAL-Mtgr1. Anti-Gal immunoblots show that both Gal-MTG8 and Gal-Mtgr1 coimmunoprecipitated with N-CoR (top) and are present in the whole-cell lysate (bottom). Addition of the antigenic peptide to the FLAG beads prior to immunoprecipitation was used as a further control (+ Pep.). (E) FLAG-tagged (HDAC1 to -6), HA-tagged (HDAC7), and Myc-tagged (HDAC8) forms of the indicated HDACs were transfected into Cos-7 cells along with GAL-Mtgr1. Immunoprecipitation of the HDACs, followed by Gal immunoblotting (top), was used to detect Mtgr1 associated (Assoc.) with HDAC3. An anti-Gal immunoblot assay of the whole-cell lysate shows that Gal-Mtgr1 was expressed in every lane (bottom), while anti-FLAG/Myc or anti-FLAG/HA immunoblotting indicates that each HDAC was immunoprecipitated (middle) by the FLAG, HA, or Myc antibodies.
Given that other MTG family members recruit corepressors and HDACs, we tested whether Mtgr1 also associates with these factors. Mtgr1 contains the motif within the hydrophobic heptad repeat (HHR; the position of the two changes in MTG16 is marked by a vertical line in Fig. 1A) of MTG8/ETO that contacts mSin3A, predicting that Mtgr1 would also associate with this corepressor. Therefore, GAL-Mtgr1 and FLAG epitope-tagged mSin3A were coexpressed in Cos-7 cells and cell lysates were immunoprecipitated with anti-FLAG (Fig. 1C, middle), followed by immunoblot analysis to detect any associated Mtgr1 (Fig. 1C, top). As expected from the conservation of key residues of the HHR motif of MTG8, Mtgr1 associated with mSin3A. This association between endogenous Mtgr1 and mSin3A was confirmed in K562 cells, which express both mSin3A and Mtgr1 (Fig. 1C, right). MTG8 and MTG16 both associate with N-CoR, and coexpression of Mtgr1 and FLAG-N-CoR, followed by immunoprecipitation, indicated that these factors also copurify (Fig. 1D). In addition, we screened HDAC1 to -8 for association with Mtgr1. After coexpression and purification of each HDAC by immunoprecipitation, we found that Mtgr1 copurified only with HDAC3 (Fig. 1E, top). Thus, Mtgr1 is distinct from MTG8 and MTG16 in its recruitment of HDACs as the latter family members associated with multiple HDACs (1). Moreover, because mSin3A associates with HDAC1 and HDAC2, it is likely that the association between Mtgr1 and HDAC3 is not mediated by N-CoR, which is similar to the association between MTG8 and HDAC1 to -3 (1).
Creation of Mtgr1-null mice.
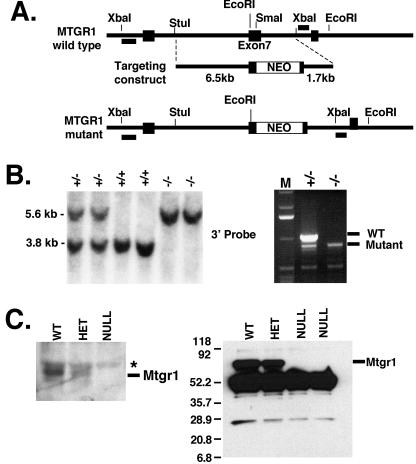
Defining a biological function for a transcriptional corepressor or placing a corepressor into a signaling pathway is a difficult task because these proteins act as cofactors or scaffolds without enzymatic activity or DNA binding capacities. Therefore, we took a genetic approach to attempt to define the biological functions that require Mtgr1. To inactivate Mtgr1 (CBFA2T2 is the designation of the Mtgr1 locus), we inserted the G418 resistance gene (Neo) into exon 7, which is within the first conserved domain that is found in all family members and the Drosophila homologue Nervy (Fig. 2A). Exon 7 was selected because of the extensive alternative splicing at the 5′ end of the gene (upstream of exon 4) (28). In addition, if exon 7 is spliced out because of the presence of Neo, a stop codon would be introduced into the mRNA when exon 6 is spliced to exon 8. We were able to identify multiple ES cell single-cell clones with Neo inserted correctly. Three clones were chosen for blastocyst injection, and the mutation was transmitted to progeny from all three ES cell lines. Examination of progeny by Southern blotting indicated the presence of Neo in one allele of the heterozygous animals and both alleles of the null animals (Fig. 2B, left). Two of these lines were analyzed in detail.
FIG. 2.
Creation of Mtgr1-null mice. (A) Schematic diagram showing a portion of the wild-type CBFA2T2 locus, the targeting construct, and the resulting mutated locus after insertion of the neomycin resistance cassette and the probes used (boxes). (B) On the left is a Southern blot of EcoRI-digested mouse tail DNA isolated from a litter of pups resulting from a heterozygous Mtgr1 mating. The expected 1.8-kb increase in the EcoRI fragment containing the Neo cassette can be seen in the lanes containing DNA from heterozygous and null mice. The right side shows that exon 7 is spliced out of the targeted mRNA. Reverse transcription-PCR of total RNA isolated from brains of heterozygous and null mice with primers that span exon 7 demonstrates that a heterozygous sample contains both the wild-type (WT; 1,037-bp) and mutant (855-bp) expected products, whereas the null sample contains only the mutant (855-bp) product. Lane M, size markers. The asterisk denotes the position of a nonspecific band. (C) Mtgr1 is missing in Mtgr1-null mice. A rabbit polyclonal antibody raised to the N terminus of Mtgr1 (anti-N-Mtgr1) was used in an immunoblot analysis of MEFs from wild-type, heterozygous, and null mice that were generated from single embryos (left). The asterisk marks the location of a nonspecific band present in all of the lanes of the immunoblot. The right side shows immunoprecipitation, followed by immunoblot analysis (4 to 20% gradient gel), of Mtgr1 protein from the lysates of MEFs derived from single embryos of the indicated genotypes with anti-N-Mtgr1 to exclude the presence of a truncated (22-kDa) form of the protein in heterozygous (HET) and null mice. The band migrating at approximately 28 kDa is the immunoglobulin G light chain. The values on the left are molecular sizes in kilodaltons.
Reverse transcriptase-PCR was performed to confirm that CBFA2T2 had indeed been disrupted in these mice. Primers flanking exon 7 were used, and this analysis indicated that some mRNA was still present that migrated with a mobility consistent with a deletion of exon 7 (Fig. 2B, right, faster-migrating band). Therefore, we cloned and sequenced this cDNA, and confirmed that exon 7 had been spliced out and that the mRNA contained the expected stop codon. Thus, nonsense-mediated mRNA degradation did not completely eliminate the targeted Mtgr1 mRNA. Nevertheless, immunoblot analysis (Fig. 2C, left) and immunoprecipitation, followed by immunoblot analysis with purified antibodies directed to the N terminus of Mtgr1 (Fig. 2C, right), indicated that neither a full-length nor a truncated Mtgr1 protein was produced at detectable levels in these mice (Fig. 2C). It is notable that leaving the Neo cassette in the Mtgr1 locus did not disrupt Mtgr1 transcriptional initiation, which makes it unlikely that this cassette affected the expression of genes 5′ to Mtgr1.
Mtgr1-null mice are small.
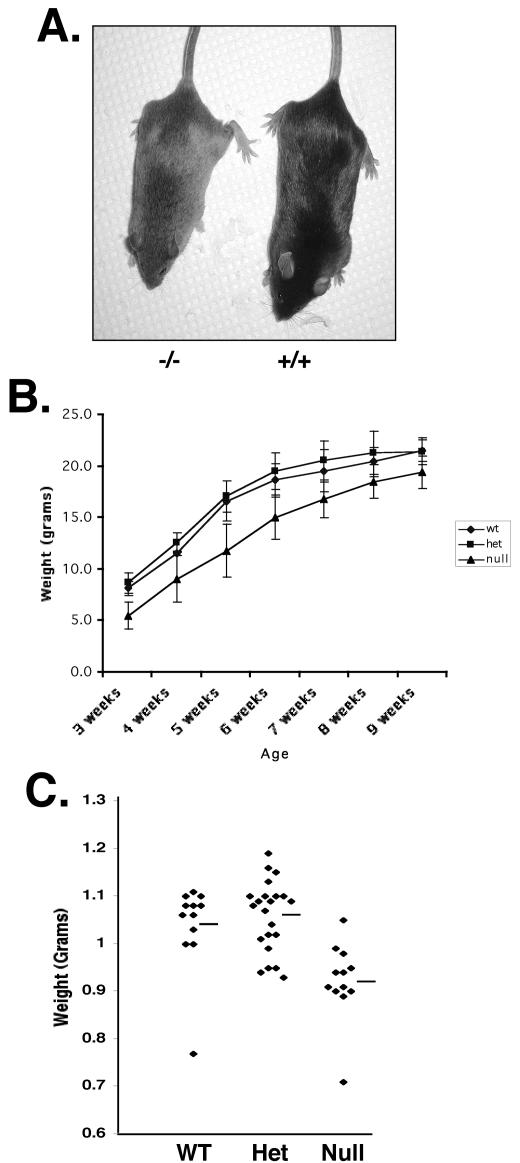
On a mixed SvEv129 × C57BL/6 genetic background, mice lacking Mtgr1 were obtained at the expected frequency, were fertile, and appeared anatomically normal. Although there is considerable diversity in the size of inbred mouse strains (e.g., mice can vary by 3 to 4 g within a litter), careful inspection indicated that the Mtgr1-null mice were 15 to 20% smaller than littermate controls (Fig. 3A). While this could be due to a feeding disorder or to a gut phenotype, as observed with Eto/Mtg8-null mice (4), the Mtgr1-null mice are shorter (Fig. 3A), suggesting that there is a developmental defect rather than a nutrient deficiency. Next, mice lacking Mtgr1 were backcrossed into a C57BL/6J background to create a more homogeneous genetic background to analyze Mtgr1 deficiency. After five backcrosses, the ratios of heterozygous to homozygous mice became skewed from the expected Mendelian ratios, with only 12% of the animals being homozygous null rather than the expected 25%. The size difference also increased, with null animals averaging nearly 30% less than their wild-type littermates (Fig. 3B). Examination of serum levels of growth hormone and insulin-like growth factor showed no significant differences between wild-type and null animals (data not shown). In addition, when embryos were harvested at 18.5 days postcoitus, the expected Mendelian ratios were present and the weights of Mtgr1-null animals averaged 20 to 30% less than those of the wild-type embryos (Fig. 3C). This indicates that roughly half of the Mtgr1-deficient animals were dying sometime between 18.5 days postcoitus and 21 days postbirth. In addition, the difference in the sizes of the animals is a developmental defect and not due to poor nutrient absorption, as their weight is affected prior to birth. Furthermore, MEFs lacking Mtgr1 grew at the same rate as wild-type cells in vitro and no differences in intrinsic cell size were observed (data not shown).
FIG. 3.
Mtgr1-null mice are smaller than wild-type (Wt) or heterozygous (Het) mice. (A) Picture showing the size difference between Mtgr1-null (−/−) and wild-type (+/+) mice. (B) The weights of Mtgr1-null or heterozygous mice that had been backcrossed to C57BL/6 mice for five or six generations were compared to those of wild-type littermates at the times indicated after birth. (C) Graph of the weights of embryonic day 18.5 wild-type and Mtgr1 heterozygous and null embryos. Bars show the average weight of each group.
Mtgr1-null mice lose the secretory cell lineage in the small intestine.
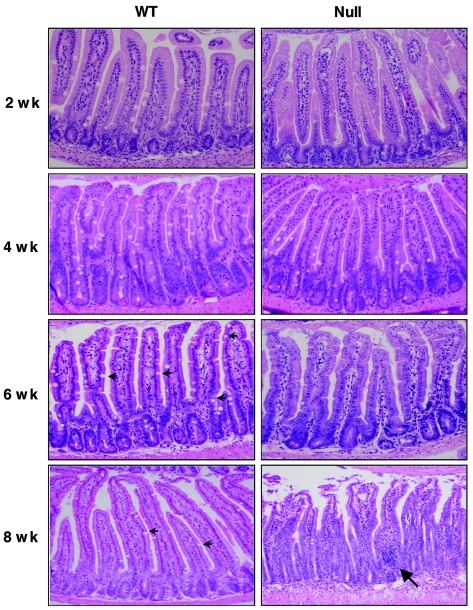
Necropsies of 2- to 12-week-old Mtgr1-null mice revealed no abnormalities at the gross anatomical level, and the histology of all of the major organs was normal (data not shown). However, given the dramatic phenotype associated with Mtg8 deficiency in the gut, we performed a detailed analysis of the small intestine and colon. At 2 weeks after birth, no defects were observed in the Mtgr1-null mice (Fig. 4). But by 4 weeks after birth, the normal architecture of the small intestines of the Mtgr1-deficient animals began to show a reduction in mucin-producing goblet cells in the small intestine, which progressed until an estimated 90 to 95% of the goblet cells were lost by 6 to 8 weeks after birth (small arrows, bottom left panel, Fig. 4; photos available upon request). By contrast, there were no changes in the cellular architecture of the colon (data not shown).
FIG. 4.
Loss of goblet cells in the small intestines of Mtgr1-null mice. H&E-stained sections of the jejuna (2, 6, and 8 weeks) or ilea (4 weeks) of wild-type (WT) and Mtgr1-null mice at the indicated times after birth. Note that by 6 weeks of age the null mice had dramatically reduced numbers of goblet cells. Arrows in the 6- and 8-week wild-type panels indicate the presence of numerous goblet cells. The large arrow in the 8-week null panel indicates an extreme example of an inflammatory cell infiltrate.
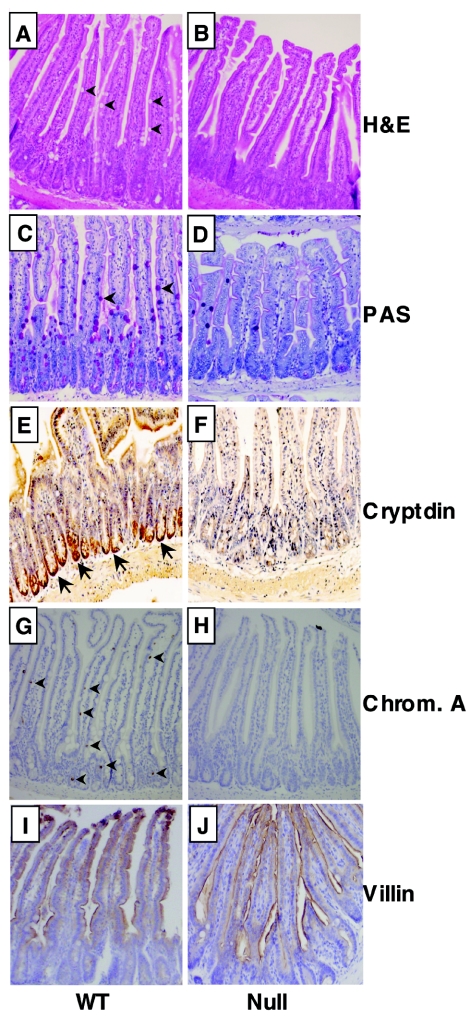
Goblet cells are derived from a common progenitor cell that gives rise to the secretory lineage (see Fig. 8A). Therefore, we tested whether the deletion of Mtgr1 affected other cell types in the small intestine. PAS stains mucin-producing goblet cells, confirming a dramatic reduction of these cells (Fig. 5C and D). In addition, antibacterial Paneth cells, which populate the bottoms of the crypts, were largely missing, as determined by immunohistochemical staining for cryptdin 1 (30) (Fig. 5E and F). A third lineage of the small intestinal epithelium, the enteroendocrine cell, was also greatly reduced in these mice, as determined by immunohistochemistry with anti-chromogranin A (arrowheads, Fig. 5G and H). Immunohistochemistry with anti-villin confirmed that enterocytes were produced normally (Fig. 5I and J). Thus, by 8 weeks of age the Mtgr1-null mice have dramatically reduced numbers of goblet, Paneth, and enteroendocrine cells, which constitute the secretory cell lineage in the small intestine.
FIG. 8.
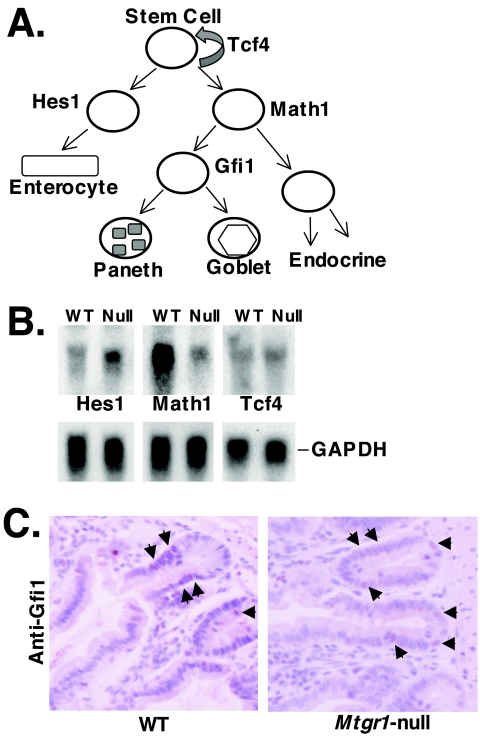
Deregulation of genes required for lineage decisions in the small intestine. (A) Schematic diagram of the differentiation program of the intestinal epithelial stem cell into its various lineages and some of the transcription factors that are known to take part in this process (35). (B) Expression of Hes1, Math1, and Tcf4 in the small intestines of 8-week-old wild-type (WT) and Mtgr1-null mice. RNA blot analysis was used to measure the levels of expression of the indicated genes. Glyceraldehyde-3-phosphate dehydrogenase (GAPDH) was used as a loading control. (C) Immunohistochemistry detects Gfi1-positive cells in the small intestines of Mtgr1-null mice. Formalin-fixed sections of wild-type and Mtgr1-null small intestines were stained with anti-Gfi1 and counterstained with hematoxylin. Arrows indicate examples of Gfi1-positive cells. Note that the positions of the Gfi1-positive cells are altered in the Mtgr1-null mice due to the presence of fewer Paneth cells.
FIG. 5.
Mtgr1-null mice lose the secretory cell lineage in the small intestine. (A and B) H&E staining of the jejuna of 8-week-old wild-type (WT) and null mice. Note that the null mice have dramatically reduced numbers of goblet cells, which are clear (wild type, arrows). (C and D) PAS staining of the jejuna of 6-week-old mice to detect goblet cells (wild type, arrows). (E and F) Immunohistochemical staining of the jejuna from 8-week-old mice with rabbit anti-cryptdin 1 to identify Paneth cells. Positive staining at the base of the crypts is indicated by arrows. (G and H) Immunohistochemical staining of the jejuna of 8-week-old mice with anti-chromogranin (Chrom.) A. Arrows indicate a number of the staining enteroendocrine cells. (I and J) Immunohistochemical staining of the jejuna of 8-week-old mice with anti-villin. Positive staining is brown with a blue hematoxylin counterstain.
In addition to the loss of these cell lineages, some Mtgr1-null mice showed stunted villi and occasionally there was a reduction in the brush border microvilli (data not shown and Fig. 4 [the 8-week null panel shows an example of stunted villi]). We also noted an increased number of apoptotic bodies in the crypts. Furthermore, the intestines of Mtgr1-null mice displayed infiltration of inflammatory cells and histological analysis indicated the presence of lymphoid aggregates and granulocytes with occasional accumulations of eosinophils (Fig. 4 [the 8-week panel shows an extreme example]). Immunohistochemical studies with antibodies to B220 and CD3 demonstrated that the lymphoid aggregates were a mixture of B and T cells. Flow cytometry with antibodies to CD3, CD11, B220/CD45R, Ly6, and Ter119 indicated that the cellularity of the bone marrow was within normal limits (data not shown). While the spleens showed hyperplastic germinal centers in the white pulp, the overall architecture was maintained, which is consistent with a reactive response. Overall, the infiltration of the gut is most consistent with a mild inflammatory process of the small intestine, which may be secondary to the loss of the secretory cell lineage, as the inflammation was often not observed in 4- to 6-week-old animals, in which the secretory lineage was already being lost.
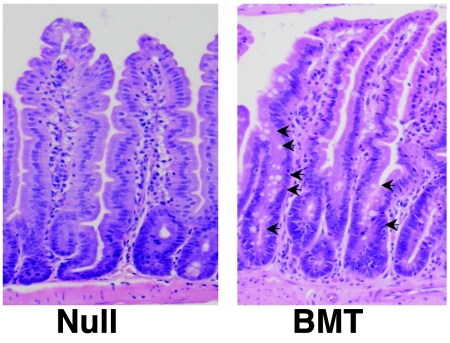
Because inflammation can be associated with erosion of the intestinal epithelium, we tested the possibility that the reduction of the secretory cells in the Mtgr1-null mice was due to an inflammatory process, rather than an intrinsic defect in the epithelium. Bone marrow lacking Mtgr1 was transplanted into wild-type mice that were lethally irradiated to create mice lacking Mtgr1 only within the hematopoietic system. The intestinal epithelium was analyzed after 6 weeks to allow the epithelium time to recover from the irradiation and to allow time for any reduction in the levels of the secretory cells, if any, as the reduction of these cells began at 4 week of age (Fig. 4). By comparison to adult Mtgr1-null small intestines, the intestinal epithelium from wild-type mice transplanted with Mtgr1-null marrow contained normal numbers of goblet cells (Fig. 6), suggesting that the phenotype observed was due to an intrinsic defect in the epithelium.
FIG. 6.
H&E staining of sections from a 15-week-old Mtgr1-null small intestine and a 15-week-old wild-type mouse transplanted with Mtgr1-null bone marrow 6 weeks earlier (BMT). Arrows indicate goblet cells.
Mtgr1 mRNA is most highly expressed in the crypts of Lieberkuhn.
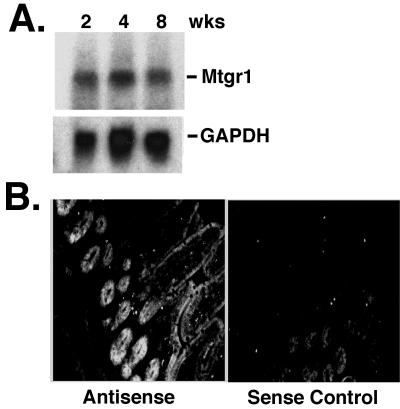
RNA blot analysis indicated that Mtgr1 is expressed in most of the tissues examined, with the exception of the lung and liver tissues. The highest expression levels were seen in the brain, heart, and skeletal muscle, with only moderate levels expressed in the small intestine and colon (10, 28). Because Mtgr1 is required for the maintenance of the secretory cell lineage near the weaning transition (Fig. 5), we performed RNA blot analysis to determine whether Mtgr1 was expressed in the small intestines of wild-type animals at 2, 4, and 8 weeks postbirth. The overall levels of Mtgr1 mRNA were unchanged within this time frame (Fig. 7A). Although ETO/MTG8 is expressed during embryogenesis and plays a critical role in the embryonic development of the small and large intestines, neither Eto/Mtg8 nor Eto2/Mtg16 was expressed at levels readily detectable by RNA blot analysis in the small intestines of 2- to 8-week-old mice (data not shown).
FIG. 7.
Mtgr1 is expressed in the crypts of the small intestine. (A) RNA blot analysis to measure Mtgr1 mRNA was performed with RNA isolated from the small intestines of mice at 2, 4, and 8 weeks of age. Glyceraldehyde-3-phosphate dehydrogenase (GAPDH) was used as a loading control. (B) In situ hybridization with an antisense probe to the Mtgr1 mRNA (left) reveals that Mtgr1 mRNA is present in epithelial cells in the small intestine. The highest level of expression was in the area of the crypt. In situ hybridization with a sense probe (right) as a negative control was performed at the same time. The positive signal is white.
To identify the cell types that express Mtgr1 in the small intestine, we performed RNA in situ hybridization analysis with two antisense probes to different regions of Mtgr1 and two sense probes as negative controls (Fig. 7B and data not shown). The two antisense probes gave similar results, with both sense probes yielding only a small amount of background (Fig. 7B, right). Mtgr1 mRNA was detected in the epithelium of the villi, but the highest levels of expression were found in the crypts of Lieberkuhn, which is the location of the proliferating stem/progenitor cell population (Fig. 7B).
Mtgr1-null mice retain Gfi1-positive progenitor cells.
In the small intestine, Hes1 is required for the development of the enterocyte lineage (16), Math1 is required for the secretory lineage (35), and Tcf4 is required for stem cell self-renewal (2, 19) (summarized in Fig. 8A). Given the key roles of these factors in gut development, we examined their expression in the small intestines of 8-week-old Mtgr1-deficient mice (Fig. 8B). The levels of Tcf4 were unchanged, but Hes1 was up regulated approximately twofold and Math1 was down regulated approximately fourfold (Fig. 8B). The changes in Hes1 and Math1 expression may contribute to the loss of the secretory lineage in the small intestines of Mtgr1-null mice.
Given that Math1 is expressed in secretory cells and that it is required for the formation of the secretory lineage (35), we used immunohistochemistry to examine whether secretory lineage progenitor cells were retained in the absence of Mtgr1 to determine at what level the defect in secretory lineage maturation occurred. We used two different antibodies directed to Math1, but neither worked in small intestinal sections (data not shown). Therefore, because Gfi1 is downstream of Math1 in small intestinal development (Fig. 8A and reference 31) and Gfi1 is required for the formation of goblet and Paneth cells (31), we used anti-Gfi1 in immunohistochemistry (Fig. 8C). Compared to wild-type control littermates, the Mtgr1-null mice appeared to have similar numbers of Gfi1-positive cells in the crypts of the small intestine (Fig. 8C). Although the Gfi1-positive progenitors were present, they failed to mature, suggesting that these cells undergo apoptosis, which is consistent with our observation of more apoptotic bodies in the crypts of the Mtgr1-null small intestines.
DISCUSSION
The chromosomal translocations that are associated with acute leukemia target master regulators of apoptosis, cellular proliferation, and cellular differentiation (22). Our work suggests that the MTG/ETO family contributes to cellular differentiation and/or lineage decisions, as removal of Mtgr1 resulted in a failure to maintain the secretory lineage in the small intestine (Fig. 4 and 5). Given that the MTG family members are nuclear, associate with transcriptional corepressors and HDACs, and are recruited by DNA binding transcriptional repressors, it is likely that derepression of critical regulatory genes produces alterations in lineage decisions and/or an induction of apoptosis, which leads to the failure to maintain goblet, Paneth, and endocrine cells in the small intestine.
It is intriguing that Gfi1-positive progenitor cells are maintained in the absence of Mtgr1 but that these cells fail to differentiate into mature goblet and Paneth cells. Gfi1 is a DNA binding transcriptional repressor that associates with MTG8/ETO (24). We have confirmed that, like MTG8/ETO, Mtgr1 also can associate with Gfi1 (unpublished data). Given that MTG8/ETO is only expressed in the gut during embryogenesis and Mtg16/Eto-2 is not expressed in the small intestine (data not shown), the loss of Mtgr1 may functionally inactivate Gfi1-mediated repression in the adult small intestine. If so, this would provide a molecular basis for the loss of Paneth and goblet cells that we observed in Mtgr1-null mice. However, Gfi-1-null mice also displayed increased numbers of endocrine cells (31) whereas Mtgr1-null small intestines have fewer endocrine cells (Fig. 5). Thus, loss of Mtgr1 could only be considered a partial phenocopy of Gfi-1 deletion in the gut.
In regard to a possible genetic interaction between Gfi1 and Mtgr1, it is also noteworthy that the Gfi1-null mice display neurological defects that include ataxia, walking with a head tilt, and progressive deafness due to inner ear defects (33). Consistent with loss of Mtgr1 genetically interacting with Gfi1, 10 to 15% of the Mtgr1-null mice with a mixed SvEv129 × C57BL/6 genetic background began to walk with a head tilt as they reached 6 to 8 months of age and these mice did not respond to noise (J. Amann, unpublished data). Given the gut and neurological similarities between the Gfi1- and Mtgr1-null mice and the previous association between Gfi1 and MTG8 (24), it is possible that impairment of Gfi1-mediated repression contributes to the phenotypes observed in Mtgr1-null mice.
Given the role that the MTG family plays in the formation of acute myeloid leukemia, we performed a preliminary analysis of hematopoiesis in Mtgr1-null mice but observed normal cellularity in the bone marrow. However, on a mixed SvEv129 × C57BL/6 genetic background we noted that a number of mice contained an enlarged thymus. Immunophenotyping with anti-CD3, anti-CD4, and anti-CD8, coupled with bromodeoxyuridine incorporation analysis, suggested that the expanded T-cell population was CD3 positive and cycling. However, this was the only consistent disruption of hematopoiesis observed (with antibodies to CD3, CD11, B220/CD45R, Ly6, and Ter119), and this phenotype was lost after three or four generations of breeding with C57BL/6 mice. The lack of a more dramatic hematopoietic phenotype in Mtgr1-null mice was likely due to compensation given that Mtg16/Eto-2 is widely expressed in hematopoietic cells and MTG8/ETO is also expressed, but perhaps in a more cell-type-restricted manner (5).
In addition to the loss of goblet and Paneth cells, we observed a loss of enteroendrocrine cells in the small intestines of Mtgr1-null mice, which cannot be explained by inactivation of Gfi1. Therefore, it is likely that the disruption of Mtgr1 affects repression mediated by multiple DNA binding factors that rely on MTG family members for repression. Hes1, Math1, and Tcf4 are required for lineage decision in the small intestine and thus are logical candidates, but only Hes1 is a repressor and inactivation of Hes1 affects the enterocytic lineage (Fig. 8A). Thus, if loss of Gfi1-mediated repression would explain the loss of goblet and Paneth cells, then one or more yet to be identified transcriptional repressors that recruit Mtgr1 are likely to mediate the loss of endocrine cells in Mtgr1-null mice. Moreover, this genetic analysis of Mtgr1 indicates that this factor is important for maintaining cell lineages in tissues that fail to express Mtg8 or Mtg16, which might imply a larger role for the MTG family of corepressors in other tissues (e.g., hematopoiesis) that may be uncovered when multiple MTG family members are removed.
Acknowledgments
We thank the members of the Hiebert lab for helpful discussions and encouragement and the Vanderbilt-Ingram Cancer Center (CA68485) and the Vanderbilt Digestive Diseases Research Center (5P30DK58404-03) for support and the use of shared resources, including DNA sequencing, transgenic/ES cell, immunohistochemistry, microarray, and histological analyses.
This work was supported by National Institutes of Health grants RO1-CA87549, RO1-CA64140, RO1-CA77274, and RO1-CA112005 (S.W.H.); the Mouse Models of Human Cancer Consortium and CA46413 (R.J.C.); and Leukemia and Lymphoma Society postdoctoral fellowship 5074-03 (B.J.I.) and training grants T32DK07673 (A.M.) and T32-CA09582 (A.C.M.).
REFERENCES
- 1.Amann, J. M., J. Nip, D. K. Strom, B. Lutterbach, H. Harada, N. Lenny, J. R. Downing, S. Meyers, and S. W. Hiebert. 2001. ETO, a target of t(8;21) in acute leukemia, makes distinct contacts with multiple histone deacetylases and binds mSin3A through its oligomerization domain. Mol. Cell. Biol. 21:6470-6483. [DOI] [PMC free article] [PubMed] [Google Scholar]
- 2.Batlle, E., J. T. Henderson, H. Beghtel, M. M. van den Born, E. Sancho, G. Huls, J. Meeldijk, J. Robertson, M. van de Wetering, T. Pawson, and H. Clevers. 2002. Beta-catenin and TCF mediate cell positioning in the intestinal epithelium by controlling the expression of EphB/ephrinB. Cell 111:251-263. [DOI] [PubMed] [Google Scholar]
- 3.Calabi, F., and V. Cilli. 1998. CBFA2T1, a gene rearranged in human leukemia, is a member of a multigene family. Genomics 52:332-341. [DOI] [PubMed] [Google Scholar]
- 4.Calabi, F., R. Pannell, and G. Pavloska. 2001. Gene targeting reveals a crucial role for MTG8 in the gut. Mol. Cell. Biol. 21:5658-5666. [DOI] [PMC free article] [PubMed] [Google Scholar]
- 5.Davis, J. N., L. McGhee, and S. Meyers. 2003. The ETO (MTG8) gene family. Gene 303:1-10. [DOI] [PubMed] [Google Scholar]
- 6.Davis, J. N., B. J. Williams, J. T. Herron, F. J. Galiano, and S. Meyers. 1999. ETO-2, a new member of the ETO-family of nuclear proteins. Oncogene 18:1375-1383. [DOI] [PubMed] [Google Scholar]
- 7.Erickson, P., J. Gao, K. S. Chang, T. Look, E. Whisenant, S. Raimondi, R. Lasher, J. Trujillo, J. Rowley, and H. Drabkin. 1992. Identification of breakpoints in t(8;21) acute myelogenous leukemia and isolation of a fusion transcript, AML1/ETO, with similarity to Drosophila segmentation gene, runt. Blood 80:1825-1831. [PubMed] [Google Scholar]
- 8.Feinstein, P. G., K. Kornfeld, D. S. Hogness, and R. S. Mann. 1995. Identification of homeotic target genes in Drosophila melanogaster including nervy, a proto-oncogene homologue. Genetics 140:573-586. [DOI] [PMC free article] [PubMed] [Google Scholar]
- 9.Fenrick, R., J. M. Amann, B. Lutterbach, L. Wang, J. J. Westendorf, J. R. Downing, and S. W. Hiebert. 1999. Both TEL and AML-1 contribute repression domains to the t(12;21) fusion protein. Mol. Cell. Biol. 19:6566-6574. [DOI] [PMC free article] [PubMed] [Google Scholar]
- 10.Fracchiolla, N. S., G. Colombo, P. Finelli, A. T. Maiolo, and A. Neri. 1998. EHT, a new member of the MTG8/ETO gene family, maps on 20q11 region and is deleted in acute myeloid leukemias. Blood 92:3481-3484. [PubMed] [Google Scholar]
- 11.Frank, R., J. Zhang, H. Uchida, S. Meyers, S. W. Hiebert, and S. D. Nimer. 1995. The AML1/ETO fusion protein blocks transactivation of the GM-CSF promoter by AML1B. Oncogene 11:2667-2674. [PubMed] [Google Scholar]
- 12.Gamou, T., E. Kitamura, F. Hosoda, K. Shimizu, K. Shinohara, Y. Hayashi, T. Nagase, Y. Yokoyama, and M. Ohki. 1998. The partner gene of AML1 in t(16;21) myeloid malignancies is a novel member of the MTG8(ETO) family. Blood 91:4028-4037. [PubMed] [Google Scholar]
- 13.Gelmetti, V., J. Zhang, M. Fanelli, S. Minucci, P. G. Pelicci, and M. A. Lazar. 1998. Aberrant recruitment of the nuclear receptor corepressor-histone deacetylase complex by the acute myeloid leukemia fusion partner ETO. Mol. Cell. Biol. 18:7185-7191. [DOI] [PMC free article] [PubMed] [Google Scholar]
- 14.Hildebrand, D., J. Tiefenbach, T. Heinzel, M. Grez, and A. B. Maurer. 2001. Multiple regions of eto cooperate in transcriptional repression. J. Biol. Chem. 276:9889-9895. [DOI] [PubMed] [Google Scholar]
- 15.Hope, K. J., L. Jin, and J. E. Dick. 2003. Human acute myeloid leukemia stem cells. Arch. Med. Res. 34:507-514. [DOI] [PubMed] [Google Scholar]
- 16.Jensen, J., E. E. Pedersen, P. Galante, J. Hald, R. S. Heller, M. Ishibashi, R. Kageyama, F. Guillemot, P. Serup, and O. D. Madsen. 2000. Control of endodermal endocrine development by Hes-1. Nat. Genet. 24:36-44. [DOI] [PubMed] [Google Scholar]
- 17.Kao, H. Y., M. Downes, P. Ordentlich, and R. M. Evans. 2000. Isolation of a novel histone deacetylase reveals that class I and class II deacetylases promote SMRT-mediated repression. Genes Dev. 14:55-66. [PMC free article] [PubMed] [Google Scholar]
- 18.Kitabayashi, I., K. Ida, F. Morohoshi, A. Yokoyama, N. Mitsuhashi, K. Shimizu, N. Nomura, Y. Hayashi, and M. Ohki. 1998. The AML1-MTG8 leukemic fusion protein forms a complex with a novel member of the MTG8(ETO/CDR) family, MTGR1. Mol. Cell. Biol. 18:846-858. [DOI] [PMC free article] [PubMed] [Google Scholar]
- 19.Korinek, V., N. Barker, P. Moerer, E. van Donselaar, G. Huls, P. J. Peters, and H. Clevers. 1998. Depletion of epithelial stem-cell compartments in the small intestine of mice lacking Tcf-4. Nat. Genet. 19:379-383. [DOI] [PubMed] [Google Scholar]
- 20.Lenny, N., S. Meyers, and S. W. Hiebert. 1995. Functional domains of the t(8;21) fusion protein, AML-1/ETO. Oncogene 11:1761-1769. [PubMed] [Google Scholar]
- 21.Linggi, B., C. Muller-Tidow, L. van de Locht, M. Hu, J. Nip, H. Serve, W. E. Berdel, B. van der Reijden, D. E. Quelle, J. D. Rowley, J. Cleveland, J. H. Jansen, P. P. Pandolfi, and S. W. Hiebert. 2002. The t(8;21) fusion protein, AML1 ETO, specifically represses the transcription of the p14(ARF) tumor suppressor in acute myeloid leukemia. Nat. Med. 8:743-750. [DOI] [PubMed] [Google Scholar]
- 22.Look, A. T. 1997. Oncogenic transcription factors in the human acute leukemias. Science 278:1059-1064. [DOI] [PubMed] [Google Scholar]
- 23.Lutterbach, B., J. J. Westendorf, B. Linggi, A. Patten, M. Moniwa, J. R. Davie, K. D. Huynh, V. J. Bardwell, R. M. Lavinsky, M. G. Rosenfeld, C. Glass, E. Seto, and S. W. Hiebert. 1998. ETO, a target of t(8;21) in acute leukemia, interacts with the N-CoR and mSin3 corepressors. Mol. Cell. Biol. 18:7176-7184. [DOI] [PMC free article] [PubMed] [Google Scholar]
- 24.McGhee, L., J. Bryan, L. Elliott, H. L. Grimes, A. Kazanjian, J. N. Davis, and S. Meyers. 2003. Gfi-1 attaches to the nuclear matrix, associates with ETO (MTG8) and histone deacetylase proteins, and represses transcription using a TSA-sensitive mechanism. J. Cell. Biochem. 89:1005-1018. [DOI] [PubMed] [Google Scholar]
- 25.Meyers, S., N. Lenny, and S. W. Hiebert. 1995. The t(8;21) fusion protein interferes with AML-1B-dependent transcriptional activation. Mol. Cell. Biol. 15:1974-1982. [DOI] [PMC free article] [PubMed] [Google Scholar]
- 26.Miyoshi, H., T. Kozu, K. Shimizu, K. Enomoto, N. Maseki, Y. Kaneko, N. Kamada, and M. Ohki. 1993. The t(8;21) translocation in acute myeloid leukemia results in production of an AML1-MTG8 fusion transcript. EMBO J. 12:2715-2721. [DOI] [PMC free article] [PubMed] [Google Scholar]
- 27.Miyoshi, H., K. Shimizu, T. Kozu, N. Maseki, Y. Kaneko, and M. Ohki. 1991. t(8;21) breakpoints on chromosome 21 in acute myeloid leukemia are clustered within a limited region of a single gene, AML1. Proc. Natl. Acad. Sci. USA 88:10431-10434. [DOI] [PMC free article] [PubMed] [Google Scholar]
- 28.Morohoshi, F., S. Mitani, N. Mitsuhashi, I. Kitabayashi, E. Takahashi, M. Suzuki, N. Munakata, and M. Ohki. 2000. Structure and expression pattern of a human MTG8/ETO family gene, MTGR1. Gene 241:287-295. [DOI] [PubMed] [Google Scholar]
- 29.Rowley, J. D. 1999. The role of chromosome translocations in leukemogenesis. Semin. Hematol. 36:59-72. [PubMed] [Google Scholar]
- 30.Selsted, M. E., S. I. Miller, A. H. Henschen, and A. J. Ouellette. 1992. Enteric defensins: antibiotic peptide components of intestinal host defense. J. Cell Biol. 118:929-936. [DOI] [PMC free article] [PubMed] [Google Scholar]
- 31.Shroyer, N. F., D. W. Schultz, K. J. T. Venken, H. J. Bellen, and H. Y. Zoghbi. Genes Dev., in press. [DOI] [PMC free article] [PubMed]
- 32.Tybulewicz, V. L., C. E. Crawford, P. K. Jackson, R. T. Bronson, and R. C. Mulligan. 1991. Neonatal lethality and lymphopenia in mice with a homozygous disruption of the c-abl proto-oncogene. Cell 65:1153-1163. [DOI] [PubMed] [Google Scholar]
- 33.Wallis, D., M. Hamblen, Y. Zhou, K. J. Venken, A. Schumacher, H. L. Grimes, H. Y. Zoghbi, S. H. Orkin, and H. J. Bellen. 2003. The zinc finger transcription factor Gfi1, implicated in lymphomagenesis, is required for inner ear hair cell differentiation and survival. Development 130:221-232. [DOI] [PubMed] [Google Scholar]
- 34.Wang, J., T. Hoshino, R. L. Redner, S. Kajigaya, and J. M. Liu. 1998. ETO, fusion partner in t(8;21) acute myeloid leukemia, represses transcription by interaction with the human N-CoR/mSin3/HDAC1 complex. Proc. Natl. Acad. Sci. USA 95:10860-10865. [DOI] [PMC free article] [PubMed] [Google Scholar]
- 35.Yang, Q., N. A. Bermingham, M. J. Finegold, and H. Y. Zoghbi. 2001. Requirement of Math1 for secretory cell lineage commitment in the mouse intestine. Science 294:2155-2158. [DOI] [PubMed] [Google Scholar]


