Abstract
Many proinflammatory cytokines, such as leptin, play key roles in dynamic regulation of energy expenditure and food intake. The present work tested a role for the proinflammatory cytokine GM-CSF. Central but not peripheral administration of GM-CSF to adult rats significantly decreased food intake and body weight for at least 48 hours. Similar results were observed following central administration of GM-CSF in mice. GM-CSF receptor immunoreactivity was found on neurons within the paraventricular and arcuate nuclei of the hypothalamus. GM-CSF–deficient (GM–/–) mice weighed more and had significantly higher total body fat than wild-type (GM+/+) mice. Energy expenditure in GM–/– mice was decreased compared with that in GM+/+ mice. Taken together, these findings demonstrate that GM-CSF signaling in the CNS can regulate energy homeostasis.
Introduction
Maintenance of energy homeostasis requires the accurate matching of caloric intake to caloric expenditure over time. When such energy balance is maintained, stored energy in the form of adipose mass is defended. A wide range of CNS systems have been linked to the control of energy balance by their responses to peripheral signals that reflect the status of stored energy. These systems provide potential targets for therapeutic intervention to treat the growing problem of obesity. One peripheral signal regulating these central circuits is the adipocyte-derived cytokine leptin. Low levels of leptin signaling stimulate increased food intake and weight gain (1). A wider role for leptin as a cytokine has become apparent, as new functions that extend beyond energy balance are uncovered. Leptin receptors (LepRs) have been detected in hematopoietic cells, and leptin induces proliferation, differentiation, and functional activation of these cells (2). These actions are analogous to those of the cytokine GM-CSF, which is used clinically to stimulate hematopoiesis (3). Moreover, both GM-CSF and leptin have proinflammatory actions that guide inflammatory and immune responses (4, 5).
Since leptin and GM-CSF share overlapping functions in the periphery, we hypothesized that GM-CSF may also play an important role in regulating energy balance. Here, we report the effect of central and peripheral administration of GM-CSF in rats and mice, the distribution of GM-CSF receptor in hypothalamus, and the consequences of loss of GM-CSF signaling in mice.
Results
Central administration of GM-CSF suppresses food intake and reduces body weight in rats and mice.
To determine the effect of GM-CSF on food intake, we administered a range of doses from 50 ng to 6 μg of recombinant rat GM-CSF into the third cerebral ventricle of rats. Doses from 0.1–0.5 μg suppressed food intake and/or body weight in some experiments, but not reproducibly (data not shown). A dose of 0.6 μg consistently suppressed food intake and decreased body weight (Figure 1, A and B). In subsequent experiments, intracerebral third ventricular (i3vt) administration of 0.6 μg rat GM-CSF significantly decreased food intake as early as 4 hours (Figure 1C), and the suppression lasted for at least 24 hours following treatment (Figure 1D) in association with decreased body weight at 24 hours (Supplemental Figure 1A; supplemental material available online with this article; doi:10.1172/JCI25681DS1). There was no change in fecal output (number of pellets or appearance) between groups (data not shown). Higher doses of 1 or 6 μg were as effective as 0.6 μg but did not cause further suppression (Supplemental Figure 1B). As a control for the specificity of GM-CSF, we compared equal doses of rat and human GM-CSF, since it has previously been demonstrated that human GM-CSF does not bind to rat GM-CSF receptors (6). As expected, rat GM-CSF suppressed food intake and body weight, whereas human GM-CSF did not (Figure 1D and Supplemental Figure 1C), supporting the contention that the effects of GM-CSF to suppress food intake are the result of a specific action of GM-CSF on its associated receptor. All subsequent experiments with rats were performed with rat GM-CSF only.
Figure 1.
i3vt injection of rat GM-CSF in rats. (A) Rats received a single injection of 0.03, 0.06, or 0.6 μg recombinant rat GM-CSF, or vehicle (Veh) alone. Twenty-four-hour food intake was significantly decreased in rats receiving 0.6 μg GM-CSF. (B) Change in body weight at 24 hours after injection was significantly greater in rats receiving 0.6 μg GM-CSF. (C) Rats were injected with 0.6 μg GM-CSF or vehicle. GM-CSF treatment significantly suppressed food intake at 4 hours, compared with vehicle treatment. (D) Rats were injected with 0.6 μg rat GM-CSF or recombinant human GM-CSF (hGM). While 24-hour food intake was suppressed with rat GM-CSF, human GM-CSF–treated rats did not differ from vehicle-treated rats. (E) Rats were injected with 0.6 μg GM-CSF or vehicle, followed by a 24-hour fast (day 1). Weight loss at 24 hours after injection was greater in rats injected with GM-CSF compared with vehicle. (F) When food was returned, anorexia persisted for an additional 24 hours (day 2). For all rat studies, n = 7–9; error bars show mean ± SEM. Twenty-four-hour food intake (G) and body weight (H) were decreased in mice receiving 1 μg mouse GM-CSF, compared with those receiving vehicle. n = 5–6; mean ± SEM. *P < 0.05.
To determine the contribution of gut contents to the difference in body weight, we repeated the experiment in the absence of food. In rats fasted during the 24-hour period following central injection, weight loss was greater with GM-CSF than with vehicle treatment (Figure 1E). This suggests that GM-CSF had additional effects on energy balance besides simply regulating caloric intake. Further, when food was returned, GM-CSF–treated rats showed less rebound hyperphagia than vehicle-treated rats over the subsequent 24-hour period (Figure 1F), with sustained decrease in body weight (Supplemental Figure 1C). When vehicle or 1 μg recombinant mouse GM-CSF was injected i3vt into wild-type mice, 24-hour food intake and body weight were decreased to a similar degree as that in rats (Figure 1, G and H).
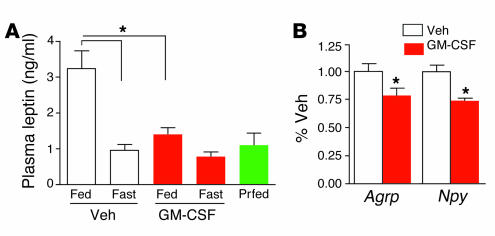
Plasma leptin was measured at 24 hours after administration of vehicle or GM-CSF in 5 cohorts of rats fed ad libitum or fasted following injection (Figure 2A). In fed rats, leptin was decreased following GM-CSF injection, compared with vehicle. Leptin levels were all similar in fasted vehicle- and GM-CSF–treated rats and a pair-fed group with food intake restricted to the amount consumed by rats in the fed GM-CSF treatment group. In a separate experiment, rats were injected with GM-CSF or vehicle and fasted for 24 hours, and a second dose of GM-CSF was administered at 24 hours after the initial injection. Four hours after receiving the second injection, rats were killed, and RNA was harvested from hypothalamus for gene expression measurements. Agouti-related peptide (AgRP) and neuropeptide Y (NPY) expression was significantly decreased in rats that received i3vt GM-CSF, compared with those receiving vehicle (Figure 2B). There was a trend toward increased proopiomelanocortin (POMC) gene expression, but it was not statistically significant (data not shown).
Figure 2.
Plasma leptin and hypothalamic AgRP and NPY expression were decreased following GM-CSF treatment. (A) Rats were given i3vt injections of vehicle or GM-CSF and then fed, fasted (Fast), or pair-fed (Prfed) for 24 hours. In fed rats, GM-CSF treatment decreased leptin levels compared with vehicle treatment. Fasted groups did not differ despite treatment and were similar to a pair-fed group. *P < 0.05; n = 7–9; mean ± SEM. (B) AgRP and NPY expression in hypothalamus was decreased in fasted rats killed after receiving 2 daily injections of GM-CSF. *P < 0.05; n = 5–7; mean ± SEM.
Reduction of food intake was not associated with visceral illness or motor impairment.
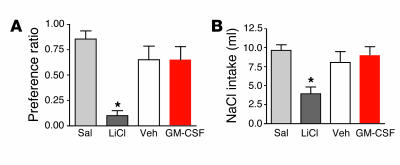
To determine whether the reduction in food intake was secondary to illness or motor impairment, we employed 2 paradigms: conditioned taste aversion (CTA) and sodium appetite. CTA takes advantage of the fact that rats avoid novel flavors that have been paired with treatments, such as toxic doses of i.p. lithium (LiCl), that produce illness (7). The degree to which rats avoid a treatment-paired flavor can be used as an index of the aversive consequences produced by the treatment. Flavors were nonsweetened Kool-Aid brand (Kraft Foods Inc.) grape or cherry mixes prepared with twice the amount of water as directed, and with 0.15% sodium saccharin. Pairing of flavors to treatments was counterbalanced across all groups. As a result, some animals in each group received cherry as flavor 1 and grape as flavor 2, while others received the reverse. During phase 1, water was replaced with flavor 1 ad libitum for 5 days. Flavor 1 was then replaced by water for 48 hours. In phase 2, rats were given 24-hour ad libitum access to flavor 2 instead of water immediately before receiving an i.p. injection of LiCl or saline or i3vt injection of 0.6 μg GM-CSF or vehicle. During the final test phase 2–4 days later, all rats were given 24-hour access to both flavor 1 and flavor 2 without access to water. Intake of both flavors was recorded after 24 hours, along with food intake and body weight. Unlike what occurred following injection of LiCl, i3vt GM-CSF treatment did not elicit a CTA during the final test phase (Figure 3A).
Figure 3.
Tests for visceral illness following injection of GM-CSF. (A) Injection of isotonic saline (Sal) or lithium chloride (LiCl) or an i3vt injection of 0.6 μg GM-CSF or vehicle was paired with introduction of a novel grape- or cherry-flavored 0.15% saccharin solution. On a subsequent test day, intake of the flavor paired with LiCl was reduced, indicating development of a CTA. The preference for the flavor paired with GM-CSF injection did not differ from that of vehicle or saline, demonstrating that GM-CSF did not support a CTA. *P < 0.05; n = 7–9; mean ± SEM. (B) Sodium-depleted rats were given an i.p. injection of isotonic saline or LiCl or an i3vt injection of 0.6 μg GM-CSF or vehicle. Cumulative sodium solution (NaCl) intake was measured at 2 hours. In contrast to LiCl-injected rats, cumulative intake of NaCl was not suppressed in rats receiving GM-CSF treatment as compared with control rats receiving saline or vehicle. *P < 0.05; n = 7–9; mean ± SEM.
The sodium appetite test measures avidity to drink a 0.5 M NaCl solution following whole-body sodium depletion. Consumption of NaCl is diminished by either motor impairment or visceral illness (8). Rats were given a solution of 0.5 M NaCl in a water bottle for 7 days. Water was available ad libitum in a second bottle. On day 8, NaCl solution was removed, and chow was replaced with sodium-free rat chow (ICN Biochemicals). The rats were then given 2 s.c. injections of furosemide (2 ml/kg) 2 hours apart (9). Diuresis (and presumed sodium depletion) was confirmed by observing at least 18 g of weight loss in the 3-hour post-injection period. Twenty-four hours after furosemide injection, rats were given either an i.p. injection of isotonic LiCl or saline (in a volume equivalent to 2% of the rat’s body weight) or an i3vt injection of 0.6 μg GM-CSF or vehicle. Fifteen minutes later, 2 bottles were placed on the cage: one containing 0.5 M NaCl and the other containing water. Fluid intakes were measured every 30 minutes for 2 hours. Food intake and body weight were measured at 24 hours. i3vt GM-CSF did not suppress NaCl intake (Figure 3B) despite significantly reducing food intake. Food intake and body weight at 24 hours were again decreased only in response to GM-CSF (Supplemental Figure 2, A and B). These data imply that the effect of GM-CSF to alter behavior is specific to the ingestion of calories and that GM-CSF does not interfere with other ingestive behaviors not directly related to energy homeostasis. This is in contrast to the effects of LiCl, in which multiple classes of behavior are impacted. We therefore conclude that the effects of GM-CSF on food intake and body weight are not secondary to either motor impairments or illness.
To determine whether the CNS is the critical site of action for i3vt GM-CSF, we administered peripherally the same dose that was effective centrally. Parallel groups were injected with i3vt GM-CSF or vehicle. Rats receiving 0.6 μg i.p. GM-CSF did not differ in food intake or body weight from those receiving i.p. or i3vt vehicle at any time point; however, i3vt GM-CSF again suppressed food intake and decreased body weight (data not shown). This outcome supports the conclusion that our i3vt GM-CSF doses acted within the CNS to suppress food intake rather than leaking into the blood and acting at peripheral GM-CSF receptors.
Peripheral GM-CSF expression is not altered by fasting or diet-induced obesity.
Cytokines produced in adipocytes or adipose tissue macrophages are increased in obesity, providing a basis for the concept of obesity as an inflammatory disease (10). An important question, therefore, is whether GM-CSF, like leptin, enters the CNS from the circulation to influence energy homeostasis. GM-CSF expression is highly regulated in myeloid and endothelial cell types via mRNA degradation, which is mediated in turn via an AUUA tandem repeat region in the 3′ untranslated region (11). Increased levels of GM-CSF expression occur as a consequence of message stabilization and upregulation of transcription factors, including NF-κB (12). Steady-state plasma levels are undetectable by ELISA, which has a lower limit of detection of 5 pg/ml. To determine whether GM-CSF expression or level is altered by energy balance, we measured GM-CSF mRNA levels in peripheral tissues by semiquantitative RT-PCR in ad libitum–fed rats and 48-hour food-deprived rats (Supplemental Figure 3A). GM-CSF mRNA was most abundant in lung from either group and was amplified at similarly low levels in liver and adipose from both fasted and fed rats. There was little or no GM-CSF expression in muscle, heart, kidney, and stomach (data not shown). In addition, we used an ELISA to measure GM-CSF in serum collected from fed and fasted lean and obese rats, but all samples were below the limit of detection (<5 pg/ml; data not shown). While such negative data are not definitive, they do not support the possibility that energy balance regulates peripheral GM-CSF levels.
Peripheral injections of GM-CSF did not affect food intake or body weight.
To further determine whether peripherally derived GM-CSF alters food intake, we administered 10-fold higher doses than those that were effective when delivered i3vt. Food intake and body weights of rats receiving 10–12 μg/kg GM-CSF (6 μg per animal) i.p. were no different from those of vehicle-treated rats, in contrast to rats receiving 0.6 μg i3vt GM-CSF (Figure 4, A and B). A dose of 10–12 μg/kg falls within the range in which GM-CSF is used therapeutically to stimulate hematopoiesis following chemotherapy (3).
Figure 4.
Peripheral administration of GM-CSF to rats. Rats received i.p. injection of vehicle or 6 μg GM-CSF or i3vt injection of vehicle or 0.6 μg GM-CSF. (A) Twenty-four-hour food intake did not differ among animals receiving i.p. vehicle, i.p. 6 μg GM-CSF, or i3vt vehicle. Food intake was decreased in rats receiving i3vt 0.6 μg GM-CSF. (B) Similarly, body weight was decreased in rats treated with 0.6 μg i3vt GM-CSF but not those treated with i3vt vehicle or injected i.p. with either GM-CSF or vehicle. (C) Subcutaneous injection of 30 μg/kg GM-CSF resulted in increased serum GM-CSF levels at 1, 2, and 4 hours after injection. GM-CSF levels were below the limit of detection at time point 0 in GM-CSF–injected rats (squares) and at all time points in vehicle-treated rats (triangles). At 24 hours after s.c. injection, body weight change in rats receiving 30 mg/kg GM-CSF did not differ from that in rats receiving vehicle (C, inset), and food intake did not differ for at least 3 days (D). *P < 0.05; n = 7 to 9; mean ± SEM.
Since GM-CSF is administered s.c. in clinical applications, we next administered 30 μg/kg s.c. (approximately 15 μg per animal) and detected markedly increased serum levels after 1, 2, and 4 hours (Figure 4C). However, food intake was not suppressed at any time point during the first 8 hours following injections (data not shown), and there were no differences in body weight change (Figure 4C, inset) or food intake (Figure 4D) for at least 3 days following the injections. Thus, despite substantially increasing circulating GM-CSF and demonstrating that the GM-CSF is biologically active in parallel i3vt-injected rats, peripheral administration of GM-CSF did not influence energy balance.
GM-CSF receptors and GM-CSF are expressed in CNS cells.
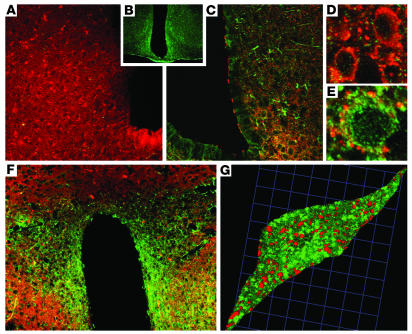
To localize the receptors upon which i3vt GM-CSF acts, we used immunofluorescence labeling to identify GM-CSF receptors in adult mouse brains. Receptors have been reported in fetal brains and isolated neurons, and from in vitro studies of isolated oligodendrocytes and astrocytes (13–16). Functional GM-CSF receptors are heterodimers of single α and β subunits (17). The β subunit (βc) is shared by IL-3 and IL-5 receptor heterodimers, with the α subunit conferring binding specificity. Therefore, we used antibodies against the mouse GM-CSF receptor α subunit (GMRα) specific for GM-CSF binding (Figure 5). Control sections treated with anti-sera preincubated with the immunizing peptide had no GMRα immunoreactivity (Figure 5A). GMRα immunofluorescence was detected most prominently in the arcuate nuclei (ARC) (Figure 5, B and C) and paraventricular nuclei (PVN) (Figure 5F) of the hypothalamus, which both have prominent roles in the control of energy balance. Lesser levels of staining were also observed in cortex and hippocampus (data not shown). To determine what CNS cell types express GM-CSF receptors, we dual-labeled GMRα immunoreactivity with the neuron-specific protein synaptophysin (18). Using confocal microscopy, synaptophysin immunoreactivity was observed ubiquitously in neurons throughout the CNS. GMRα immunofluorescence was heavily colocalized with synaptophysin immunoreactivity in the ARC and PVN (Figure 5, C, F, and G). Cell bodies with GMRα immunofluorescence (Figure 5D) and without (Figure 5E) were surrounded by multiple synaptophysin contacts. GMRα immunoreactivity in cells of the PVN is distinct from that of LepR, which is expressed in ARC but not PVN.
Figure 5.
GM-CSF receptor immunohistochemistry. Synaptophysin (red) and GMRα immunofluorescence (green) were localized on neurons throughout mouse brain, including ARC and PVN. (A) Only synaptophysin immunofluorescence was observed in sections when antibody serum was preincubated with the immunizing peptide to block GMRα antibody binding. (B) A section stained with GMRα immunofluorescence alone. (C) GMRα immunofluorescence was colocalized with synaptophysin immunofluorescence in the ARC (low-magnification view). (D) High-magnification view of several synaptophysin-immunoreactive neurons that did not contain GMRα. (E) High-magnification view of GMRα-positive cells surrounded by synaptophysin immunofluorescence contacts in the ARC. (F) GMRα immunofluorescence was colocalized with synaptophysin immunofluorescence in the PVN (low-magnification view). (G) High-magnification 3-dimensional reconstruction of confocal images of a single neuron from the PVN, showing colocalization of GMRα and synaptophysin immunofluorescence. Sections are representative of 5 animals in which staining was examined.
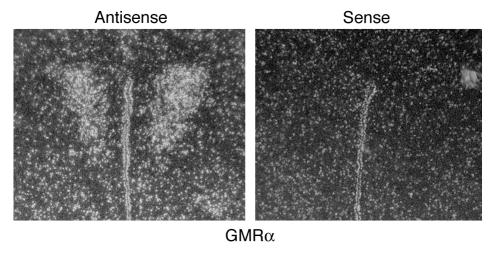
We also performed in situ hybridization to localize GMRα mRNA expression in coronal sections of mouse brain that included hypothalamic regions. Strong signal was detected with a GMRα antisense probe in the region of the PVN well above that observed in the sense controls (Figure 6). The antisense probe signal was also higher in the ARC compared with sense (data not shown) but was more diffuse than the hybridization to the PVN. No brain regions showed increased hybridization of the sense control above background.
Figure 6.
GM-CSF receptor in situ hybridization. Antisense probe for GMRα mRNA was hybridized to mouse brain sections. Signal was observed in the region of the PVN in sections. Signal from hybridization with control sense probes was not above background levels. Sections are representative of 4 animals in which hybridization was examined.
Taken together, the lack of response to peripheral administration of GM-CSF and the presence of GM-CSF receptors in the hypothalamus suggested that the relevant endogenous source of GM-CSF could be in the hypothalamus. GM-CSF expression in neural tissues has been well documented in several studies of fetal neurons, neuronal cell lines, and isolated microglial cells and astrocytes (13–16), and we have detected GM-CSF mRNA in whole hypothalamus, forebrain, hindbrain, and cerebellum of wild-type mice (data not shown). To determine whether fasting or feeding influenced hypothalamic expression, we isolated total RNA from whole hypothalamus from fed or 48-hour-fasted rats and measured GM-CSF expression (Supplemental Figure 3B). We included LPS-treated rats (0.5 μg/g body weight, i.p.) as a positive control, since LPS has been shown to increase GM-CSF in lung, muscle, thymus, heart, bone shaft, and other tissues (19). We found no significant differences in GM-CSF expression between fed and fasted rats, while it was elevated in LPS-treated rats. Plasma GM-CSF was not detected by ELISA at 2, 4, or 24 hours after LPS injection (data not shown), but levels of TNF-α were increased.
GM-CSF–deficient mice have increased fat mass.
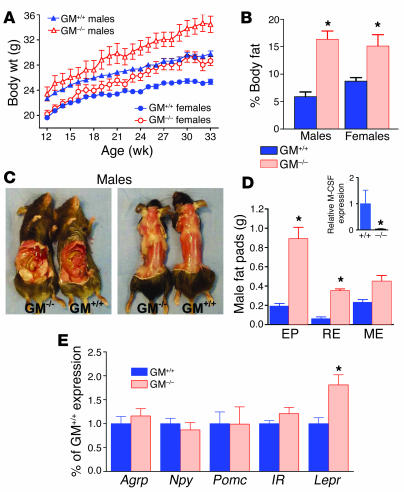
Since i3vt administration of GM-CSF caused weight loss in rats, we predicted that disruption of GM-CSF signaling would lead to weight gain. To determine whether endogenous GM-CSF contributes to long-term energy regulation, we compared mice with targeted disruption of the GM-CSF gene (GM–/–) with GM+/+ mice. GM-CSF was originally isolated and named on the basis of its ability to stimulate differentiation and activation of myeloid cells, including granulocytes and macrophages; however, these functions were found to be redundant in 2 distinct lines of GM-CSF–null mutant mice (20, 21). Male and female GM–/– mice gained significantly more weight than sex- and age-matched GM+/+ control mice (Figure 7A) yet had similar body length (Supplemental Figure 4, A and B). Total body fat in male and female GM–/– mice was 278% and 174%, respectively, of that measured in sex-matched GM+/+ mice (Figure 7B), while lean mass did not differ (Supplemental Figure 4C). The higher fat content of male and female GM–/– mice accounted for 78% and 63%, respectively, of the increased total body weight over that measured in sex-matched control mice. Gross observation revealed that both visceral and s.c. fat were increased in GM–/– males (Figure 7C) and females (Supplemental Figure 4D). Individual fat pads were dissected from age- and sex-matched GM–/– and GM+/+ mice and weighed to determine whether fat distribution was also altered. Perigonadal (epididymal in males or parametrial in females) and retroperitoneal fat pads were significantly heavier in GM–/– males (Figure 6D) and females (Supplemental Figure 4E). In females, mesenteric pads were also significantly heavier. Despite these marked increases found in GM–/– mice, visceral fat pads accounted for 32% of the total lipids in both GM–/– and GM+/+ mice, suggesting that the overall distribution of adipose tissue did not differ between the 2 genotypes. To further characterize the dysregulation of lipids in the absence of GM-CSF, we measured nonfasting serum lipids in male GM–/– and GM+/+ mice at 10–12 weeks of age. Male GM–/– mice had 88.4 ± 16.7 mg/dl triglycerides and 0.19 ± 0.09 mmol/l free fatty acids, compared with 27.8 ±13.9 mg/dl and 0.08 ± 0.04 mmol/l, respectively, in control mice.
Figure 7.
Body fat is increased in GM–/– mice. GM–/– and control GM+/+ male and female mice were monitored from 12 to 33 weeks of age. GM–/– mice gained significantly more body weight than did age- and sex-matched GM+/+ mice (A), and GM–/– mice had increased body fat as a percentage of total body weight (B). n = 7–11; mean ± SEM. (C) Visceral and s.c. fat were visibly increased in male GM–/– mice, compared with GM+/+ control mice. (D) Weights of epididymal (EP), retroperitoneal (RE), and mesenteric (ME) fat were increased in male GM–/– mice compared with GM+/+ control mice. *P < 0.05; n = 5; mean ± SEM. Inset: M-CSF expression was decreased in GM–/– mice. M-CSF mRNA was measured by Q-PCR in mesenteric fat from GM–/– and GM+/+ male mice. M-CSF expression was reduced in GM–/– mice, compared with GM+/+ mice. (E) NPY, AgRP, POMC, and insulin receptor (IR) mRNA expression were similar in both groups, but LepR expression was increased in GM–/– hypothalamus. n = 10–11; mean ± SEM. *P < 0.05.
Consistent with increased body fat, plasma leptin was higher in GM–/– mice (9.6 ± 1.1 and 7.1 ± 1.6 ng/ml in males and females, respectively, compared with 2.5 ± 0.2 and 3.2 ± 0.5 in GM+/+ males and females, respectively). Plasma insulin levels were similar in all mice (Supplemental Figure 5).
M-CSF expression is not increased in adipose tissue of GM–/– mice.
One possible mechanism for the increase in adipose mass is a compensatory upregulation in M-CSF expression. Upregulation of human M-CSF was found in rapidly growing adipose tissue surrounding inflamed bowel and in association with weight gain from overfeeding (22). In the same study, adenovirus-mediated M-CSF expression stimulated adipocyte proliferation in rabbits. While M-CSF–deficient (op/op) mice have increased levels of GM-CSF and IL-3 (23), M-CSF expression levels have not been reported for GM–/–mice. We measured M-CSF expression by quantitative real-time PCR (Q-PCR) in mesenteric fat pads from GM–/– and GM+/+ males to determine whether a compensatory upregulation of this cytokine might be stimulating increased adipose mass. However, amplification of M-CSF was significantly lower in GM–/– than in GM+/+ mice (Figure 7D, inset). M-CSF was not detected in s.c. fat from GM–/– or GM+/+ mice (data not shown).
Hypothalamic gene expression in GM –/– and GM+/+ mice.
Total RNA was isolated from whole hypothalamus of fasting GM–/– and GM+/+ mice. Gene expression was characterized using Q-PCR measurement of Agrp, Npy, Pomc, Insr, and Lepr mRNA. Of these genes, only Lepr expression differed between male (Figure 7E) or female (Supplemental Figure 4F) sex-matched groups. Lepr mRNA accumulation in hypothalamus increased in male and female GM–/– mice, compared with sex-matched controls.
Energy intake in GM–/– and GM+/+ mice.
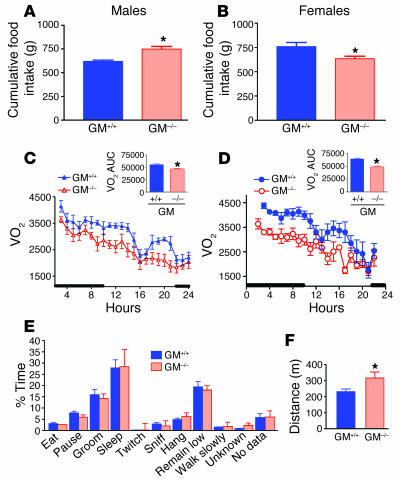
The increased body fat was associated with increased food intake in male but not female GM–/– mice (Figure 8A), compared with GM+/+ controls (Figure 8B) when fed a standard chow diet. In addition, refeeding following a 24-hour fast did not differ between chow-fed GM–/– and GM+/+ males or females (Supplemental Figure 6, A and B). To determine whether GM-CSF has a role in diet-induced obesity, we placed cohorts of 32-week-old mice on matched high-fat or low-fat diets for 5 weeks (24). Male GM+/+ mice gained more weight and had more body fat (Supplemental Figure 7, A and B) on the high-fat diet than on the low-fat diet, while diet made no significant difference in the tendency of female mice toward increased body weight or body fat (Supplemental Figure 7, C and D). Importantly, both male and female GM–/– mice weighed more and had more body fat than their wild-type counterparts. However, the absolute size of this effect was the same whether mice were maintained on the low- or high-fat diet (Supplemental Figure 7, E and F) indicating that there was little or no interaction between diet and genotype. Thus, these data support our observation that while GM-CSF deficiency leads to increased body adiposity, it does not result in increased sensitivity to the effects of a high-fat diet.
Figure 8.
Food intake, energy expenditure, and activity. Average daily food intake was slightly increased in GM–/– male mice (A) but was slightly lower in female GM–/– mice (B), compared with GM+/+ mice. VO2, measured by indirect calorimetry, was decreased in male (C) and female (D) GM–/– mice compared with GM+/+ mice. Area under the curve (AUC) was significantly decreased for both male (C, inset) and female (D, inset) GM–/– mice. Activity of male GM–/– and GM+/+ mice was monitored for a 24-hour period using video equipment. (F) Time spent performing various activities did not differ between male GM–/– and GM+/+ mice; however, the total distance traveled over the 24-hour period was greater for GM–/– mice than for GM+/+ controls. *P < 0.05; n = 7–11; mean ± SEM.
Energy expenditure was decreased in GM–/– mice.
Finally, to assess whether rates of energy expenditure were altered by GM-CSF deficiency, we measured oxygen consumption in fasting mice 28 weeks of age by indirect calorimetry over a 24-hour period. Volume of oxygen consumed (VO2) was decreased in male GM–/– mice (Figure 8C) and to an even greater extent in female GM–/– mice (Figure 8D), compared with that of age and sex-matched control mice. The area under the curve for VO2 measurement was significantly lower for both male and female GM–/– mice, compared with GM+/+ controls (Figure 8, C and D, insets). Respiratory quotient (RQ) did not differ between genotypes (data not shown). Despite the reduction in energy expenditure, GM–/– males were at least as active as their age- and sex-matched GM+/+ controls. The activity pattern over a 24-hour period did not differ between GM–/– and GM+/+ mice (Figure 8E), but distance traveled during that time period was greater for GM–/– mice than for GM+/+ controls (Figure 8F).
Discussion
We have shown that central administration of GM-CSF reduced food intake and decreased body weight in rats. Body weight loss was greater in GM-CSF–treated than vehicle-treated animals, even when food was withheld for 24 hours following treatment, suggesting that energy expenditure increased as a result of central GM-CSF signaling. Correspondingly, loss of GM-CSF expression caused late-onset obesity in mice, with a nearly 3-fold increase in body fat and decreased energy expenditure. Taken together, these studies indicate that GM-CSF can influence energy balance. Central administration of GM-CSF decreased energy intake and increased energy expenditure, while loss of GM-CSF signaling increased energy intake and decreased energy expenditure.
Like leptin, central administration of GM-CSF produces weight loss via potent effects on food intake that are not secondary to motor impairment or illness (25). In fact, GM-CSF is considerably more potent than leptin on a molar basis in this regard, with a threshold dose approximately 8-fold lower than that of leptin administered in a similar paradigm (26). As is the case with leptin, GM-CSF receptors are found in the CNS in neurons in the ARC of the hypothalamus (27). However, unlike the LepR, significant GM-CSF receptor immunoreactivity is also found in the PVN. Although milder than those occurring with leptin deficiency, GM–/– mice have pronounced increases in adiposity, resulting from increased food intake and decreased energy expenditure.
Central administration of GM-CSF significantly reduced NPY and AgRP expression in rats. Plasma leptin levels were decreased 24 hours after receiving central GM-CSF administration, even in ad libitum–fed animals. This time point coincides with maximal weight loss after injection and is consistent with the hypothesis that a significant part of the weight loss is adipose.
Several lines of evidence indicate that while GM-CSF does circulate, many of its functions are the result of paracrine actions. For example, GM-CSF promotes maturation of myeloid cells within the bone marrow, stimulates macrophage chemotaxis and phagocytosis of bacteria at the site of infection, and regulates pulmonary surfactant catabolism within cells of the alveolar lumen (4, 28–32). Expression in endothelial cells is upregulated in response to local signals and attracts leukocytes to migrate through vessel walls and infiltrate damaged or inflamed tissues (33). In the present studies, we found that even very high doses of GM-CSF delivered peripherally did not produce any reductions in food intake. This is consistent with the hypothesis that, like GM-CSF’s other functions, its role in energy balance may also be paracrine. One possibility is that GM-CSF may be made in the CNS by neurons or other CNS cell types to act upon hypothalamic GM-CSF receptors.
Leptin enters the CNS via an active receptor-mediated uptake system (34), and while some evidence indicates that peripherally derived GM-CSF enters the CNS (35), our data do not support a role for peripherally derived GM-CSF in energy balance. In both fed and fasted conditions, circulating GM-CSF did not reach detectable levels, and peripheral administration that resulted in plasma levels greater than those associated with inflammation did not influence food intake or body weight (36, 37). Rather, our findings suggest that cells of the CNS are more likely the critical source of the GM-CSF that interacts with the CNS receptors we have identified.
Our immunohistochemistry and in situ findings identified neuronal expression of GM-CSF receptors in the PVN and ARC. These findings are consistent with those demonstrating immunofluorescence in neurons of the PVN and suggest that GM-CSF can act directly on neurons. GM-CSF receptor expression in neural tissues has been well documented in several studies of fetal neurons, neuronal cell lines, and isolated microglial cells and astrocytes (13–16). Since GM–/– mice are completely lacking in GM-CSF expression during development, as well as adulthood, it is possible that a subset of GM-CSF–expressing CNS cell type is absent in these mice. An important goal will be to completely map expression of GM-CSF receptors in the CNS, including identifying the critical cell types that produce the receptors in hypothalamus.Future studies will include in situ hybridization and immunohistochemical staining of other regions known to project to the hypothalamus, including nucleus accumbens and regions of the brain stem.
One of the key questions raised by our studies is the source of CNS GM-CSF expression. The present study included amplification of GM-CSF mRNA in brain tissues and indicates that GM-CSF expression is widespread throughout the CNS. However, the precise source of endogenous GM-CSF that would influence energy balance remains unknown. GM-CSF expression has been reported in oligodendrocytes, microglial cells, and macrophages in the brain, as well as endothelial cells of the vessels in neural tissues. There is also evidence that GM-CSF levels in spinal fluid change in Alzheimer disease, chronic fatigue syndrome, and spinal cord injury (38, 39). Induction of GM-CSF expression is thought to be vital to initiation of the proinflammatory cytokine cascade that follows spinal cord injury (40). Our original hypothesis was that GM-CSF is produced as part of the inflammatory state associated with adipose tissues in obese individuals, and we predicted that GM-CSF would be another cytokine link between peripheral inflammation and central energy regulation. While large doses of peripheral GM-CSF had no effect on food intake or body weight in these studies, this does not rule out a peripheral mechanism for GM-CSF in regulating adipose mass.
In this study, we found that GM–/– mice show a pronounced body fat phenotype. The visceral fat pads were grossly larger and heavier than those from wild-type mice. In addition, the s.c. fat depot was visibly enlarged in the GM–/– mice. This suggests that while lipid storage in the GM–/– mice was increased, the fat distribution pattern remained unchanged. We measured M-CSF expression in mesenteric fat, since it is known to stimulate adipogenesis. However, M-CSF was expressed at a lower level in GM–/– mice than it was in GM+/+ mice. Thus, while M-CSF may contribute to adipogenesis in wild-type animals, it is unlikely to be involved in the mechanism that increases fat expansion in the absence of GM-CSF signaling. The current data, however, cannot rule out the possibility that some other intermediary molecule compensates for GM-CSF signaling and stimulates adipogenesis.
Gene targeting has produced 2 distinct strains of GM-CSF–null mice and 2 of GM-CSF βc receptor–deficient mice, yet this is the first study we know of describing alterations in energy homeostasis in association with disrupted GM-CSF signaling. Cellular substrates of GM-CSF–activated kinase activity are components of 3 distinct signaling pathways, including the JAK/STAT, PI3K/AKT, and Ras/MAPK cascades (41). In the JAK/STAT pathway, ligand binding induces phosphorylation of JAK2, which in turn induces phosphorylation of the βc subunit. STAT5A and STAT5B Src homology 2 domains bind to the phosphorylated sites on the βc cytoplasmic tail. The STAT proteins then are phosphorylated by JAK2 and dimerize. Studies by Rosen et al. demonstrated that STAT5A homodimers and STAT5A–5B heterodimers form in monocytes in response to GM-CSF (42). In addition, STAT3 is activated by GM-CSF in hepatocytes and polymorphonuclear leukocytes (43, 44). Since the STAT family has also been linked to the effects of leptin and insulin in regulating energy balance (45), one possibility is that GM-CSF influences food intake and energy expenditure via similar intracellular pathways.
Obesity remains among the most daunting public health problems facing the developed and developing worlds. Increased obesity will inevitably result in increased rates of type 2 diabetes, heart disease, and some cancers. The current rise in obesity rates is particularly troubling since existing therapies are at best moderately successful. Thus, there is pressing need for more understanding of how energy balance is regulated and how it might be dysregulated to produce obesity. The current work points to a possible role for GM-CSF acting in the CNS to regulate energy balance. This opens up possibilities for new insights about how body adipose stores are regulated by proinflammatory cytokines and how we might produce biologically meaningful treatments that result in significant and sustained weight loss.
Methods
Rats.
All animal protocols were approved by the University of Cincinnati Institutional Animal Care and Use Committee. Male Long-Evans rats (250–300 g at the time of surgery) were housed individually with a 12-hour light/12-hour dark cycle and implanted with a cannula aimed at the i3vt, as described previously (7).
GM-CSF.
Stock solutions of 0.6 μg /μl recombinant rat GM-CSF (R&D Systems) were made in 0.1% BSA/0.85% saline on the day of use. For central administration, the stock solution was diluted 50:50 with 0.85% saline such that the final concentration of vehicle was 0.05% BSA/0.85% saline. All central doses in rats were delivered in a total volume of 2 μl per dose, except doses of 6 μg, which were delivered in a total volume of 3 μl per dose. Recombinant human GM-CSF (R&D Systems) was prepared and delivered centrally in the same manner as rat GM-CSF. For peripheral injection, 0.6 or 6 μg rat GM-CSF was diluted in 0.5 cc vehicle. The peripheral 6-μg dose is equivalent to 10–12 μg/kg of body weight. For a 30 μg/kg peripheral dose, rat GM-CSF was diluted at a concentration of 30 μg/ml 0.85% saline, and 1 cc/kg body weight was injected s.c. Recombinant mouse GM-CSF (R&D Systems) was prepared immediately before use as a working solution of 1 μg/μl in 0.05% BSA/0.85% saline, and doses of 1 μl per mouse were injected centrally via an indwelling i3vt cannula.
Food intake studies in rats.
Rats were maintained on a 12-hour light/12-hour dark light cycle. Hoppers of food were removed from cages 4 hours prior to onset of dark. For central injections, rats received 2-μl i3vt injections manually infused with a Hamilton syringe over 30 seconds. Food hoppers were weighed and returned to the cages at the onset of dark and weighed at 2, 4, and 24 hours or longer after infusion, as indicated. Body weights were taken at 0 and 24 hours or daily as indicated. The same paradigm was used for peripheral doses. Food intake for a pair-fed group was restricted to the amount of food consumed by the fed GM-CSF–treated group.
RT-PCR.
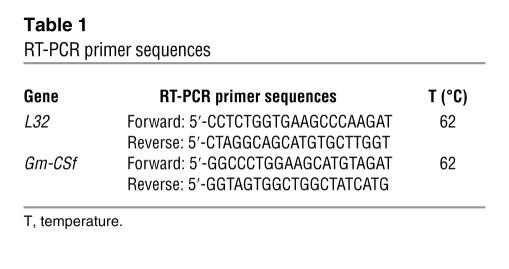
Ad libitum–fed or 48-hour fasted rats were killed at 3 hours after dark. Tissues were homogenized, and total RNA was isolated. cDNA was synthesized using SuperScript III kits (Invitrogen Corp.). PCR was performed with the sequences shown in Table 1, using Failsafe PCR kits (EPICENTRE Biotechnologies). For amplification of GM-CSF, reaction mixture included Buffer G, and thermocycler conditions were: 3 minutes at 95°C; [30 seconds at 95°C, 30 seconds at 62°C, and 45 seconds at 72°C] for 30 cycles; and 5 minutes at 72°C. For amplification of the reference gene L32, reaction mixture included Buffer I, and thermocycler conditions were: 3 minutes at 95°C; [30 seconds at 95°C, 30 seconds at 55°C, and 45 seconds at 72°C] for 25 cycles; and 5 minutes at 72°C. Products in agarose gels were quantified using Optiquant software (Quantity One, version 4.2; Bio-Rad Laboratories).
Table 1.
RT-PCR primer sequences
Q-PCR.
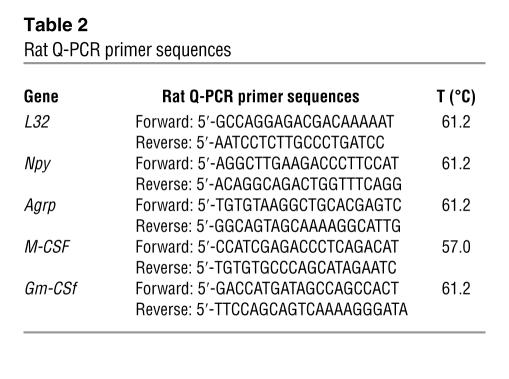
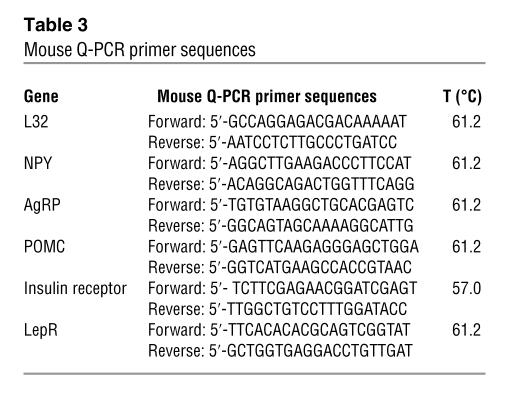
Total RNA was isolated, and cDNA was synthesized and verified by L32 amplification products in agarose gel, as described for RT-PCR, before any Q-PCR assays were performed. Q-PCR primer sequences for rat are shown in Table 2 and for mouse in Table 3. Each primer set was optimized such that the correlation coefficient was 0.99–1.0 and the PCR efficiency was 90–100%. Q-PCR was performed in triplicate using an iCycler and the iQ SYBR Green Supermix (Bio-Rad Laboratories) with 2-step amplification (95°C for 10 seconds, annealing temperature for 30 seconds) for 40 cycles. L32 was amplified from every sample for use as an endogenous control. For the data analysis, the average threshold cycle (CT) of each set of triplicates was calculated. To normalize the data, the ΔCT was calculated for each sample by subtracting the average CT of L32 from the average CT of the gene of interest. For relative quantitation, the ΔCT was averaged for the defined control group and was then subtracted from the ΔCT of each experimental sample to generate the ΔΔCT. The ΔΔCT was then used to calculate the approximate fold difference, 2ΔΔCT.
Table 2.
Rat Q-PCR primer sequences
Table 3.
Mouse Q-PCR primer sequences
GM-CSF and TNF- α ELISAs.
Serum GM-CSF and TNF-α were measured using ELISA DuoSet Kits (R&D Systems), according to the package insert protocols. Standards and spiked serum or plasma samples containing recombinant GM-CSF were used to assure that kits were able to detect GM-CSF.
Immunofluorescent localization of GMR
α. Male GM+/+ mice 16–18 weeks of age were perfused with 4% paraformaldehyde, and brains were post-fixed overnight and transferred to 30% sucrose PBS. Forebrains were frozen and coronally sectioned at 20-μm thickness. Nonspecific binding was blocked with 0.1% normal goat serum (NGS) in phosphate-buffered saline pH 7.4 with 1% Triton X-100 (PBS-T) for 1 hour and incubated overnight at 4°C in anti-GMRα (Santa Cruz Biotechnology Inc.) diluted 1:1,000 in 0.1% NGS in PBS-T. On day 2, sections were rinsed and incubated in Alexa Fluor 488 (Molecular Probes; Invitrogen Corp.) diluted 1:200 in 0.1% NGS for 1 hour, rerinsed, and incubated overnight at 4°C in anti-synaptophysin (Sigma-Aldrich) diluted 1:5,000 in 0.1% NGS. On day 3, sections were rinsed and incubated in anti-mouse Cy3 (Jackson ImmunoResearch Laboratories Inc.) diluted 1:200 in 0.1% NGS for 30 minutes. Sections were coverslipped with VECTASHIELD (Vector Laboratories) fluorescence mounting media with DAPI. Immunofluorescence reactivity or DAPI was detected by confocal microscopy.
In situ hybridization.
Antisense and sense probe templates were prepared from linearized plasmid containing a 689-bp fragment from the 5′ end of the coding sequence for GMRα, cut with either EcoR1 or Xho1, gel purified, and recovered with a Zymoclean Gel DNA Recovery Kit (Zymo Research Corp.). Frozen sections of 50 μm were fixed to slides, pretreated with proteinase K, and rinsed. Probes were double labeled with [35S]CTP and [35S]GTP (Amersham Biosciences) with T7 or T6 reverse transcriptase using a MAXIscript Kit (Ambion Inc.). Slides were hybridized at 70°C overnight. Slides were washed with 0.2× SSC and 0.1% SDS at 65°C and treated with RNAse, washed, and emulsion dipped. Slides underwent autoradiography for 2 weeks and were developed, counterstained with cresyl violet, and coverslipped for microscopic analysis and imaging.
GM–/– mice.
GM-CSF–null mutant (GM–/–) mice (described in ref. 20) were provided by Jeffrey A. Whitsett (Cincinnati Children’s Hospital Research Foundation, Cincinnati, Ohio, USA). The GM-CSF–null locus was bred onto the C57BL/6 strain for more than 10 generations. Age- and sex-matched GM+/+ wild-type C57BL/6 mice were used as control animals. All mice were bred at the University of Cincinnati and housed individually in micro-isolator cages, except those used for central injections. Mice used for central injection of vehicle or GM-CSF were C57BL/6 males purchased from Jackson Laboratory.
Mouse food intake/body weight study.
Food intake and body weight studies of mice began at 10–12 weeks of age and continued for up to 5 months. Mouse chow was placed in a food hopper that was weighed weekly. Intake was expressed as a daily average for each week.
Body fat content.
Mice 32 weeks of age were fasted for 24 hours and killed. Serum was collected for leptin and insulin measurements. Carcasses were lyophilized to remove water and weighed before and after fat extraction in boiling petroleum ether to determine total lipid weight as a percentage of body weight (24).
Indirect calorimetry.
Energy expenditure was measured by indirect calorimetry, as described previously (7). The light cycle in the calorimetry room was the same as in the home-cage room, with lights off at 1:00 pm and back on at 1:00 am. Mice were fed ad libitum in home cages between 1:00 and 3:00 pm and then immediately placed in individual calorimetry chambers without food. Mice were monitored with an Oxymax system (Columbus Instruments) to measure oxygen consumption (O2 content of input air flow minus that of output airflow) and carbon dioxide production (CO2 content of output airflow minus that of input airflow). Both VO2 and VCO2 were expressed in units of ml/kg body wt/h (ml/kg/h), and the RQ was calculated as a ratio between VCO2 production and VO2 consumption.
Activity tests.
Overall activity levels were assessed by digital video–based software analyses. Briefly, mice were placed in a standard open field chamber for 30 minutes. Overall activity, distance, location, and speed were measured using TopScan suite (Clever Sys Inc.). Mice were then returned to home cages and recorded for 48 hours (in normal light/dark cycle) for subsequent PhenoScan (Clever Sys Inc.) analysis. Each incident of a specific behavior, including walking, rearing, grooming, eating, drinking, and sleeping, was automatically detected and recorded for each subject.
Statistics. Data was analyzed by 2-, 3-, or 4-way mixed model ANOVA, followed by 2-tailed Student’s t test or Tukey’s t test, as appropriate. Statistical significance was set at P < 0.05.
Supplementary Material
Acknowledgments
We thank Kay Ellis and David D’Alessio for performing leptin and insulin measurements, Nancy Mueller and James Herman for assistance with the neuroanatomical analyses, Stephen Benoit of the University of Cincinnati Behavioral Assay Core for analysis of motor behavior, Patrick Tso for measurement of serum lipids, Deanna Russell and Lynda Brown for technical assistance, and Stephen Woods and Matthias Tschöp for critical readings of this manuscript. This work was funded by NIDDK grants DK54080, DK56863, and DK59630 and funds from the Procter & Gamble Company.
Footnotes
Nonstandard abbreviations used: AgRP, agouti-related peptide; ARC, arcuate nucleus; CTA, conditioned taste aversion; GM–/–, GM-CSF–deficient; GMRα, GM-CSF receptor α subunit; i3vt, intracerebral third ventricle/ventricular; LepR, leptin receptor; NPY, neuropeptide Y; POMC, proopiomelanocortin; PVN, paraventricular nucleus; Q-PCR, quantitative real-time PCR; VO2, volume of oxygen consumed.
Conflict of interest: The authors have declared that no conflict of interest exists.
References
- 1.Friedman JM. The function of leptin in nutrition, weight, and physiology. Nutr. Rev. 2002;60:S1–S14; discussion S68–S84, 85–17. doi: 10.1301/002966402320634878. [DOI] [PubMed] [Google Scholar]
- 2.Gainsford T, et al. Leptin can induce proliferation, differentiation, and functional activation of hemopoietic cells. Proc. Natl. Acad. Sci. U. S. A. 1996;93:14564–14568. doi: 10.1073/pnas.93.25.14564. [DOI] [PMC free article] [PubMed] [Google Scholar]
- 3.Glaspy JA. Hematopoietic management in oncology practice. Part 1. Myeloid growth factors. Oncology (Williston Park). 2003;17:1593–1603. [PubMed] [Google Scholar]
- 4.Hamilton JA. GM-CSF in inflammation and autoimmunity. Trends Immunol. 2002;23:403–408. doi: 10.1016/s1471-4906(02)02260-3. [DOI] [PubMed] [Google Scholar]
- 5.La Cava A, Alviggi C, Matarese G. Unraveling the multiple roles of leptin in inflammation and autoimmunity. J. Mol. Med. 2004;82:4–11. doi: 10.1007/s00109-003-0492-1. [DOI] [PubMed] [Google Scholar]
- 6.Walker F, Burgess AW. Specific binding of radioiodinated granulocyte-macrophage colony-stimulating factor to hemopoietic cells. EMBO J. 1985;4:933–939. doi: 10.1002/j.1460-2075.1985.tb03721.x. [DOI] [PMC free article] [PubMed] [Google Scholar]
- 7.Clegg DJ, Wortman MD, Benoit SC, McOsker CC, Seeley RJ. Comparison of central and peripheral administration of C75 on food intake, body weight, and conditioned taste aversion. Diabetes. 2002;51:3196–3201. doi: 10.2337/diabetes.51.11.3196. [DOI] [PubMed] [Google Scholar]
- 8.Stricker EM, Verbalis JG. Control of appetite and satiety: insights from biologic and behavioral studies. Nutr. Rev. 1990;48:49–56. doi: 10.1111/j.1753-4887.1990.tb02905.x. [DOI] [PubMed] [Google Scholar]
- 9.Breslin PA, Kaplan JM, Spector AC, Zambito CM, Grill HJ. Lick rate analysis of sodium taste-state combinations. Am. J. Physiol. 1993;264:R312–R318. doi: 10.1152/ajpregu.1993.264.2.R312. [DOI] [PubMed] [Google Scholar]
- 10.Coppack SW. Pro-inflammatory cytokines and adipose tissue. Proc. Nutr. Soc. 2001;60:349–356. doi: 10.1079/pns2001110. [DOI] [PubMed] [Google Scholar]
- 11.Savant-Bhonsale S, Cleveland DW. Evidence for instability of mRNAs containing AUUUA motifs mediated through translation-dependent assembly of a > 20S degradation complex. Genes Dev. 1992;6:1927–1939. doi: 10.1101/gad.6.10.1927. [DOI] [PubMed] [Google Scholar]
- 12.Smith EM, Dalmeida W, Hughes TK. Signaling pathway-related gene expression in neuroimmunoregulation. J. Neuroimmunol. 2004;147:138–140. doi: 10.1016/j.jneuroim.2003.10.030. [DOI] [PubMed] [Google Scholar]
- 13.Sawada M, Itoh Y, Suzumura A, Marunouchi T. Expression of cytokine receptors in cultured neuronal and glial cells. Neurosci. Lett. 1993;160:131–134. doi: 10.1016/0304-3940(93)90396-3. [DOI] [PubMed] [Google Scholar]
- 14.Baldwin GC, Benveniste EN, Chung GY, Gasson JC, Golde DW. Identification and characterization of a high-affinity granulocyte-macrophage colony-stimulating factor receptor on primary rat oligodendrocytes. Blood. 1993;82:3279–3282. [PubMed] [Google Scholar]
- 15.Brosnan CF, Shafit-Zagardo B, Aquino DA, Berman JW. Expression of monocyte/macrophage growth factors and receptors in the central nervous system. Adv. Neurol. 1993;59:349–361. [PubMed] [Google Scholar]
- 16.Dame JB, Christensen RD, Juul SE. The distribution of granulocyte-macrophage colony-stimulating factor and its receptor in the developing human fetus. Pediatr. Res. 1999;46:358–366. doi: 10.1203/00006450-199910000-00002. [DOI] [PubMed] [Google Scholar]
- 17.Nicola NA, Smith A, Robb L, Metcalf D, Begley CG. The structural basis of the biological actions of the GM-CSF receptor. Ciba Found. Symp. 1997;204:19–27; discussion 27–32. doi: 10.1002/9780470515280.ch3. [DOI] [PubMed] [Google Scholar]
- 18.Leclerc N, et al. Synaptophysin expression during synaptogenesis in the rat cerebellar cortex. J. Comp. Neurol. 1989;280:197–212. doi: 10.1002/cne.902800204. [DOI] [PubMed] [Google Scholar]
- 19.Metcalf D, Willson TA, Hilton DJ, Di Rago L, Mifsud S. Production of hematopoietic regulatory factors in cultures of adult and fetal mouse organs: measurement by specific bioassays. Leukemia. 1995;9:1556–1564. [PubMed] [Google Scholar]
- 20.Dranoff G, et al. Involvement of granulocyte-macrophage colony-stimulating factor in pulmonary homeostasis. Science. 1994;264:713–716. doi: 10.1126/science.8171324. [DOI] [PubMed] [Google Scholar]
- 21.Stanley E, et al. Granulocyte/macrophage colony-stimulating factor-deficient mice show no major perturbation of hematopoiesis but develop a characteristic pulmonary pathology. Proc. Natl. Acad. Sci. U. S. A. 1994;91:5592–5596. doi: 10.1073/pnas.91.12.5592. [DOI] [PMC free article] [PubMed] [Google Scholar]
- 22.Levine JA, Jensen MD, Eberhardt NL, O’Brien T. Adipocyte macrophage colony-stimulating factor is a mediator of adipose tissue growth. J. Clin. Invest. 1998;101:1557–1564. doi: 10.1172/JCI2293. [DOI] [PMC free article] [PubMed] [Google Scholar]
- 23.Wegiel J, et al. Reduced number and altered morphology of microglial cells in colony stimulating factor-1-deficient osteopetrotic op/op mice. Brain Res. 1998;804:135–139. doi: 10.1016/s0006-8993(98)00618-0. [DOI] [PubMed] [Google Scholar]
- 24.Woods SC, Seeley RJ, Rushing PA, D’Alessio DA, Tso P. A controlled high-fat diet induces an obese syndrome in rats. J. Nutr. 2003;133:1081–1087. doi: 10.1093/jn/133.4.1081. [DOI] [PubMed] [Google Scholar]
- 25.Thiele TE, et al. Central infusion of GLP-1, but not leptin, produces conditioned taste aversions in rats. Am. J. Physiol. 1997;272:R726–R730. doi: 10.1152/ajpregu.1997.272.2.R726. [DOI] [PubMed] [Google Scholar]
- 26.Seeley RJ, et al. The effect of intraventricular administration of leptin on food intake and body weight in the rat. Horm. Metab. Res. 1996;28:664–668. doi: 10.1055/s-2007-979874. [DOI] [PubMed] [Google Scholar]
- 27.Schwartz MW, Seeley RJ, Campfield LA, Burn P, Baskin DG. Identification of hypothalmic targets of leptin action. J. Clin. Invest. 1996;98:1101–1106. doi: 10.1172/JCI118891. [DOI] [PMC free article] [PubMed] [Google Scholar]
- 28.Barreda DR, Hanington PC, Belosevic M. Regulation of myeloid development and function by colony stimulating factors. Dev. Comp. Immunol. 2004;28:509–554. doi: 10.1016/j.dci.2003.09.010. [DOI] [PubMed] [Google Scholar]
- 29.Huffman JA, Hull WM, Dranoff G, Mulligan RC, Whitsett JA. Pulmonary epithelial cell expression of GM-CSF corrects the alveolar proteinosis in GM-CSF-deficient mice. J. Clin. Invest. 1996;97:649–655. doi: 10.1172/JCI118461. [DOI] [PMC free article] [PubMed] [Google Scholar]
- 30.Paine R, 3rd, et al. Granulocyte-macrophage colony-stimulating factor in the innate immune response to Pneumocystis carinii pneumonia in mice. J. Immunol. 2000;164:2602–2609. doi: 10.4049/jimmunol.164.5.2602. [DOI] [PubMed] [Google Scholar]
- 31.LeVine AM, Reed JA, Kurak KE, Cianciolo E, Whitsett JA. GM-CSF-deficient mice are susceptible to pulmonary group B streptococcal infection. J. Clin. Invest. 1999;103:563–569. doi: 10.1172/JCI5212. [DOI] [PMC free article] [PubMed] [Google Scholar]
- 32.Yoshida M, Ikegami M, Reed JA, Chroneos ZC, Whitsett JA. GM-CSF regulates protein and lipid catabolism by alveolar macrophages. Am. J. Physiol. Lung Cell. Mol. Physiol. 2001;280:L379–L386. doi: 10.1152/ajplung.2001.280.3.L379. [DOI] [PubMed] [Google Scholar]
- 33.Bautz F, Rafii S, Kanz L, Mohle R. Expression and secretion of vascular endothelial growth factor-A by cytokine-stimulated hematopoietic progenitor cells. Possible role in the hematopoietic microenvironment. Exp. Hematol. 2000;28:700–706. doi: 10.1016/s0301-472x(00)00168-5. [DOI] [PubMed] [Google Scholar]
- 34.Banks WA, Kastin AJ, Huang W, Jaspan JB, Maness LM. Leptin enters the brain by a saturable system independent of insulin. Peptides. 1996;17:305–311. doi: 10.1016/0196-9781(96)00025-3. [DOI] [PubMed] [Google Scholar]
- 35.McLay RN, Kimura M, Banks WA, Kastin AJ. Granulocyte-macrophage colony-stimulating factor crosses the blood–brain and blood–spinal cord barriers. Brain. 1997;120:2083–2091. doi: 10.1093/brain/120.11.2083. [DOI] [PubMed] [Google Scholar]
- 36.Torre D, et al. Circulating levels of granulocyte macrophage colony-stimulating factor in patients with the systemic inflammatory response syndrome. J. Infect. 2003;47:296–299. doi: 10.1016/s0163-4453(03)00065-3. [DOI] [PubMed] [Google Scholar]
- 37.Kuhns DB, Alvord WG, Gallin JI. Increased circulating cytokines, cytokine antagonists, and E-selectin after intravenous administration of endotoxin in humans. J. Infect. Dis. 1995;171:145–152. doi: 10.1093/infdis/171.1.145. [DOI] [PubMed] [Google Scholar]
- 38.Tarkowski E, et al. Local and systemic GM-CSF increase in Alzheimer’s disease and vascular dementia. Acta Neurol. Scand. 2001;103:166–174. doi: 10.1034/j.1600-0404.2001.103003166.x. [DOI] [PubMed] [Google Scholar]
- 39.Natelson BH, Weaver SA, Tseng CL, Ottenweller JE. Spinal fluid abnormalities in patients with chronic fatigue syndrome. Clin. Diagn. Lab. Immunol. 2005;12:52–55. doi: 10.1128/CDLI.12.1.52-55.2005. [DOI] [PMC free article] [PubMed] [Google Scholar]
- 40.Franzen R, Bouhy D, Schoenen J. Nervous system injury: focus on the inflammatory cytokine ‘granulocyte-macrophage colony stimulating factor’. Neurosci. Lett. 2004;361:76–78. doi: 10.1016/j.neulet.2003.12.018. [DOI] [PubMed] [Google Scholar]
- 41.Gomez-Cambronero J, Veatch C. Emerging paradigms in granulocyte-macrophage colony-stimulating factor signaling. Life Sci. 1996;59:2099–2111. doi: 10.1016/s0024-3205(96)00414-6. [DOI] [PubMed] [Google Scholar]
- 42.Rosen RL, et al. Granulocyte-macrophage colony-stimulating factor preferentially activates the 94-kD STAT5A and an 80-kD STAT5A isoform in human peripheral blood monocytes. Blood. 1996;88:1206–1214. [PubMed] [Google Scholar]
- 43.Lai CF, et al. STAT3 and STAT5B are targets of two different signal pathways activated by hematopoietin receptors and control transcription via separate cytokine response elements. J. Biol. Chem. 1995;270:23254–23257. doi: 10.1074/jbc.270.40.23254. [DOI] [PubMed] [Google Scholar]
- 44.Brizzi MF, et al. Granulocyte-macrophage colony-stimulating factor stimulates JAK2 signaling pathway and rapidly activates p93fes, STAT1 p91, and STAT3 p92 in polymorphonuclear leukocytes. J. Biol. Chem. 1996;271:3562–3567. doi: 10.1074/jbc.271.7.3562. [DOI] [PubMed] [Google Scholar]
- 45.Niswender KD, Schwartz MW. Insulin and leptin revisited: adiposity signals with overlapping physiological and intracellular signaling capabilities. Front. Neuroendocrinol. 2003;24:1–10. doi: 10.1016/s0091-3022(02)00105-x. [DOI] [PubMed] [Google Scholar]
Associated Data
This section collects any data citations, data availability statements, or supplementary materials included in this article.


