Abstract
Nitrification in drinking water distribution systems is a common operational problem for many utilities that use chloramines for secondary disinfection. The diversity of ammonia-oxidizing bacteria (AOB) and nitrite-oxidizing bacteria (NOB) in the distribution systems of a pilot-scale chloraminated drinking water treatment system was characterized using terminal restriction fragment length polymorphism (T-RFLP) analysis and 16S rRNA gene (ribosomal DNA [rDNA]) cloning and sequencing. For ammonia oxidizers, 16S rDNA-targeted T-RFLP indicated the presence of Nitrosomonas in each of the distribution systems, with a considerably smaller peak attributable to Nitrosospira-like AOB. Sequences of AOB amplification products aligned within the Nitrosomonas oligotropha cluster and were closely related to N. oligotropha and Nitrosomonas ureae. The nitrite-oxidizing communities were comprised primarily of Nitrospira, although Nitrobacter was detected in some samples. These results suggest a possible selection of AOB related to N. oligotropha and N. ureae in chloraminated systems and demonstrate the presence of NOB, indicating a biological mechanism for nitrite loss that contributes to a reduction in nitrite-associated chloramine decay.
Many drinking water utilities in the United States have implemented chloramination for secondary disinfection because chloramines are less reactive than free chlorine and have been demonstrated to produce lower concentrations of disinfection by-products, such as trihalomethanes and haloacetic acids (2, 23, 25). However, the addition of chloramines can lead to biological instability in a drinking water distribution system by promoting the growth of nitrifying bacteria, microorganisms that oxidize ammonia to nitrite and nitrate. Chloramination introduces ammonia to the distribution system both as excess ammonia from chloramine formation and released ammonia from chloramine decay. Ammonia-oxidizing bacteria (AOB) are able to grow on the residual and released ammonia in the presence of chloramines and produce nitrite and soluble organic compounds (29, 32). The AOB cell mass and the products of AOB activity deplete the residual disinfectant concentration by exerting a chloramine demand and may sustain the growth of nitrite-oxidizing bacteria (NOB) and heterotrophs. The resulting reduction in chloramine residual and development of a microbial community in the distribution system lead to water quality deterioration and violation of drinking water regulations (49, 50).
Several studies have reported on the disinfection kinetics of AOB with chloramines 4, 18, 50; P. S. Oldenburg, J. M. Regan, G. W. Harrington, and D. R. Noguera, unpublished data). In general, the results of these investigations suggest that AOB should be inactivated effectively at typical chloramine exposure times and doses. Nonetheless, nitrification episodes are common in these systems, even in the presence of high chloramine residuals (4, 36). A survey of chloraminating utilities in the United States revealed that 63% of the utilities have experienced evidence of nitrification episodes (48), and an analytical survey of five chloraminated distribution systems in South Australia showed 64% of samples testing positive for nitrifying bacteria (4).
One hypothesis for the discrepancy between the laboratory studies and operating results is that there are AOB strains growing in full-scale systems that possess a greater chloramine resistance than those studied in the kinetic experiments. Whether the AOB strains used in earlier kinetic studies are representative of significant strains involved in full-scale nitrification episodes has not been confirmed, since there are no published evaluations of AOB diversity in chloraminated distribution systems.
There also are no reports on the presence of NOB in chloraminated systems and the effectiveness of chloramine inactivation of NOB. The emphasis of past studies on chloraminated systems has been on AOB, as the conceptual model of the escalation of nitrification episodes has involved incomplete nitrification, with nitrite evolving from AOB activity and accumulating in the water. Subsequent nitrite disappearance has been attributed to the chemical reaction between nitrite and chloramines (21, 45) in which the production of nitrate and ammonia occurs, thereby increasing the ammonia available as a growth substrate for AOB. However, it is conceivable that NOB play an important role in the ecology of nitrification and biological regrowth in these systems. Having an active NOB community coupled with AOB within the distribution system may favor the biological oxidation of nitrite to nitrate, thereby reducing the chloramine demand exerted by nitrite. NOB may also contribute to the growth of heterotrophs via the production of soluble organic products (32).
The objective of this study was to characterize AOB and NOB diversity in a pilot-scale chloraminated distribution system. The nitrifier communities were evaluated using a combination of molecular techniques, including a rapid screening approach using terminal restriction fragment length polymorphism (T-RFLP) and a more detailed analysis involving cloning and sequencing of 16S ribosomal DNA (rDNA) fragments. The results provided a characterization of nitrifier diversity in a chloraminated system and the first direct evidence of NOB associated with nitrification episodes in these systems.
MATERIALS AND METHODS
Pilot plant operation and sampling.
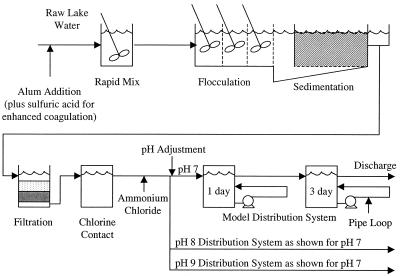
The pilot-scale drinking water treatment and distribution system used in this study (Fig. 1) was operated as part of a larger investigation of the factors affecting chloramine decay and the onset of nitrification (G. W. Harrington, D. R. Noguera, C. C. Bone, A. I. Kandou, P. S. Oldenburg, J. M. Regan, and D. V. Hoven, unpublished data). The raw water supply for the system was Lake Mendota in Madison, Wisconsin. Parallel treatment trains were operated at an approximate flow rate of 3.0 liters min−1 each. Treatment consisted of either conventional or enhanced (i.e., adjustment to pH 6 with sulfuric acid) alum coagulation followed by flocculation, sedimentation using inclined-tube settlers, dual-medium filtration through anthracite and sand, chlorination, and secondary chloramination through the addition of ammonium chloride. Following chloramine formation, the flow from each parallel train was partitioned into three separate model distribution systems with initial pH adjustments to 7, 8, or 9, creating six different treatment and distribution conditions. Each model distribution system consisted of two completely mixed tanks in series to simulate nominal distribution system detention times of 1 and 4 days. Associated with each retention tank was a 4.6-m-long, 1.3-cm (i.e., 0.5-in)-diameter polyvinyl chloride (PVC) pipe loop with a flow velocity maintained at approximately 4.3 cm s−1.
FIG. 1.
Pilot plant flow diagram. Two parallel systems were continuously operated, one with conventional alum coagulation and the other with enhanced coagulation. Each treatment train had three distribution systems maintained at pH 7, 8, and 9.
The system was routinely monitored for chemical and biological parameters, including chlorine, chloramines, ammonia, nitrite, nitrate, pH, heterotrophic plate counts using Standard Method 9215C with R2A agar (5), and most probable number (MPN) for AOB. The MPN enumeration involved a five-tube procedure with three 10-fold dilutions using Soriano and Walker medium (37) containing 0.1 ml of 1% (wt/vol) sodium thiosulfate to neutralize the chloramine residual (4). Tube contents were incubated in the dark for 21 days at 28°C and were tested for nitrite production using dimethyl-naphthylamine and sulfanilic acid (50). For the characterization of nitrifier communities, liquid samples from the six distribution systems were collected at the end of the operation period (day 259) in sterile sample bottles from the 4-day retention tanks, and 500-ml aliquots were filtered through a sterile 0.2-μm-pore-size nylon membrane filter for cell collection. The retained cells were resuspended in 1 ml of Tris-EDTA (TE) buffer (10 mM Tris and 1 mM EDTA, pH 8.0) and were transferred to a sterile 1.5-ml microcentrifuge tube. Biofilm samples were also collected on the same day from each 4-day PVC pipe loop by cutting 15-cm-long sections of PVC, scraping the inside of the pipe section with a sterile spatula, and transferring the detached biofilm to 1 ml of sterile deionized water.
DNA extraction.
Biofilm and filtered cells from liquid samples were washed by pelleting for 5 min at 14,800 ×g and resuspending in 550 μl of TE. Lysis was performed by the addition of 25 μl of 50 mg of lysozyme ml− 1 and a 1-h incubation at 37°C, followed by the addition of 3 μl of 20-mg ml−1 proteinase K and 30 μl of 20% sodium dodecyl sulfate and a 1-h incubation at 37°C. The suspension was centrifuged at 14,800 × g for 5 min, and 500 μl of supernatant was recovered and transferred to a clean microcentrifuge tube. The DNA was purified by the addition of 500 μl of buffered phenol-chloroform-isoamyl alcohol (25:24:1), gentle mixing, and centrifuging for 5 min at 20,200 ×g. From the aqueous layer, 300 μl was transferred to a clean microcentrifuge tube, and nucleic acids were precipitated by the addition of 30 μl of sodium acetate (3 M, pH 5.2) and 600 μl of ice-cold 100% ethanol, followed by 20 min of storage at −20°C. The samples were centrifuged for 5 min at 20,200 ×g, supernatant was drawn off, and the nucleic acid pellet was washed once with 1 ml of ice-cold 70% ethanol. The ethanol was removed, and the tubes were placed in a vacuum desiccator until dry. The nucleic acids were dissolved in 100 μl of TE and stored at−20°C.
T-RFLP analysis.
Purified DNA was analyzed by AOB- and NOB-specific 16S rDNA-targeted T-RFLP as well as the amoA-targeted T-RFLP protocol described by Horz et al. (10). For the 16S rDNA protocol, amplification of AOB and NOB DNA was performed by nested PCR, using the universal primers 11f and 1492r (Table 1) to achieve an initial increase in template concentration followed by the specific amplification of AOB and NOB 16S rDNA. PCR was performed in 50-μl reaction volumes containing 50 mM KCl, 10 mM Tris-HCl, 0.1% Triton X-100, 0.1-mg ml−1 nonacetylated bovine serum albumin (Sigma), 0.4 μM forward and reverse primer, 2.5 mM MgCl2, and a 0.2 mM concentration of each deoxynucleoside triphosphate. For the universal amplification step, 5μl of template DNA was used, while 1 μl of universal amplification product was used as the template for the nitrifier-specific reactions. After a 5-min hot start at 80°C, 2.5 U of Taq polymerase (Promega) was added to each tube. The universal amplification involved an initial denaturation at 95°C for 5 min, followed by 30 cycles of 1.5-min denaturation at 95°C, 2 min of annealing at 52° C, and 3 min of extension at 72°C, with a final 10-min extension at 72° C. The AOB- and NOB-specific 16S rDNA amplifications involved an initial denaturation at 95°C for 5 min, followed by 30 cycles of 1.5-min denaturation at 95°C, 0.5 min of annealing at 65°C, and a 1 min extension at 72°C, with a final 6-min extension at 72°C. The amoA-targeted protocol was performed as previously described (10). Negative controls without template addition were treated identically in the nested 16S rDNA- and amoA-targeted reactions to confirm the absence of contaminating DNA. In the AOB- and NOB-specific 16S rDNA and the amoA amplifications, the forward primers were labeled with the phosphoramidite dye 6-FAM. PCR products were purified using the QIAquick PCR Purification Kit (QIAGEN), and amoA PCR products were gel purified using the QIAEX II Gel Extraction Kit (QIAGEN).
TABLE 1.
PCR primers
| Primer | Sequence (5′ to 3′) | Specificity | Reference |
|---|---|---|---|
| 11f | GTT TGA TCC TGG CTC AG | Bacteria 16S rDNA | 14 |
| 1492r | TAC CTT GTT ACG ACT T | Bacteria 16S rDNA | 19 |
| EUB338fa | ACT CCT ACG GGA GGC AGC | Bacteria 16S rDNA | 1 |
| Nso1225 | CGC CAT TGT ATT ACG TGT GA | β-subclass AOB 16S rDNA | 24 |
| NIT3 | CCT GTG CTC CAT GCT CCG | Nitrobacter 16S rDNA | 46 |
| Ntspa0685 Mb | CGG GAA TTC CGC GCT C | Nitrospira 16S rDNA | 12 |
| AmoA-1F | GGG GTT TCT ACT GGT GGT | amoA | 33 |
| AmoA-2R | CCC CTC KGS AAA GCC TTC TTC | amoA | 33 |
Reverse complement of EUB338.
Ntspa0685 was modified by eliminating 3 bases from each end to reduce the melting temperature and to eliminate mismatches with several Nitrospira sequences.
Restriction digestion mixtures contained 9 μl of sample, 1 μl of enzyme buffer, and 1 μl of either 10 U of MspI (MBI Fermentas) μl−1 for 16S rDNA or 10 U of TaqI (MBI Fermentas) μl−1 for amoA. Samples were analyzed by either capillary electrophoresis with an ABI Prism 310 Genetic Analyzer (Applied Biosystems) or gel electrophoresis with an ABI Prism 377XL Sequencer (Applied Biosystems). For capillary electrophoresis, samples were prepared by denaturing 2-μl aliquots and 1 μl of TAMRA-labeled GeneScan-500 (Applied Biosystems) as an internal size standard in 20-μl deionized formamide at 95°C for 5 min. Analysis involved performance-optimized polymer (POP-4) (Applied Biosystems), a 10-s injection at 15 kV, and an electrophoresis voltage of 15 kV at a column temperature of 60°C. Electropherograms were analyzed using the application GeneScan (Applied Biosystems).
AOB and NOB terminal fragments.
To identify primer sequences that selectively target AOB and NOB and restriction sites that allow their differentiation, nearly complete 16S rDNA sequences for 46 AOB and 41 NOB were retrieved from the GenBank database (http://www.ncbi.nlm.nih.gov/). The PCR strategy involved coupling a specific reverse primer with EUB338 as a forward primer. While EUB338 targets the Bacteria domain, the use of AOB- and NOB-specific reverse primers would result in only linear PCR amplification of nonnitrifier sequences.
Of the AOB 16S rDNA-targeted primers in the literature (31, 44), Nso1225 was selected as the broadest AOB primer that retains specificity for AOB in the β subclass of the Proteobacteria (24). AOB belonging to the γ subclass of the Proteobacteria (e.g., Nitrosococcus oceanus) were not targeted in this protocol. Of the availableβ-subclass Proteobacteria AOB sequences, only Nitrosococcus mobilis does not have a perfect complement to Nso1225, with a single base mismatch near the 5′ primer end.
The NOB constitute a more phylogenetically diverse group than the AOB (42). No single primer was identified that would target all of the characterized NOB diversity. Therefore, two primers were selected to separately target Nitrobacter and Nitrospira strains. Nitrococcus and Nitrospina were not targeted in this protocol. NIT3 was chosen to target the Nitrobacter sequences (46). This primer is an exact match with all of the deposited Nitrobacter sequences. The closest nontarget sequences that were identified by database searches have one mismatch and are from Bradyrhizobium japonicum, Afipia clevelandensis, Afipia felis, and Rhodopseudomonas palustris, which are all α -subclass Proteobacteria closely related to Nitrobacter. For the Nitrospira representatives, Ntspa0685 was modified by removing 3 nucleotides from each end to produce a primer (Ntspa0685 M) with a melting temperature compatible with EUB338 that exactly matches all but one of the available Nitrospira-type sequences, the exception having one mismatch (12). This primer is an exact match with one non-NOB 16S rDNA, a Cytophaga sp. recovered from deep-sea sediment. The next nearest sequences have one mismatch with Ntspa0685 M and are from the thermophilic sulfate reducer Thermodesulfovibrio, Ammoniphilus oxalaticus, and the thermophilic Bacillus schlegelii. Details of the primers are presented in Table 1.
Twenty-six restriction enzymes with different recognition sequences were evaluated by determining both the 5′ and 3′ terminal fragment lengths that would be generated from the PCR product of each AOB and NOB sequence. Based on this analysis, the 4-base cutter MspI was selected due to its generation of two distinct 5′-terminal fragments corresponding to the Nitrosomonas and Nitrosospira AOB genera and distinct 5′-terminal fragments for Nitrobacter and Nitrospira sequences. The terminal fragment lengths for these genera are 160 to 166 bases for Nitrosomonas, 105 to 107 bases for Nitrosospira, 141 bases for Nitrobacter, and 265 to 267 and 277 bases for Nitrospira (except for several Nitrospira clone sequences, which give terminal lengths of 134, 321, and 335 bases). Distinction among 16S rDNA-inferred subclusters within the Nitrosomonas and Nitrosospira genera was not possible with this T-RFLP analysis.
Cloning and sequencing.
Unlabeled PCR products were cloned following the instructions in the pGEM-T Vector System I kit (Promega). Ligations with pGEM-T were performed overnight at 4°C. Transformations were performed using competent cells of Escherichia coli JM109 prepared by a rubidium chloride technique (Protocol and Applications Guide, 3rd ed., Promega Corp., Madison, Wis.). Transformants were selected by ampicillin resistance, and blue-white screening was performed to identify clones with inserts. Following PCR confirmation of insert size, plasmids were extracted from clones using the Wizard Plus SV Minipreps DNA Purification System (Promega). Inserts were sequenced from both directions using the SP6 and T7 RNA polymerase promoter sequences on pGEM-T and cycle sequencing with ABI Prism BigDye dideoxy dye terminators. Samples were purified with AutoSeq G-50 purification columns (Amersham Pharmacia Biotech) and sequenced at the University of Wisconsin Biotechnology Center. ClustalX (43) was used for sequence alignment, tree generation using the neighbor-joining method, and bootstrap analysis. Clone sequences were analyzed using the Basic Logic Alignment Search Tool to evaluate similarities with sequences deposited in GenBank. Sequences were also analyzed for chimeric artifacts using the Chimera Check online analysis function from the Ribosomal Database Project II (20) and by comparison of neighbor-joining trees generated from the first and second halves of the aligned sequence fragments. Any chimeric sequences identified in this manner were removed from further analysis.
Nucleotide sequence accession numbers.
The sequences determined in this study have been deposited in the GenBank database under accession numbers AY048920 to AY048968.
RESULTS
Pilot plant operating data.
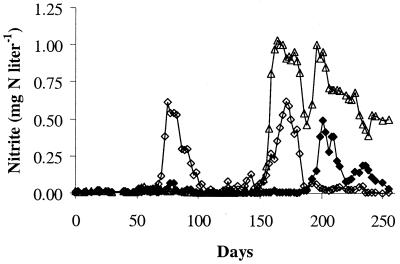
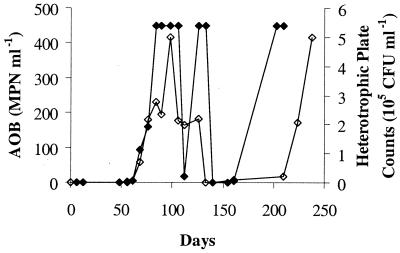
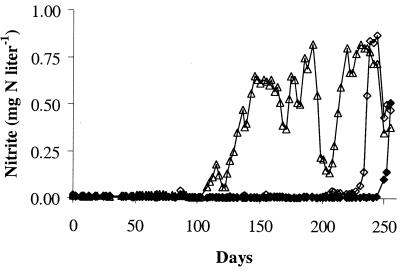
Chemical and biological monitoring of the pilot plant revealed evidence of nitrification in each of the six distribution systems. Nitrite production was observed in the 4-day retention time tanks for the conventional and enhanced coagulation systems (Fig. 2 and 3, respectively) after an operating period of 3 to 9 months. Nitrate production, which can be due to NOB growth or oxidation of nitrite by chloramine, was also detected in each of the distribution systems. sMicrobial enumeration by MPN and heterotrophic plate counts showed the proliferation of AOB and heterotrophs (Fig. 4). This microbial growth occurred in the presence of average chloramine residuals of 0.2 mg of Cl2 liter− 1 to 1.1 mg of Cl2 liter−1 and an average free ammonia concentration of 0.3 to 0.6 mg N liter−1 over the duration of the study (Harrington et al., unpublished).
FIG. 2.
Nitrite concentration in the 4-day retention tanks of the conventional coagulation treatment train: pH 7 (⧫), pH 8 (◊), and pH 9 (▵).
FIG. 4.
Ammonia-oxidizing bacteria (⧫) and heterotrophic bacteria (◊) enumeration by MPN and heterotrophic plate counts, respectively, for the 4-day retention tank of the pH 8 conventional coagulation system. The dilution series used in the MPN test imposed a maximum AOB quantitation level of 448 MPN ml−1.
AOB community.
Distribution system samples were analyzed for AOB via amoA- and 16S rDNA-targeted T-RFLP. PCR amplification yielded very little product from both the amoA and 16S rDNA gene targets due to low template concentration in the DNA preparations. The low yield resulted in poor T-RFLP electropherograms in which the peak heights of AOB-specific fragments were not distinguishable from background interferences. Therefore, nested PCR was incorporated in the 16S rDNA protocol using universal primers. This provided a significant enhancement to the amplicon yield and the quality of the nitrifier-specific 16S rDNA electropherograms. Sufficient sequencing information was not available to develop a nested protocol for amoA-based T-RFLP.
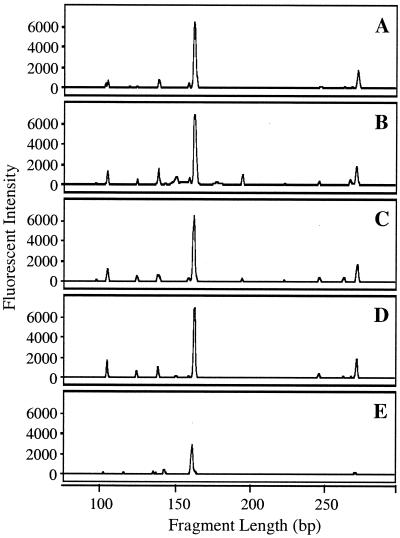
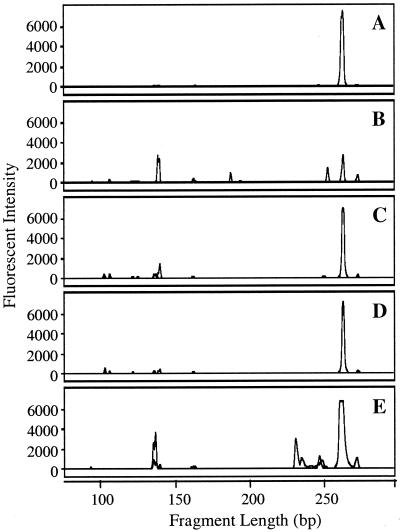
Typical AOB-specific 16S rDNA-targeted T-RFLP electropherograms for the 4-day retention tank samples and a biofilm sample from the pH 8 conventional coagulation distribution system are presented in Fig. 5. Biofilm samples from the other distribution systems did not yield sufficient PCR products, consistent with the visual observation during sampling of minimal attached growth on the pipes of these systems. All six of the distribution systems and the biofilm sample showed a large peak associated with Nitrosomonas-type AOB (166 bp), while the peak height for Nitrosospira-type template DNA (106 bp) was considerably smaller, representing only 8 to 32% of the sum of the AOB-associated peak heights. This pattern was consistent among the six distribution system conditions. The electropherograms also show the presence of unexpected labeled fragment lengths for the AOB-specific protocol. The peak near 270 bp detected in each of the liquid samples may be due to uncharacterized AOB or incomplete digestion of the labeled products, as the PCR fragments from all Nitrosomonas templates have an additional MspI restriction site 270 to 276 bp from the labeled 5′ end. The other extraneous peaks are likely caused by nonspecific amplification of non-AOB sequences, as discussed below.
FIG. 5.
AOB-targeted T-RFLP electropherograms for liquid samples collected from the 4-day retention tanks (A to D) and a biofilm sample from the pH 8 conventional coagulation system (E). Panel A is for the pH 8 conventional coagulation system, and panels B through D are for the pH 7, 8, and 9 enhanced coagulation systems, respectively.
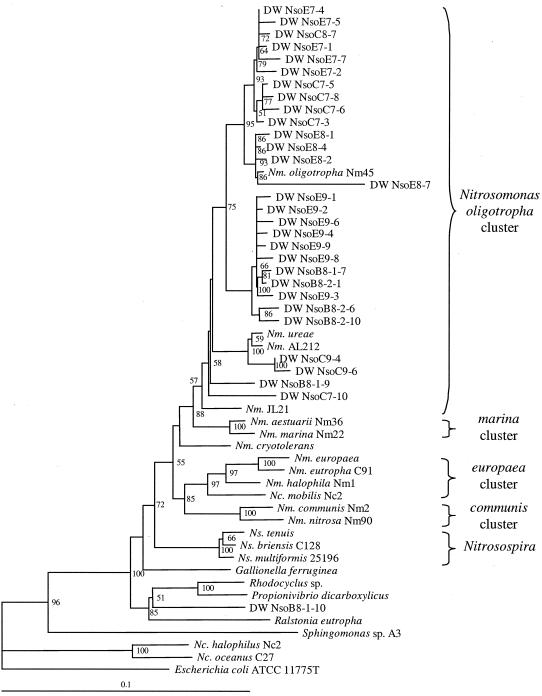
Cloning and sequencing of AOB 16S rDNA PCR products were performed to increase the resolution of AOB characterization beyond the Nitrosomonas-Nitrosospira differentiation achieved by the 16S rDNA T-RFLP protocol. The approximately 900-bp insert sequences were aligned with 16S rDNA sequences from AOB species and other Proteobacteria representatives. Figure 6 depicts a neighbor-joining tree generated from the sequence alignment. The results show the presence of AOB with sequences within the Nitrosomonas oligotropha cluster (cluster 6a according to the nomenclature established by Stephen et al. [40]), which is represented by the species N. oligotropha and Nitrosomonas ureae (31), while no Nitrosospira-like sequences were retrieved.
FIG. 6.
Neighbor-joining tree generated from an alignment of 16S rDNA sequences from AOB and other Proteobacteria. AOB genus abbreviations are Nm for Nitrosomonas, Nc for Nitrosococcus, and Ns for Nitrosospira. Clones recovered from the drinking water distribution systems are designated DW Nso, followed by B for biofilm or C and E for conventional and enhanced coagulation, respectively; the nominal pH of the distribution system; and the clone number. Bootstrap values above 50 are shown at each node. Scale bar represents 10% sequence difference. Redundant clone sequences are not shown.
The cloning results also revealed the amplification of nontarget sequences, including false positives (i.e., non-AOB sequences that generate the same labeled fragment length as AOB). The false positives (e.g., clone NsoB8-1-10 in Fig. 6) were confined to other members of the β subclass of the Proteobacteria. Some were similar to Gallionella ferruginea, which has no mismatches with Nso1225 and generates a Nitrosospira-like fragment length, and others resembled Rhodocyclus sp. and Propionivibrio dicarboxylicus, which have three mismatches with Nso1225 and produce a Nitrosomonas-like peak. In addition, several Sphingomonas-related clones were detected, which generated a non-AOB, 141-bp terminal fragment, visible in Fig. 5.
NOB community.
NOB were analyzed by the nested-PCR strategy using the universal primers, followed by PCR separately targeting Nitrobacter and Nitrospira. For simplicity in the analysis, the Nitrobacter and Nitrospira T-RFLP results are superimposed in Fig. 7, which summarizes typical results for the liquid samples and the biofilm sample from the pH 8 conventional coagulation system.Nitrobacter (141 bp) was detected in the pH 7 conventional coagulation system, albeit at a low intensity. In the enhanced coagulation systems, the Nitrobacter-related peaks were more evident and exhibited a decreasing peak height from pH 7 to pH 9.Nitrobacter was also detected in the biofilm sample from the pH 8 conventional coagulation system, despite its absence or low numbers in the liquid sample from this distribution system. A significant Nitrospira peak (265 and 277 bp) was detected in all of the samples.
FIG. 7.
NOB-targeted T-RFLP electropherograms for liquid samples collected from the 4-day retention tanks (A to D) and a biofilm sample from the pH 8 conventional coagulation system (E). Panel A is for the pH 8 conventional coagulation system, and panels B through D are for the pH 7, 8, and 9 enhanced coagulation systems, respectively. Data from Nitrobacter- and Nitrospira-specific T-RFLP are superimposed.
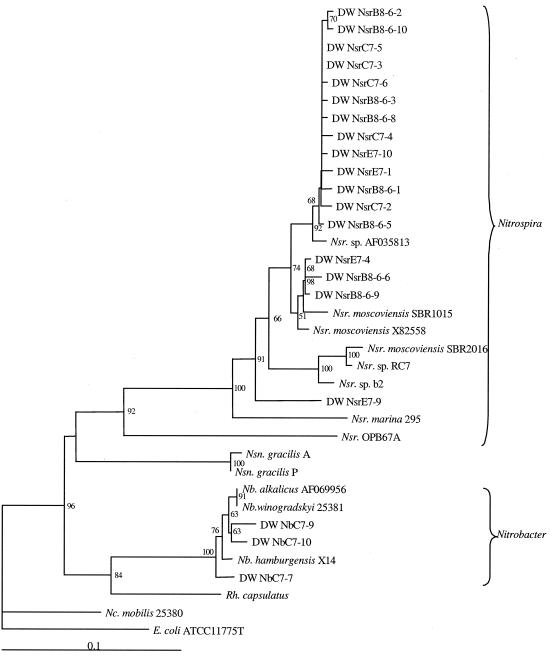
Cloning and sequencing were performed with the pH 7 conventional coagulation system for Nitrobacter PCR products and with both pH 7 systems and the pH 8 biofilm sample for Nitrospira fragments to confirm the positive identity of the NOB peaks. The phylogenetic relationships of the clone sequences relative to NOB sequences and non-NOB representatives are depicted in Fig. 8. The cloned fragments from Nitrobacter-targeted PCR did not show a strong association with any one of the Nitrobacter species but clearly aligned with these sequences. Most of the Nitrospira sequences were related to Nitrospira moscoviensis and a Nitrospira clone sequence (Nsr. sp. AF035813 in Fig. 8) from a freshwater aquarium (12). In addition, one Nitrospira clone did not cluster with any other known species or environmental clones.
FIG. 8.
Neighbor-joining tree generated from an alignment of 16S rDNA sequences from NOB and several Proteobacteria representatives. NOB genus abbreviations are Nb for Nitrobacter, Nc for Nitrococcus, Nsr for Nitrospira, and Nsn for Nitrospina. Clone designations are the same as in Fig. 6 except for a prefix of Nb or Nsr for Nitrobacter- or Nitrospira-specific PCR, respectively. Bootstrap values above 50 are shown at each node. Scale bar represents 10% sequence difference. Redundant clone sequences are not shown.
DISCUSSION
Figures 2 to 4 represent the typical problem of water quality degradation in chloraminated distribution systems. The appearance of nitrifiers is accompanied by an increase in nitrite concentration and the colonization of the system by heterotrophic bacteria (49). Full-scale systems undergo routine distribution system flushing or breakpoint chlorination to prevent nitrifier growth. When a nitrifier community is established, however, efforts to eradicate these organisms from the distribution system require more drastic and costly approaches as the communities appear to acquire a higher resistance to chloramines (26). The pilot plant used in this study was operated as part of a larger effort to evaluate operational parameters (i.e., the efficiency of natural organics removal and the pH of the finished water) that may delay the onset of nitrification in chloraminated systems (Harrington et al., unpublished). As such, the system was operated consistently even after nitrification became evident, thus providing an experimental system to evaluate nitrifier communities in chloraminated drinking water systems. This study provides the first glance at the diversity of AOB and NOB present in these communities, which is an initial step towards understanding the persistence of nitrifying microorganisms in chloraminated water.
The 16S rDNA-based T-RFLP analysis using nested PCR was sensitive and effective at discriminating between Nitrosomonas and Nitrosospira AOB and at detecting Nitrobacter and Nitrospira NOB. Although the amoA-targeted T-RFLP protocol allows a greater discrimination of AOB clusters (10), the amplification was not sensitive enough for the clear detection of target peaks above background noise. While other researchers have used nested PCR for increased sensitivity of amoA detection from environmental samples, the primers from these studies were specific for the species Nitrosomonas europaea (8) or designed based on amoA sequences from N. europaea and Nitrosococcus mobilis isolates (13). The ability of the primer pairs used by Juretschko et al. (13) to amplify amoA from diverse AOB templates is unknown, as the target sequences of these primers are outside the amoA fragments that have been sequenced from a wide range of AOB isolates and environmental samples.
The molecular analyses of the AOB community in each pilot-scale distribution system retrieved a predominance of 16S rDNA PCR products from Nitrosomonas template, with considerably less Nitrosospira-related product. This is evident from the T-RFLP electropherograms (Fig. 5) and is consistent with the cloning and sequencing, which did not recover a single Nitrosospira-like sequence. The majority of cloned sequences were affiliated with the N. oligotropha cluster, with clones resembling N. oligotropha and N. ureae. These analyses are subject to potential biases associated with PCR amplification and cloning. Attempts to evaluate cell numbers of different AOB groups using fluorescent in situ hybridization failed due to nonspecific binding of labeled probe to noncellular material present in the sample matrix, as determined by 4′,6′ -diamidino-2-phenylindole staining of cells.
There are only a few phenotypic and ecological characterizations of N. oligotropha cluster representatives reported in the literature. N. oligotropha is the Nitrosomonas species reported to experience substrate inhibition at the lowest ammonia concentrations (i.e., 20 to 70 mM NH3 or approximately 200 to 1,000 mg of N liter−1), while N. ureae can tolerate up to 200 mM (16, 39, 41). Although these studies reveal an ammonia sensitivity by this group of AOB, the inhibitory concentrations are much higher than the concentrations observed in chloraminated drinking water systems (typically <0.2 mM), and thus, it is unlikely that this factor influences their presence in the distribution systems.
N. oligotropha cluster representatives have been isolated from soil, freshwater, estuary sediments, industrial sewage, and laboratory-activated sludge systems (16, 39, 41). They have also been detected by molecular methods in freshwater and sediments (38), shallow soil samples over a pH range of 3.9 to 6.6 (40), full-scale activated sludge treatment plants (30), and a phosphate-removing lab-scale biofilm reactor (7). While Kowalchuk et al. (17) reported the detection of cluster 6 AOB (nomenclature by Stephen et al. [40]) from pig and chicken manure compost and a calf-slurry-activated sludge system, the presence of N. oligotropha representatives could not be determined unequivocally in their study because the initial probe designed for this cluster (40) also targets Nitrosococcus mobilis, which belongs to the N. europaea cluster (cluster 7). The understanding of the ecology of N. oligotropha cluster AOB has likely been affected by PCR and probing biases resulting from primers and probes that do not target this group. Several studies of AOB communities in oligotrophic environments have used primer pairs with two to more than five mismatches with N. oligotropha and reported the failure to detect AOB in nitrifying systems (11) or the prevalence of Nitrosospira and the sporadic detection of Nitrosomonas (8, 9, 47). It is possible that these reports provide a biased picture of AOB diversity, particularly in oligotrophic environments in which N. oligotropha representatives may outcompete other Nitrosomonas organisms and be competitive with Nitrosospira.
There may have been a selective advantage for N. oligotropha and N. ureae in the low ammonia concentrations present in the finished water of the pilot plant, which averaged 0.3 to 0.6 mg of NH3-N liter−1 (i.e., 0.02 to 0.04 mM NH3) and never exceeded 2.4 mg of NH3-N liter−1 (i.e., 0.17 mM NH3). This presents an environment with an ammonia concentration near the measured Km of available N. oligotropha strains and more than an order of magnitude below that of several other Nitrosomonas strains (39). Consistent with this hypothesis, Gieseke et al. (7) studied a phosphorus-removing biofilm and observed a deeper penetration of N. oligotropha-like AOB than N. europaea-like AOB into the biofilm, which corresponded to an environment with lower ammonia and dissolved-oxygen concentrations. Their apparent affinity for ammonia may have allowed them to outcompete the more copiotrophic AOB strains. Although the ammonia concentrations in the distribution system were also of the same order of magnitude as the reported Km for Nitrosospira sp. (34), none of the recovered clones belonged to this cluster. Another possible selection factor may be related to chloramine resistance. Previous studies of AOB inactivation with chloramines have used N. europaea (Oldenburg et al., unpublished) and an isolate morphologically identified as a Nitrosomonas with no species determination (18, 50), but representatives from the N. oligotropha or Nitrosospira clusters have not yet been evaluated.
The potential for the growth of NOB in chloraminated systems has been mentioned (48, 49) but not investigated, presumably because the primary fate of nitrite that concerns drinking water utilities is the reduction of the chloramine residual. The results of this study indicate that Nitrospira-like NOB were ubiquitous and that Nitrobacter was present in some of the systems, suggesting that complete nitrification may present a significant alternate sink for nitrite produced by AOB growth. This hypothesis is also supported by the chemical monitoring data from the pilot plant, which showed the formation of nitrate during periods of near-zero chloramine residuals. The presence of Nitrospira and sporadic detection of Nitrobacter in this freshwater environment are consistent with the findings of many recent studies (3, 7, 13, 27, 34, 35), even in a system that was seeded with a Nitrobacter inoculum (12). As with the hypothesis presented above for the possible dominance of N. oligotropha, this low-nitrite environment may have selected for a Nitrospira-dominated NOB community. Schramm et al. (34) estimated a Km for Nitrospira of 0.01 mM nitrite (i.e., 0.14 mg of NO2−-N liter−1), and Ehrich et al. (6) reported optimum growth of Nitrospira moscoviensis at 0.35 mM nitrite, with inhibition above 15 mM. This Km estimate is 1 or 2 orders of magnitude lower than reported values for Nitrobacter strains (15, 28, 51).
Ideally drinking water utilities would have a means of early detection of a pending nitrification episode to allow the implementation of a control strategy before observation of a measurable deterioration of water quality. Traditional AOB enumeration by MPN requires at least 3 weeks of incubation, thereby yielding operationally irrelevant data. To address this, a number of studies have searched for a correlation between nitrification and a surrogate early warning indicator. Wolfe et al. (50) reported a correlation with heterotrophic plate counts using R2A agar but no consistent correlation with nitrite concentration. The results of this pilot study generally showed a concurrent onset of nitrification and increases in heterotrophic plate counts (Fig. 4). Lieu et al. (18) reported that an increase in nitrite concentration lagged behind AOB growth by 1 to 3 weeks at 15°C in batch disinfection experiments. In a study of chloraminated systems in Australia, Cunliffe (4) reported that an increase in oxidized nitrogen species and a decrease in total chlorine residual served as early indicators of nitrification. Wilczak et al. (48) conducted an analytical survey of 10 chloraminating utilities and reported a lack of correlation between nitrification (operationally defined as >50 μg of nitrite and nitrate N liter−1 in their survey) and plant effluent ammonia or pH. Typically, increases in oxidized nitrogen were associated with increases in heterotrophic plate counts and sometimes with a decrease in dissolved oxygen.
Given the inconsistency in these findings, Wilczak et al. (48) concluded that the best indicators of nitrification were a nitrogen balance and the detection of AOB and NOB. The nested-PCR T-RFLP protocol presented here provided a rapid and sensitive screening approach for detecting the presence of nitrifying bacteria that could be useful to drinking water utilities for monitoring AOB and NOB communities. T-RFLP allowed the detection of AOB and NOB within a few days and was not subject to culturability biases, representing a marked improvement over the minimum 3-week incubation period for MPN enumeration (22). While the method is not quantitative in the presented form, it could be applied as a presence/absence tool to detect the presence of nitrifying bacteria in the distribution system, which may indicate the potential onset of a nitrification episode before other water quality parameters are affected.
FIG. 3.
Nitrite concentration in the 4-day retention tanks of the enhanced coagulation treatment train: pH 7 (⧫), pH 8 (◊), and pH 9 (▵).
Acknowledgments
Support for this research was provided by the AWWA Research Foundation, NSF (BES9875642), and NIH (NIH 5 t32 GM08349). Additional support was from an S.C. Johnson Distinguished Fellowship and the University of Wisconsin—Madison Graduate School. The University of Wisconsin-Madison gratefully acknowledges that the AWWA Research Foundation is the joint owner of the technical information upon which this publication is based. The University of Wisconsin-Madison thanks the Foundation for its financial, technical, and administrative assistance in funding and managing the project through which this information was discovered.
We also thank David Van Hoven, Shih-Yen Cheng, and Kristine Hahn for operation and monitoring of the pilot plant during the work described here.
REFERENCES
- 1.Amann, R. I., B. J. Binder, R. J. Olson, S. W. Chisholm, R. Devereux, and D. A. Stahl. 1990. Combination of 16S rRNA-targeted oligonucleotide probes with flow cytometry for analyzing mixed microbial populations. Appl. Environ. Microbiol. 56:1919–1925. [DOI] [PMC free article] [PubMed] [Google Scholar]
- 2.Brodtmann, N. V., and P. J. Russo. 1979. The use of chloramine for reduction of trihalomethanes and disinfection of drinking water. J. Am. Water Works Assoc. 71:40–42. [Google Scholar]
- 3.Burrell, P. C., J. Keller, and L. L. Blackall. 1998. Microbiology of a nitrite-oxidizing bioreactor. Appl. Environ. Microbiol. 64:1878–1883. [DOI] [PMC free article] [PubMed] [Google Scholar]
- 4.Cunliffe, D. A. 1991. Bacterial nitrification in chloraminated water supplies. Appl. Environ. Microbiol. 57:3399–3402. [DOI] [PMC free article] [PubMed] [Google Scholar]
- 5.Eaton, A. D., L. S. Clesceri, and A. E. Greenberg (ed.). 1995. Standard methods for the examination of water and wastewater, 19th ed. American Public Health Association, Washington, D.C.
- 6.Ehrich, S., D. Behrens, E. Lebedeva, W. Ludwig, and E. Bock. 1995. A new obligately chemolithoautotrophic, nitrite-oxidizing bacterium. Nitrospira moscoviensis sp. nov. and its phylogenetic relationship. Arch. Microbiol. 164:16–23. [DOI] [PubMed] [Google Scholar]
- 7.Gieseke, A., U. Purkhold, M. Wagner, R. Amann, and A. Schramm. 2001. Community structure and activity dynamics of nitrifying bacteria in a phosphate-removing biofilm. Appl. Environ. Microbiol. 67:1351–1362. [DOI] [PMC free article] [PubMed] [Google Scholar]
- 8.Hastings, R. C., M. T. Ceccherini, N. Miclaus, J. R. Saunders, M. Bazzicalupo, and A. J. McCarthy. 1997. Direct molecular biological analysis of ammonia oxidising bacteria populations in cultivated soil plots treated with swine manure. FEMS Microbiol. Ecol. 23:45–54. [Google Scholar]
- 9.Hiorns, W. D., R. C. Hastings, I. M. Head, A. J. McCarthy, J. R. Saunders, R. W. Pickup, and G. H. Hall. 1995. Amplification of 16S ribosomal RNA genes of autotrophic ammonia-oxidizing bacteria demonstrates the ubiquity of Nitrosospiras in the environment. Microbiology 141:2793–2800. [DOI] [PubMed] [Google Scholar]
- 10.Horz, H.-P., J.-H. Rotthauwe, T. Lukow, and W. Liesack. 2000. Identification of major subgroups of ammonia-oxidizing bacteria in environmental samples by T-RFLP analysis of amoA PCR products. J. Microbiol. Methods 39:197–204. [DOI] [PubMed] [Google Scholar]
- 11.Hovanec, T. A., and E. F. DeLong. 1996. Comparative analysis of nitrifying bacteria associated with freshwater and marine aquaria. Appl. Environ. Microbiol. 62:2888–2896. [DOI] [PMC free article] [PubMed] [Google Scholar]
- 12.Hovanec, T. A., L. T. Taylor, A. Blakis, and E. F. Delong. 1998. Nitrospira-like bacteria associated with nitrite oxidation in freshwater aquaria. Appl. Environ. Microbiol. 64:258–264. [DOI] [PMC free article] [PubMed] [Google Scholar]
- 13.Juretschko, S., G. Timmermann, M. Schmid, K.-H. Schleifer, A. Pommerening-Röser, H.-P. Koops, and M. Wagner. 1998. Combined molecular and conventional analyses of nitrifying bacterium diversity in activated sludge:Nitrosococcus mobilis and Nitrospira-like bacteria as dominant populations. Appl. Environ. Microbiol. 64:3042–3051. [DOI] [PMC free article] [PubMed] [Google Scholar]
- 14.Kane, M. D., L. K. Poulsen, and D. A. Stahl. 1993. Monitoring the enrichment and isolation of sulfate-reducing bacteria by using oligonucleotide hybridization probes designed from environmentally derived 16S rRNA sequences. Appl. Environ. Microbiol. 59:682–686. [DOI] [PMC free article] [PubMed] [Google Scholar]
- 15.Keen, G. A., and J. I. Prosser. 1987. Steady state and transient growth of autotrophic nitrifying bacteria. Arch. Microbiol. 147:73–79. [Google Scholar]
- 16.Koops, H.-P., B. Böttcher, U. C. Möller, A. Pommerening-Röser, and G. Stehr. 1991. Classification of eight new species of ammonia-oxidizing bacteria:Nitrosomonas communis sp. nov., Nitrosomonas ureae sp. nov., Nitrosomonas aestuarii sp. nov.,Nitrosomonas marina sp. nov., Nitrosomonas nitrosa sp. nov., Nitrosomonas eutropha sp. nov.,Nitrosomonas oligotropha sp. nov. and Nitrosomonas halophila sp. nov. J. Gen. Microbiol. 137:1689–1699. [Google Scholar]
- 17.Kowalchuk, G. A., Z. S. Naoumenko, P. J. L. Derikx, A. Felske, J. R. Stephen, and I. A. Arkhipchenko. 1999. Molecular analysis of ammonia-oxidizing bacteria of the β subdivision of the class Proteobacteria in compost and composted materials. Appl. Environ. Microbiol. 65:396–403. [DOI] [PMC free article] [PubMed] [Google Scholar]
- 18.Lieu, N. I., R. L. Wolfe, and I. E. G. Means. 1993. Optimizing chloramine disinfection for the control of nitrification. J. Am. Water Works Assoc. 85:84–90. [Google Scholar]
- 19.Lin, C., and D. A. Stahl. 1995. Taxon-specific probes for the cellulolytic genus Fibrobacter reveal abundant and novel equine-associated populations. Appl. Environ. Microbiol. 61:1348–1351. [DOI] [PMC free article] [PubMed] [Google Scholar]
- 20.Maidak, B. L., J. R. Cole, T. G. Lilburn, C. T. Parker, Jr., P. R. Saxman, J. M. Stredwick, G. M. Garrity, B. Li, G. J. Olsen, S. Pramanik, T. M. Schmidt, and J. M. Tiedje. 2000. The RDP (Ribosomal Database Project) continues. Nucleic Acids Res. 28:173–174. [DOI] [PMC free article] [PubMed] [Google Scholar]
- 21.Margerum, D. W., L. M. Schurter, J. Hobson, and E. E. Moore. 1994. Water chlorination chemistry: nonmetal redox kinetics of chloramine and nitrite ion. Environ. Sci. Technol. 28:331–337. [DOI] [PubMed] [Google Scholar]
- 22.Matulewich, V. A., P. F. Strom, and M. S. Finstein. 1975. Length of incubation for enumerating nitrifying bacteria present in various environments. Appl. Microbiol. 29:265–268. [DOI] [PMC free article] [PubMed] [Google Scholar]
- 23.Mitcham, R. P., M. W. Shelley, and C. M. Wheadon. 1983. Free chlorine versus ammonia-chlorine: disinfection, trihalomethane formation, and zooplankton removal. J. Am. Water Works Assoc. 75:196–198. [Google Scholar]
- 24.Mobarry, B. K., M. Wagner, V. Urbain, B. E. Rittmann, and D. A. Stahl. 1996. Phylogenetic probes for analyzing abundance and spatial organization of nitrifying bacteria. Appl. Environ. Microbiol. 62:2156–2162. (Erratum,63:815, 1997.) [DOI] [PMC free article] [PubMed] [Google Scholar]
- 25.Norman, T. S., L. L. Harms, and R. W. Looyenga. 1980. The use of chloramines to prevent trihalomethane formation. J. Am. Water Works Assoc. 72:176–180. [Google Scholar]
- 26.Odell, L. H., G. J. Kirmeyer, A. Wilczak, J. G. Jancangelo, J. P. Marcinko, and R. L. Wolfe. 1996. Controlling nitrification in chloraminated systems. J. Am. Water Works Assoc. 88:86–98. [Google Scholar]
- 27.Okabe, S., and Y. Watanabe. 2000. Structure and Function of Nitrifying Biofilms as Determined by In Situ Hybridization and the Use of Microelectrodes. Water Sci. Technol. 42:21–32. [PubMed] [Google Scholar]
- 28.Painter, H. A. 1970. A review of literature on inorganic nitrogen metabolism in microorganisms. Water Res. 4:393–450. [Google Scholar]
- 29.Pan, P., and W. W. Umbreit. 1972. Growth of mixed cultures of autotrophic and heterotrophic organisms. Can. J. Microbiol. 18:153–156. [DOI] [PubMed] [Google Scholar]
- 30.Park, H.-D., J. M. Regan, and D. R. Noguera. 2001. Molecular analysis of ammonia-oxidizing bacterial populations in aerated-anoxic orbal processes, p.202–209.In V. Tandoi, R. Passino, and C. M. Blundo (ed.), Microorganisms in activated sludge and biofilm processes . Proceedings of the 3rd International Water Association Conference. International Water Association, London, England. [PubMed]
- 31.Purkhold, U., A. Pommerening-Röser, S. Juretschko, M. C. Schmid, H.-P. Koops, and M. Wagner. 2000. Phylogeny of all recognized species of ammonia oxidizers based on comparative 16S rRNA and amoA sequence analysis: implications for molecular diversity studies. Appl. Environ. Microbiol. 66:5368–5382. [DOI] [PMC free article] [PubMed] [Google Scholar]
- 32.Rittmann, B. E., J. M. Regan, and D. A. Stahl. 1994. Nitrification as a source of soluble organic substrate in biological treatment. Water Sci. Technol. 30:1–8. [Google Scholar]
- 33.Rotthauwe, J.-H., K.-P. Witzel, and W. Liesack. 1997. The ammonia monooxygenase structural gene amoA as a functional marker: molecular fine-scale analysis of natural ammonia-oxidizing populations. Appl. Environ. Microbiol. 63:4704–4712. [DOI] [PMC free article] [PubMed] [Google Scholar]
- 34.Schramm, A., D. de Beer, J. C. van den Heuvel, S. Ottengraf, and R. Amann. 1999. Microscale distribution of populations and activities of Nitrosospira and Nitrospira spp. along a macroscale gradient in a nitrifying bioreactor: quantification by in situ hybridization and the use of microsensors. Appl. Environ. Microbiol. 65:3690–3696. [DOI] [PMC free article] [PubMed] [Google Scholar]
- 35.Schramm, A., D. de Beer, M. Wagner, and R. Amann. 1998. Identification and activities in situ of Nitrosospira and Nitrospira spp. as dominant populations in a nitrifying fluidized bed reactor. Appl. Environ. Microbiol. 64:3480–3485. [DOI] [PMC free article] [PubMed] [Google Scholar]
- 36.Skadsen, J. 1993. Nitrification in a distribution system. J. Am. Water Works Assoc. 85:95–103. [Google Scholar]
- 37.Soriano, S., and N. Walker. 1968. Isolation of ammonia-oxidizing autotrophic bacteria. J. Appl. Bacteriol. 31:493–497. [DOI] [PubMed] [Google Scholar]
- 38.Speksnijder, A. G. C. L., G. A. Kowalchuk, K. Roest, and H. J. Laanbroek. 1998. Recovery of a Nitrosomonas-like 16S rDNA sequence group from freshwater habitats. Syst. Appl. Microbiol. 21:321–330. [DOI] [PubMed] [Google Scholar]
- 39.Stehr, G., B. Böttcher, P. Dittberner, G. Rath, and H.-P. Koops. 1995. The ammonia-oxidizing nitrifying population of the River Elbe estuary. FEMS Microbiol. Ecol. 17:177–186. [Google Scholar]
- 40.Stephen, J. R., G. A. Kowalchuk, M.-A. V. Bruns, A. E. McCaig, C. J. Phillips, T. M. Embley, and J. I. Prosser. 1998. Analysis ofβ-subgroup proteobacterial ammonia oxidizer populations in soil by denaturing gradient gel electrophoresis analysis and hierarchical phylogenetic probing. Appl. Environ. Microbiol. 64:2958–2965. [DOI] [PMC free article] [PubMed] [Google Scholar]
- 41.Suwa, Y., T. Sumino, and K. Noto. 1997. Phylogenetic relationships of activated sludge isolates of ammonia oxidizers with different sensitivities to ammonium sulfate. J. Gen. Appl. Microbiol. 43:373–379. [DOI] [PubMed] [Google Scholar]
- 42.Teske, A., E. Alm, J. M. Regan, S. Toze, B. E. Rittmann, and D. A. Stahl. 1994. Evolutionary relationships among ammonia- and nitrite-oxidizing bacteria. J. Bacteriol. 176:6623–6630. [DOI] [PMC free article] [PubMed] [Google Scholar]
- 43.Thompson, J. D., T. J. Gibson, F. Plewniak, F. Jeanmougin, and D. G. Higgins. 1997. The CLUSTAL_X windows interface: flexible strategies for multiple sequence alignment aided by quality analysis tools. Nucleic Acids Res. 24:4876–4882. [DOI] [PMC free article] [PubMed] [Google Scholar]
- 44.Utåker, J. B., and I. F. Nes. 1998. A qualitative evaluation of the published oligonucleotides specific for the 16S rRNA gene sequences of the ammonia-oxidizing bacteria. Syst. Appl. Microbiol. 21:72–88. [DOI] [PubMed] [Google Scholar]
- 45.Valentine, R. L. 1985. Disappearance of monochloramine in the presence of nitrite. In R. L. Jolley (ed.), Water chlorination: chemistry, environmental impact and health effects, vol. 5. Lewis Publishers, Chelsea, Mich.
- 46.Wagner, M., G. Rath, H.-P. Koops, J. Flood, and R. Amann. 1996. In situ analysis of nitrifying bacteria in sewage treatment plants. Water Sci. Technol. 34:237–244. [Google Scholar]
- 47.Whitby, C. B., J. R. Saunders, J. Rodriguez, R. W. Pickup, and A. McCarthy. 1999. Phylogenetic differentiation of two closely related Nitrosomonas spp. that inhabit different sediment environments in an oligotrophic freshwater lake. Appl. Environ. Microbiol. 65:4855–4862. [DOI] [PMC free article] [PubMed] [Google Scholar]
- 48.Wilczak, A., J. G. Jacangelo, J. P. Marcinko, L. H. Odell, G. J. Kirmeyer, and R. L. Wolfe. 1996. Occurrence of nitrification in chloraminated distribution systems. J. Am. Water Works Assoc. 88:74–85. [Google Scholar]
- 49.Wolfe, R. L., I. E. G. Means, M. K. Davis, and S. E. Barrett. 1988. Biological nitrification in covered reservoirs containing chloraminated water. J. Am. Water Works Assoc. 80:109–114. [Google Scholar]
- 50.Wolfe, R. L., N. I. Lieu, G. Izaguirre, and E. G. Means. 1990. Ammonia-oxidizing bacteria in a chloraminated distribution system: seasonal occurrence, distribution, and disinfection resistance. Appl. Environ. Microbiol. 56:451–462. [DOI] [PMC free article] [PubMed] [Google Scholar]
- 51.Yoshioka, T., H. Terai, and Y. Saijo. 1982. Growth kinetic studies of nitrifying bacteria by the immunofluorescent counting method. J. Gen. Appl. Microbiol. 28:169–180. [Google Scholar]


