Abstract
The recently described respiratory strain Saccharomyces cerevisiae KOY.TM6*P is, to our knowledge, the only reported strain of S. cerevisiae which completely redirects the flux of glucose from ethanol fermentation to respiration, even at high external glucose concentrations (27). In the KOY.TM6*P strain, portions of the genes encoding the predominant hexose transporter proteins, Hxt1 and Hxt7, were fused within the regions encoding transmembrane (TM) domain 6. The resulting chimeric gene, TM6*, encoded a chimera composed of the amino-terminal half of Hxt1 and the carboxy-terminal half of Hxt7. It was subsequently integrated into the genome of an hxt null strain. In this study, we have demonstrated the transferability of this respiratory phenotype to the V5 hxt1-7Δ strain, a derivative of a strain used in enology. We also show by using this mutant that it is not necessary to transform a complete hxt null strain with the TM6* construct to obtain a non-ethanol-producing phenotype. The resulting V5.TM6*P strain, obtained by transformation of the V5 hxt1-7Δ strain with the TM6* chimeric gene, produced only minor amounts of ethanol when cultured on external glucose concentrations as high as 5%. Despite the fact that glucose flux was reduced to 30% in the V5.TM6*P strain compared with that of its parental strain, the V5.TM6*P strain produced biomass at a specific rate as high as 85% that of the V5 wild-type strain. Even more relevant for the potential use of such a strain for the production of heterologous proteins and also of low-alcohol beverages is the observation that the biomass yield increased 50% with the mutant compared to its parental strain.
We recently described the respiratory strain Saccharomyces cerevisiae KOY.TM6*P, which switches to fermentation only when oxygen is removed (27). In fact, the prototrophic KOY.TM6*P strain maintains a complete respiratory metabolism during growth at external glucose concentrations as high as 20 g/liter. This is in remarkable contrast to the respirofermentative catabolism employed by typical strains of S. cerevisiae under comparable conditions (10, 40). At high external glucose concentrations, the yeast S. cerevisiae typically and predominantly ferments glucose to ethanol, irrespective of the presence of oxygen. In contrast, at low external glucose concentrations, such as in a glucose-limited chemostat, the yeast relies on respiratory catabolism (30). The importance of the external glucose concentration suggests a significant role for yeast's glucose transporters in ethanol production.
In S. cerevisiae, glucose is transported via facilitated diffusion by members of the hexose transporter family (17). The 20 members of this family include HXT1-HXT17, GAL2, SNF3, and RGT2 (3, 16, 28, 32, 33, 41). The hexose transporters are part of the major facilitator superfamily (20, 29), where they form a subfamily, and are all predicted to have 12 transmembrane domains (16). The transporters Hxt1-4 plus Hxt6 and Hxt7 are the major transport proteins mediating the transport of glucose, fructose, and mannose (3, 7, 16, 28, 33). However, in addition, Hxt5, Hxt8-11p, Hxt13-17p, Gal2p, and the maltose transporters Agt1, Ydl247w, and Yjr160c are all able to transport glucose and can, when ectopically overproduced, individually support growth in a strain lacking all other transporters (41).
In another recent report (8), we presented a series of strains expressing functional chimeras composed to different degrees of the low-affinity (Km, 100 mM) and high-affinity (Km, 1 to 2 mM) transporters Hxt1 and Hxt7, respectively (28); one of the strains was KOY.TM6*P (27). Sugar uptake analysis data showed that the Tm6* protein in the KOY.TM6*P strain proved to be a high-affinity hexose transporter (27). Altogether, the strains displayed a range of different glycolytic rates, resulting in ethanol production rates that changed in direct proportion to changes in the glycolytic flux. In contrast to the S. cerevisiae wild-type strain, in which glucose uptake capacity was shown not to control the glycolytic flux during exponential batch growth at high levels of glucose, the high-affinity chimeric hexose transporters in the transformed strains controlled the rate of glycolysis to a high degree (8).
To generate KOY.TM6*P, the HXT1 and HXT7 genes were fused within the regions encoding transmembrane (TM) domain 6 such that the chimeric gene, TM6*, encoded a chimera composed of the amino-terminal half of Hxt1 and the carboxy-terminal half of Hxt7. The TM6* construct was integrated into the genome of the hxt null strain KOY.VW100P (8, 27). This null strain lacks all known hexose transporters, such that glucose consumption and transport activity are completely abolished (41). Expression of the chimeric gene was under the control of the truncated, strong, constitutive HXT7 promoter (12). Since this is, to our knowledge, the only reported strain of S. cerevisiae that completely redirects the flux of glucose from ethanol fermentation to respiration, the obvious subsequent experiment was to test whether the characteristics of the KOY.TM6*P strain could be transferred to other S. cerevisiae strains. It was of particular interest to find out whether the non-ethanol-producing phenotype is transferable to strains that are useful for large-scale heterologous protein production as well as for potential use in the production of low-alcohol beverages. For practical reasons, it was also important to learn whether the characteristics of KOY.TM6*P can only be transferred to a complete hxt null strain or if deletion of just the most important hexose transporter genes (HXT1-7) would serve as a suitable background for the non-ethanol-producing phenotype. In fact, strains where only the HXT1-HXT7 genes have been deleted do not grow on glucose, and both glucose flux and uptake have been reported to be below the limits of detection (19, 33). Since the haploid enological V5 strain has been extensively used in studies of wine production, we decided to integrate the TM6* gene into the hxt1-hxt7 deletion mutant of this strain, which we subsequently denoted V5.TM6*P.
In this study, the V5.TM6*P strain has been physiologically characterized in comparison with the KOY.TM6*P strain. Different sugar concentrations (2% and 5%) were used to culture the strains, with both glucose and fructose being used as the sole carbon and energy sources. Since glucose repression has been suggested to be initiated via components of the upper part of glycolysis, levels of glycolytic proteins and upper-part glycolytic metabolites were studied during batch cultivations in well-controlled bioreactors.
MATERIALS AND METHODS
Yeast strains.
The auxotrophic wine yeast strain V5 (MATa ura3gal) and the V5 hxt1-hxt7Δ mutant strain (MATa ura3 gal hxt514Δ::loxP hxt367Δ::lox P hxt2Δ::loxP) were kindly provided by the Blondin laboratory (19). The expression cassette in the KOY.TM6*P strain was transferred into the genome of the V5 hxt1-hxt7Δ strain by using the primers PROHXT3 (TCAAATGGCGGTGTAGTTTGAAAAG) and TERHXT7 (TTAAGTGACGGGCGATGAGTAAGAA). Transformants were selected by growth on glucose. The resulting ura3 strain is referred to as V5.TM6*.
The auxotrophic V5 wild type and V5.TM6* were made prototrophic by integration of URA3 (41) and are referred to as the V5 wild-type strain and V5.TM6*P, respectively. For comparable reasons, the KOY.PK2-1C83 strain (MATa MAL2-8c SUC2), which is referred to as the KOY wild-type strain (27), and the KOY.TM6*P (KOY.VW100P; integration cassette, HXT7prom-TM6*-HXT7term ura3-52::URA3) mutant strain, in which the TM6* gene has been integrated (27), have been used where stated.
Growth conditions.
Unless otherwise specified, the cultivation procedure was performed as follows. For both precultures and main cultures, 5× defined minimal medium (39), with 5% glucose as the sole carbon and energy source, was used. A two-step precultivation on a rotary shaker was undertaken. First, a 10-ml culture was grown for 72 h and used to inoculate 100 ml of medium, which was inoculated after 30 h at 30°C to give a final optical density at 610 nm of 0.05 in a bioreactor (BRO2; Belach Bioteknik AB, Sweden) in a volume of 2.5 liters. Polypropylene glycol P2000 was added as an antifoam agent (100 μl/liter). The cultivation conditions were 30°C at 1,000 rpm and pH 5.0, with airflow of 1.25 liter/min. Gas evolution was monitored online (type CP460 O2/CO2; Belach Bioteknik AB). Cultivations were at least duplicated.
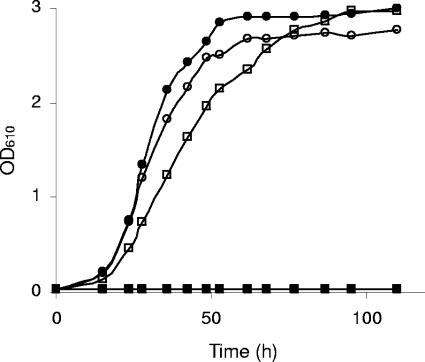
Alternatives to the described cultivation procedure were used as indicated in the text. Since the initial experiments, presented in Fig. 1 and 2, were performed with auxotrophic V5 strains, the media were supplemented with 120 mg uracil/liter. The growth curves presented in Fig. 1 and 3 were attained from aerobic batch experiments in 1-liter Erlenmeyer flasks containing 100 ml 2× defined minimal medium (39), with urea as the nitrogen source, instead of ammonium sulfate, in order to maintain the medium pH when the pH was not externally controlled. Two percent glucose, maltose, or fructose was added as the sole carbon source (in precultures, 2% maltose was used [Fig. 1 and 2]), or 2% glucose or fructose, as in the main fermentor cultures (Fig. 3), was used. The data presented in Fig. 2 were derived from aerobic batch experiments in high-performance bioreactors (as described above) with 2× defined minimal medium (39) and 2% glucose as the sole carbon and energy source.
FIG. 1.
Aerobic batch growth of the auxotrophic V5 hxt1-7Δ (filled symbols) and V5.TM6* (open symbols) strains on 2% maltose (circles) or glucose (squares) as the sole carbon and energy source. OD610, optical density at 610 nm.
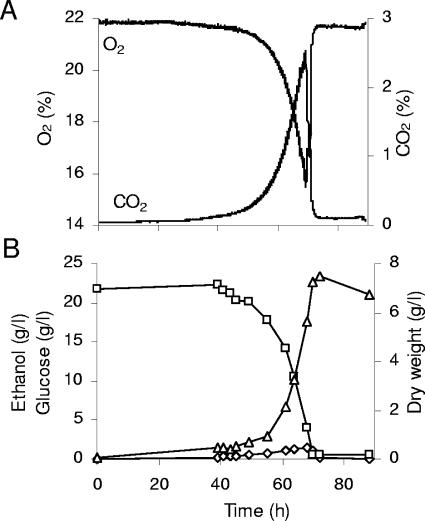
FIG. 2.
Aerobic batch growth of the auxotrophic V5.TM6* strain on 2% glucose as the sole carbon and energy source. (A) Carbon dioxide and oxygen content in the off-gas. (B) Dry weight (triangles) and glucose (squares) and ethanol (diamonds) concentrations in the medium.
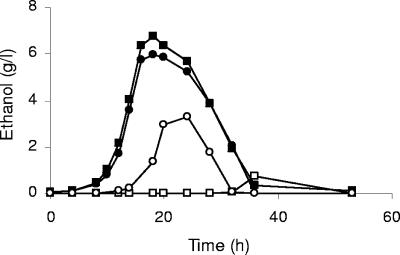
FIG. 3.
Ethanol production during growth of the prototrophic KOY wild-type (filled symbols) and KOY.TM6*P (open symbols) strains on 2% glucose (squares) or 2% fructose (circles) as the sole carbon and energy source.
Biomass determination.
For dry weight determination, duplicate samples of 5 ml each were collected by centrifugation in preweighed tubes at 2,600 × g for 5 min, washed twice in cold MilliQ water, dried for 24 h at 110°C, and desiccated before being weighed.
The optical density of the cultures was measured at 610 nm after appropriate dilution.
Extracellular substrate and products.
Duplicate samples of 1 ml each were collected by centrifugation for 60 s at 13,000 × g. The glucose, ethanol, glycerol, and acetate concentrations in the growth medium were determined in the culture supernatants using enzymatic combination kits (Food Diagnostics, Stenungsund, Sweden).
Consumption and production rates.
The glucose consumption and ethanol production rates were calculated using samples harvested from the logarithmic growth phase at glucose concentrations above 10 g/liter and in intervals during which maximal rates were attained. Mean values of dry weight in the specified intervals were used in rate calculations.
Intracellular metabolites.
Samples (duplicates of 15 ml each) were quenched with 60% methanol (−40°C) when the glucose concentration was about 10 to 35 g/liter for analysis of glucose-6-phosphate and fructose-1,6-bisphosphate. The samples were extracted with trichloroacetic acid as previously described (11), except that 1.5 ml 0.25 M trichloroacetic acid was added to the pellet. Samples were analyzed using NAD(P)H-coupled enzymatic reactions. For ATP analysis, duplicate samples (1 ml each) were directly extracted with trichloroacetic acid (11). The ATP content was measured with an ATP bioluminescence kit (Roche Diagnostics, Mannheim, Germany) on a luminometer (Packard Picolite).
2D-PAGE analysis.
For the prototrophic V5 wild-type and V5.TM6*P strains, two-dimensional polyacrylamide gel electrophoresis (2D-PAGE) analysis was performed as described earlier (26), except that 12.5% acrylamide was used in the second dimension. Proteins were visualized by silver staining as described previously (22).
RESULTS
TM6* encodes a functional hexose transporter when expressed in the V5 hxt1-7Δ enological strain.
Figure 1 illustrates that the V5 hxt1-7Δ strain, which is devoid of the most important hexose transporters for glucose, cannot grow on glucose as the sole carbon and energy source. However, while the V5 hxt1-7Δ strain and the V5.TM6* strain grew equally well on maltose, the V5.TM6* strain also grew on glucose, although at a lower rate than on maltose. Consequently, the Tm6* chimeric protein was able to transport glucose in the transformed V5.TM6* strain.
The low-ethanol phenotype can be transferred to the V5 hxt1-7Δ enological yeast strain.
The physiology of the S. cerevisiae V5.TM6* strain was characterized in a high-performance aerobic bioreactor using 2% glucose as the sole carbon and energy source. The gas profiles (Fig. 2A) were very similar to those recently reported for the KOY.TM6*P strain, indicating only one phase of growth (27). The uniphasic growth behavior was confirmed by measurements of biomass production, glucose consumption, and ethanol formation (Fig. 2B). The subsequent consumption of the small amounts of ethanol produced did not result in a biphasic growth pattern with a diauxic shift from respirofermentative to respiratory growth, as is typical for wild-type strains of S. cerevisiae (10, 40).
Growth of the V5.TM6*P and KOY.TM6*P strains on fructose results in increased ethanol production compared to growth on glucose.
Since fructose is transported into the cells by the same hexose transporters as glucose, we decided to examine whether the V5.TM6*P and KOY.TM6*P strains produced any ethanol during growth on fructose as the sole carbon and energy source. This is particularly interesting since fructose is a commonly used sugar in industrial fermentations. In Fig. 3, data for the KOY strains are presented. Surprisingly, although the KOY wild type produced equal amounts of ethanol on both glucose and fructose, the KOY.TM6*P strain produced substantially more ethanol (ca. 0.2 g/g) on fructose than on glucose (ca. 0.04 g/g). Similar results were obtained when comparing the growth on glucose and fructose of the V5 strains (data not shown).
Growth of the V5.TM6*P strain on glucose concentrations as high as 5% did not increase the ethanol yield compared to growth on 2% glucose.
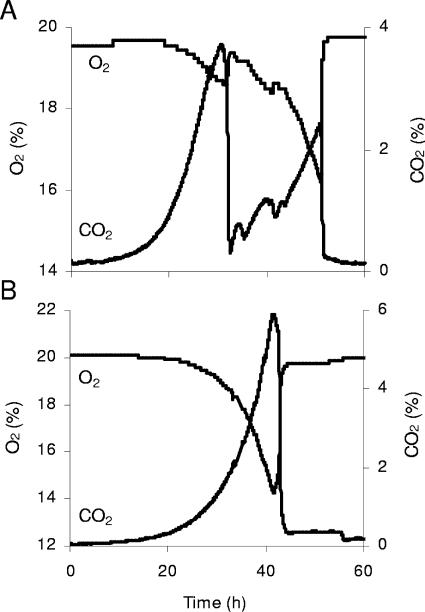
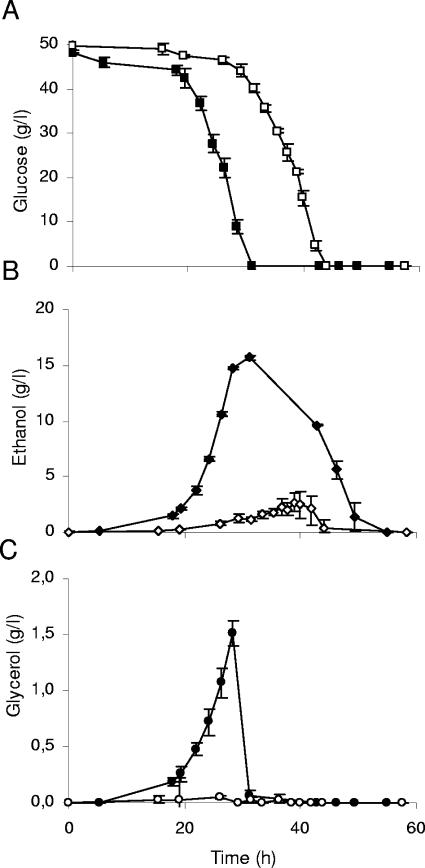
Since glucose concentrations higher than 2% are relevant for the industrial-scale growth of yeast cultures, growth of the prototrophic V5 wild-type and V5.TM6*P strains was studied at external glucose concentrations as high as 5%. The typical diauxic growth behavior of the V5 wild-type strain is demonstrated in Fig. 4A. In the exponential growth phase, glucose, in addition to being converted to biomass, was primarily metabolized to ethanol and CO2, as expected (Fig. 4A and 5A and B). The depletion of glucose coincided with a sudden drop in CO2 production and O2 consumption. Subsequent to glucose depletion, the ethanol produced was consumed after adaptation to respiratory growth.
FIG. 4.
Carbon dioxide production and oxygen consumption during aerobic batch growth on 5% glucose of the prototrophic V5 wild-type (A) and V5.TM6*P (B) strains.
FIG. 5.
(A) Glucose consumption, together with ethanol (B) and glycerol (C) concentrations in the medium, of the prototrophic V5 wild-type (filled symbols) and V5.TM6*P (open symbols) strains during aerobic batch growth on 5% glucose as the sole carbon and energy source. The error bars denote maximum and minimum data for both the V5 wild type (n = 2) and V5.TM6*P (n = 2 to 4).
Replacement of the HXT1-7genes by the TM6* gene altered the growth characteristics dramatically, as illustrated for growth on 2% glucose as well as on higher glucose concentrations. At 5% external glucose, the metabolism was characterized by an almost purely respiratory catabolism resulting in glucose being converted to biomass, CO2, and water by respiration. This growth behavior resulted in only one growth phase, and no diauxic shift was visible (Fig. 4B). Only small amounts of ethanol were produced (Fig. 5B). For the wild type, the ethanol yield was similar to that obtained during growth on 2% external glucose, i.e., a yield of 0.33 g/g was attained, while that of the V5.TM6*P strain on 5% glucose was still only 0.05 g/g. This demonstrates that the low-ethanol-producing metabolism at high external glucose concentrations reported earlier (27) for an S. cerevisiae laboratory strain (KOY.TM6*P) is transferable to other strains, in this case, a wine yeast. Furthermore, the characteristics of the strain seem not to be dependent on the external glucose concentration, since the ethanol yield was about equal on both 2% and 5% glucose, and in both cases only small amounts were produced.
Low-ethanol-producing strains produce negligible amounts of by-products.
The V5.TM6*P strain, like the KOY.TM6*P strain (27), was also shown to produce considerably smaller amounts of by-products than its corresponding wild type. In particular, the production of the dominating by-product, glycerol, was negligible (Fig. 5C). Furthermore, acetate was produced during growth of the V5.TM6* strain at levels that were at least 50% lower than that of the V5 wild type (0.01 g/g, at most), while 0.02 g/g of glucose could be obtained after glucose depletion, probably as a consequence of oxidation of the small amounts of ethanol produced and subsequently consumed. In comparison, the KOY.TM6*P strain and its corresponding wild type produced acetate in yields of, at most, 0.01 g/g of glucose consumed.
The low-ethanol-producing phenotype (V5.TM6*P) is characterized by a reduced glycolytic rate but an increased completed substrate turnover rate compared to those of the wild type.
The maximum glucose consumption rate was reduced threefold in the V5.TM6*P strain compared to the rate of its prototrophic V5 wild type, with rates of 2.7 ± 0.3 and 9.0 ± 0.7 mmol glucose (g dry weight)−1 h−1, respectively. The ethanol production rate of the wild type during the log phase was 13.9 ± 1.8 mmol ethanol (g dry weight)−1 h−1, while that of the V5.TM6*P strain was only 0.4 ± 0.3 mmol ethanol (g dry weight)−1 h−1. This means that while the glucose consumption rate of the mutant was 30% that of the wild type, an ethanol production rate as low as 3% persisted in the mutant strain compared to that of the wild type. However, the V5.TM6*P strain depleted the supplied carbon and energy source at least as quickly as the corresponding wild type on 5% glucose (Fig. 5A and B and Fig. 6), provided that both glucose and the subsequently used ethanol are taken into account for the wild type.
FIG. 6.
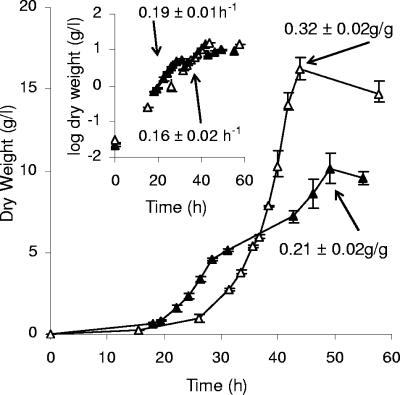
Aerobic batch growth of the prototrophic V5 wild-type (filled triangles) and V5.TM6*P (open triangles) strains on 5% glucose as the sole carbon and energy source. Data on growth yields are given in g biomass produced/g glucose consumed; for the V5 strain, the growth yield was calculated for completed growth (50 h) on both glucose and ethanol. Inset, semilog plot. Data on specific growth rates (h−1) during growth on glucose are given. The error bars denote maximum and minimum data for both the V5 wild type (n = 2) and V5.TM6*P (n = 2 to 4).
Another interesting feature seen by comparing Fig. 5A and B is that the ethanol produced by the V5.TM6*P strain was coconsumed with glucose during the exponential growth phase on glucose. The ethanol consumption started when there were still substantial amounts of glucose left in the medium.
The specific growth rate is lower and the growth yield is higher for the low-ethanol-producing V5.TM6*P strain than for the V5 wild type.
The substantially lower glycolytic rate, as judged by the glucose consumption rate, of the V5.TM6*P strain correlates with a lower specific growth rate (Fig. 6, inset) than that of the prototrophic V5 wild type. However, the maximal specific growth rate of the mutant was as high as 85% that of the wild type. In comparison with the wild-type strain, the biomass yield increased 50% in the mutant strain (Fig. 6). By extrapolating the regression line from which the specific growth rates were determined in the inset in Fig. 6, it can be seen that the lag phase for both strains is very short, at most up to a couple of hours.
Protein patterns in high- and low-ethanol-producing strains do not differ substantially.
The protein content of strains was analyzed by 2D-PAGE analysis. The V5.TM6*P strain was compared with the V5 wild-type strain. The overall protein patterns did not differ substantially between the V5 wild-type and the V5.TM6*P mutant strains, especially with regard to glycolytic proteins. Despite the low glucose flux capacity of the V5.TM6*P strain, it showed protein patterns typical of cells grown on glucose which could be clearly seen when compared to cells grown on ethanol (data not shown).
The levels of upper-part glycolytic intermediates and the adenine nucleotide ATP are different in the V5.TM6*P strain than in the V5 wild-type strain.
The V5.TM6*P strain differs from its wild type in that the mutant has an almost completely respiratory metabolism at high external sugar concentrations.
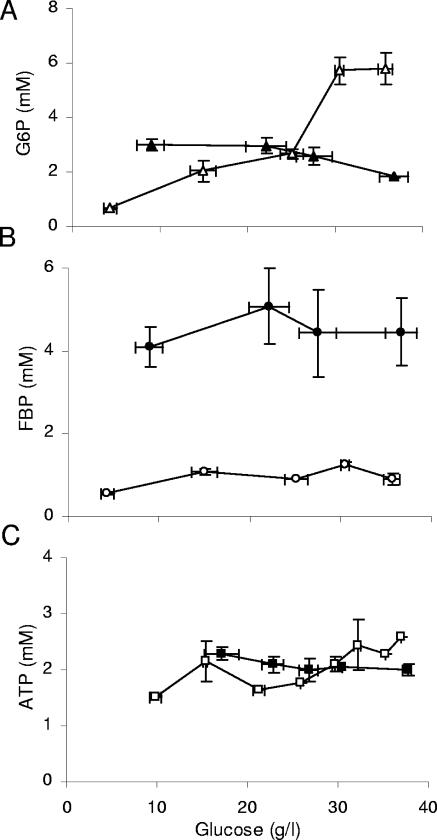
The most striking result in terms of intracellular metabolites was that there was a dramatic difference in intracellular fructose-bis-phosphate (FBP) content between the V5 wild type and V5.TM6*P (Fig. 7). The FBP concentrations in the mutant strain were below 1 mM, while the corresponding levels in the wild type were 4 to 5 mM. ATP concentrations, on the other hand, did not differ significantly between the two strains (Fig. 7). The mutant showed a tendency toward higher ATP levels at high external glucose concentrations and lower levels at low external glucose concentrations than those of the wild type. A similar but even more pronounced pattern was observed for intracellular glucose-6-phosphate (G6P) concentrations. At high external glucose concentrations, elevated levels of G6P were observed in V5.TM6*P compared to those in the wild type (Fig. 7). However, when glucose was consumed, there was a drastic decrease in G6P concentration in the mutant, and values lower than those in the wild type were recorded.
FIG. 7.
Intracellular concentrations of glucose-6-phosphate (A), fructose-bis-phosphate (B), and ATP (C) for the prototrophic V5 wild-type (filled symbols) and V5.TM6*P (open symbols) strains during aerobic batch growth on 5% glucose as the sole carbon and energy source. The error bars denote maximum and minimum data for both the V5 wild type (n = 2) and V5.TM6*P (n = 2).
DISCUSSION
The first question we asked in this study was whether the recently reported respiratory phenotype of engineered S. cerevisiae (27) could be transferred to other strains of this yeast, and the answer is clearly yes. We chose to study the transferability of the respiratory phenotype to a mutant strain lacking HXT1-7 derived from the enological strain V5, which was obtained by sporulation of an industrial wine yeast strain (19). Many laboratory strains perform poorly under enological conditions and cannot, as discussed by Luyten et al. (19), completely consume the sugars present in grape must. In contrast, the V5 strain performs well under such conditions, which are characterized by the occurrence of a large range of sugar concentrations.
It is of industrial relevance to test if it is possible to transfer the TM6* construct to a genetically simpler mutant background than a complete hexose transporter null strain. Since deletion of the genes HXT1-HXT7 has been reported to abolish hexose transport in laboratory yeast strains (33) and more recently also in the enological V5 strain (19), this background was chosen. After transformation of the TM6* chimeric gene to the V5 hxt1-7Δ strain, the resulting V5.TM6*P strain grew well on glucose as the sole carbon and energy source.
The respiratory phenotype of the V5.TM6*P strain was clearly demonstrated by the occurrence of only one growth phase during batch cultivations in defined minimal medium with glucose as the sole carbon and energy source. The ethanol yield did not increase with increasing external glucose concentrations; instead, it was independent of the external glucose concentration, as illustrated by comparing growth on 2%, 5%, and 10% (data not shown) glucose. As for the KOY.TM6*P strain, only negligible amounts of by-products other than ethanol were produced.
Despite the fact that the glucose flux was reduced to 30% that of its parental strain, which is also in accordance with the relationship between KOY.TM6*P and its parental strain (27), the V5.TM6*P strain completed its growth cycle at least as rapidly as the wild-type strain. In other words, the TM6* strain consumed the external carbon supply (glucose) as fast as the wild-type strain (taking both glucose and ethanol into account). What may be even more interesting to potential industrial users is that the V5.TM6*P strain produced biomass at a specific rate as high as 85% that of the V5 wild-type strain, and the log phase was equally short for the two strains. Even more relevant is that the biomass yield was increased by 50% in the mutant compared to its parental strain (Fig. 6). Biomass formation rather than the formation of by-products like ethanol, glycerol, and acetate is considered a necessity for efficient heterologous protein production.
Depending on the kind of industrial process to be employed, different substrates will be used, including molasses, in which the major sugar component is sucrose and which gives rise to both glucose and fructose after hydrolysis. It was therefore relevant to test the respiratory phenotype on fructose, particularly since the same hexose transporters are used for both glucose and fructose (32, 33). Growth of both mutants, V5.TM6*P and KOY.TM6*P, gave rise to higher ethanol yields on fructose than on glucose. About a fourfold increase in ethanol yield was obtained on fructose (Fig. 3 and data not shown), while both wild-type strains produced equal amounts of ethanol on fructose and glucose. However, the mutants still produced only 50% of the ethanol produced by the corresponding wild types. The difference in ethanol yield between glucose and fructose for the TM6* strains may be explained by different uptake kinetics for the two sugars. This has previously been seen during studies of native Hxts (32, 33). However, fructose also causes a different degree of catabolite repression. The likely reason is Hxk1, whose expression is repressed by glucose but which is more a fructo- than a glucokinase (6, 14). This opens possibilities to further reduce ethanol production on fructose as the carbon and energy source if this would be industrially advantageous.
Although the reduced glucose uptake capacity of the TM6* strains is a strong candidate for the low-ethanol-producing phenotype (8, 27), this may not be the sole mechanism. An increased respiratory capacity, as shown for the KOY.TM6*P strain compared to its wild type, may additionally amplify the phenotype (27). The respiratory capacity may be further increased during conditions of coexistence of glucose and ethanol. For example, different respiratory rates were reported for a hexokinase mutant, the hxk2Δ mutant, with by far the highest rate on a mixture of glucose and ethanol, in line with data reported from Rigoulet's laboratory (1, 31). The hxk2Δ mutant was also argued to coconsume glucose and ethanol, a feature which in the present study is clearly illustrated for the V5.TM6*P strain and was also recently shown for the KOY.TM6* strain (9, 27). Since the ethanol yield is equal on 2% and 5% external glucose, larger absolute ethanol amounts result when the external glucose supply is increased. This means that coconsumption with glucose of the small amounts of ethanol produced is clearly visible with 5% glucose (Fig. 5A and B), in contrast to the case with 2% glucose. The regulatory mechanism for the coconsumption of glucose and ethanol with a simultaneous increased respiratory rate may have been developed during evolution under conditions when external sugar concentrations became low while ethanol was simultaneously accumulated.
The KOY.TM6*P strain has been shown by expression analysis at the mRNA level not to exert a completely glucose derepressed phenotype during growth on glucose (9, 27). The observation that the TM6* strains maintain characteristics typical of glucose-grown S. cerevisiae cells was also strengthened in this study by 2D-PAGE analysis. Attempts to correlate glycolytic flux with levels of enzymes during different physiological conditions have generally failed (5, 12, 13, 18, 24, 25, 36-38). In this study, we also did not find evidence for altered protein levels controlling the glycolytic flux, with the obvious exception of the hexose transport machinery.
In spite of many years of research, the initial signal for glucose repression remains to be deduced. We believe that the TM6* strains, together with other strains with different hexose transport capacities (8), will be valuable tools in this search. The respiratory phenotypes of the TM6* strains in this study, together with the high respiratory capacity and considerably less glucose repression of the KOY.TM6*P strain (9, 27) with high external glucose, indicate that external glucose is not the initial signal for the different targets of glucose repression, in line with data from other laboratories (32, 43). Although published data are often conflicting, some potential candidates for the initial glucose repression signal are intracellular glucose, the ATP/AMP ratio (42), hexokinase 2 (different roles have been suggested [6, 14, 34, 35]), intracellular (glycolytic) metabolite concentrations (2, 4), and (indirectly) the glycolytic rate (32, 34, 43). However, the rate per se cannot possibly be the initial glucose repression signal. Instead, the glycolytic rate may be responsible for signaling via some protein modification(s) or low-molecular-weight metabolites. In all this, the activity of the hexokinase reaction seems to play a central role in mediating glucose repression by both the short-term (minutes) response via any of the hexokinases and the long-term (hours) response via Hxk2 (6). Since glucose repression seems to correlate with the activity of the hexokinase reaction, it seemed logical to analyze metabolites such as glucose (not performed in this study), G6P, and ATP. However, no significant differences in ATP concentrations were observed between V5.TM6*P and the V5 wild type. G6P concentrations in the mutant varied from about 6 mM down to levels below 1 mM, while the corresponding values in the wild type were more stable and ranged from 2 to 3 mM. It is therefore difficult to imagine that any of these metabolites are the sole triggering agents for glucose repression. The large variability in G6P concentration observed for the mutant might seem strange, but it should be noted that the lowest concentrations were recorded during a phase of simultaneous consumption of glucose as well as ethanol. Most probably, the main control of the glycolytic rate in the mutant strain(s) is exerted by the sugar uptake system (8), but other control mechanisms may be operative as well. For instance, the low concentration of FBP may contribute, since this is a known allosteric activator of the pyruvate kinase reaction (15, 21, 23). However, the identity of the initial glucose repression signal(s) will be further elucidated by the use of the TM6* strains and other strains covering a range of glycolytic rates at high external sugar concentrations (8).
Acknowledgments
We gratefully acknowledge Arle Kruckeberg and Eckhard Boles for valuable discussions. The V5 hxt1-7Δ strain was kindly provided to us by the Blondin laboratory (19).
Financial support from Gothia Yeast Solutions AB is greatly acknowledged. This work was also supported by grants from the Swedish Research Council (621-2001-1988) to L.G. S.H. holds a research position from the Swedish Research Council. R.M.B. acknowledges support from the European Commission via contract LSHG-CT-2004-504601.
REFERENCES
- 1.Beauvoit, B., M. Rigoulet, O. Bunoust, G. Raffard, P. Canioni, and B. Guerin. 1993. Interactions between glucose metabolism and oxidative phosphorylations on respiratory-competent Saccharomyces cerevisiae cells. Eur. J. Biochem. 214:163-172. [DOI] [PubMed] [Google Scholar]
- 2.Boles, E., J. Heinisch, and F. K. Zimmermann. 1993. Different signals control the activation of glycolysis in the yeast Saccharomyces cerevisiae. Yeast 9:761-770. [DOI] [PubMed] [Google Scholar]
- 3.Boles, E., and C. P. Hollenberg. 1997. The molecular genetics of hexose transport in yeasts. FEMS Microbiol. Rev. 21:85-111. [DOI] [PubMed] [Google Scholar]
- 4.Boles, E., and F. K. Zimmermann. 1993. Induction of pyruvate decarboxylase in glycolysis mutants of Saccharomyces cerevisiae correlates with the concentrations of three-carbon glycolytic metabolites. Arch. Microbiol. 160:324-328. [DOI] [PubMed] [Google Scholar]
- 5.Davies, S. E., and K. M. Brindle. 1992. Effects of overexpression of phosphofructokinase on glycolysis in the yeast Saccharomyces cerevisiae. Biochemistry 31:4729-4735. [DOI] [PubMed] [Google Scholar]
- 6.De Winde, J. H., M. Crauwels, S. Hohmann, J. M. Thevelein, and J. Winderickx. 1996. Differential requirement of the yeast sugar kinases for sugar sensing in establishing the catabolite-repressed state. Eur. J. Biochem. 241:633-643. [DOI] [PubMed] [Google Scholar]
- 7.Diderich, J. A., M. Schepper, P. van Hoek, M. A. Luttik, J. P. van Dijken, J. T. Pronk, P. Klaassen, H. F. Boelens, M. J. de Mattos, K. van Dam, and A. L. Kruckeberg. 1999. Glucose uptake kinetics and transcription of HXT genes in chemostat cultures of Saccharomyces cerevisiae. J. Biol. Chem. 274:15350-15359. [DOI] [PubMed] [Google Scholar]
- 8.Elbing, K., C. Larsson, R. M. Bill, E. Albers, J. L. Snoep, E. Boles, S. Hohmann, and L. Gustafsson. 2004. Role of hexose transport in control of glycolytic flux in Saccharomyces cerevisiae. Appl. Environ. Microbiol. 70:5323-5330. [DOI] [PMC free article] [PubMed] [Google Scholar]
- 9.Elbing, K., A. Stahlberg, S. Hohmann, and L. Gustafsson. 2004. Transcriptional responses to glucose at different glycolytic rates in Saccharomyces cerevisiae. Eur. J. Biochem. 271:4855-4864. [DOI] [PubMed] [Google Scholar]
- 10.Fiechter, A., G. F. Fuhrmann, and O. Kappeli. 1981. Regulation of glucose metabolism in growing yeast cells. Adv. Microb. Physiol. 22:123-183. [DOI] [PubMed] [Google Scholar]
- 11.Gustafsson, L. 1979. The ATP pool in relation to the production of glycerol and heat during growth of the halotolerant yeast Debaryomyces hansenii. Arch. Microbiol. 1979:15-23. [DOI] [PubMed] [Google Scholar]
- 12.Hauf, J., F. K. Zimmermann, and S. Muller. 2000. Simultaneous genomic overexpression of seven glycolytic enzymes in the yeast Saccharomyces cerevisiae. Enzyme Microb. Technol. 26:688-698. [DOI] [PubMed] [Google Scholar]
- 13.Heinisch, J. 1986. Isolation and characterization of the two structural genes coding for phosphofructokinase in yeast. Mol. Gen. Genet. 202:75-82. [DOI] [PubMed] [Google Scholar]
- 14.Hohmann, S., J. Winderickx, J. H. de Winde, D. Valckx, P. Cobbaert, K. Luyten, C. de Meirsman, J. Ramos, and J. M. Thevelein. 1999. Novel alleles of yeast hexokinase PII with distinct effects on catalytic activity and catabolite repression of SUC2. Microbiology 145:703-714. [DOI] [PubMed] [Google Scholar]
- 15.Jurica, M. S., A. Mesecar, P. J. Heath, W. Shi, T. Nowak, and B. L. Stoddard. 1998. The allosteric regulation of pyruvate kinase by fructose-1,6-bisphosphate. Structure 6:195-210. [DOI] [PubMed] [Google Scholar]
- 16.Kruckeberg, A. L. 1996. The hexose transporter family of Saccharomyces cerevisiae. Arch. Microbiol. 166:283-292. [DOI] [PubMed] [Google Scholar]
- 17.Lagunas, R. 1993. Sugar transport in Saccharomyces cerevisiae. FEMS Microbiol. Rev. 10:229-242. [DOI] [PubMed] [Google Scholar]
- 18.Larsson, C., A. Nilsson, A. Blomberg, and L. Gustafsson. 1997. Glycolytic flux is conditionally correlated with ATP concentration in Saccharomyces cerevisiae: a chemostat study under carbon- or nitrogen-limiting conditions. J. Bacteriol. 179:7243-7250. [DOI] [PMC free article] [PubMed] [Google Scholar]
- 19.Luyten, K., C. Riou, and B. Blondin. 2002. The hexose transporters of Saccharomyces cerevisiae play different roles during enological fermentation. Yeast 19:713-726. [DOI] [PubMed] [Google Scholar]
- 20.Marger, M. D., and M. H. Saier, Jr. 1993. A major superfamily of transmembrane facilitators that catalyse uniport, symport and antiport. Trends Biochem. Sci. 18:13-20. [DOI] [PubMed] [Google Scholar]
- 21.Mathews, C. K., K. E. van Holde, and K. G. Ahern. 2000. Biochemistry, 3rd ed. Addison Wesley Longman, Inc., San Francisco, Calif.
- 22.Morrissey, J. H. 1981. Silver stain for proteins in polyacrylamide gels: a modified procedure with enhanced uniform sensitivity. Anal. Biochem. 117:307-310. [DOI] [PubMed] [Google Scholar]
- 23.Murcott, T. H., H. Gutfreund, and H. Muirhead. 1992. The cooperative binding of fructose-1,6-bisphosphate to yeast pyruvate kinase. EMBO J. 11:3811-3814. [DOI] [PMC free article] [PubMed] [Google Scholar]
- 24.Nilsson, A., J. Norbeck, R. Oelz, A. Blomberg, and L. Gustafsson. 2001. Fermentative capacity after cold storage of baker's yeast is dependent on the initial physiological state but not correlated to the levels of glycolytic enzymes. Int. J. Food Microbiol. 71:111-124. [DOI] [PubMed] [Google Scholar]
- 25.Nissen, T. L., U. Schulze, J. Nielsen, and J. Villadsen. 1997. Flux distributions in anaerobic, glucose-limited continuous cultures of Saccharomyces cerevisiae. Microbiology 143:203-218. [DOI] [PubMed] [Google Scholar]
- 26.Norbeck, J., and A. Blomberg. 1997. Two-dimensional electrophoretic separation of yeast proteins using a non-linear wide range (pH 3-10) immobilized pH gradient in the first dimension; reproducibility and evidence for isoelectric focusing of alkaline (pI > 7) proteins. Yeast 13:1519-1534. [DOI] [PubMed] [Google Scholar]
- 27.Otterstedt, K., C. Larsson, R. M. Bill, A. Stahlberg, E. Boles, S. Hohmann, and L. Gustafsson. 2004. Switching the mode of metabolism in the yeast Saccharomyces cerevisiae. EMBO Rep. 5:532-537. [DOI] [PMC free article] [PubMed] [Google Scholar]
- 28.Ozcan, S., and M. Johnston. 1999. Function and regulation of yeast hexose transporters. Microbiol. Mol. Biol. Rev. 63:554-569. [DOI] [PMC free article] [PubMed] [Google Scholar]
- 29.Pao, S. S., I. T. Paulsen, and M. H. Saier, Jr. 1998. Major facilitator superfamily. Microbiol. Mol. Biol. Rev. 62:1-34. [DOI] [PMC free article] [PubMed] [Google Scholar]
- 30.Postma, E., W. A. Scheffers, and J. P. van Dijken. 1989. Kinetics of growth and glucose transport in glucose-limited chemostat cultures of Saccharomyces cerevisiae CBS 8066. Yeast 5:159-165. [DOI] [PubMed] [Google Scholar]
- 31.Raamsdonk, L. M., J. A. Diderich, A. Kuiper, M. van Gaalen, A. L. Kruckeberg, J. A. Berden, K. Van Dam, and A. L. Kruckberg. 2001. Co-consumption of sugars or ethanol and glucose in a Saccharomyces cerevisiae strain deleted in the HXK2 gene. Yeast 18:1023-1033. [DOI] [PubMed] [Google Scholar]
- 32.Reifenberger, E., E. Boles, and M. Ciriacy. 1997. Kinetic characterization of individual hexose transporters of Saccharomyces cerevisiae and their relation to the triggering mechanisms of glucose repression. Eur. J. Biochem. 245:324-333. [DOI] [PubMed] [Google Scholar]
- 33.Reifenberger, E., K. Freidel, and M. Ciriacy. 1995. Identification of novel HXT genes in Saccharomyces cerevisiae reveals the impact of individual hexose transporters on glycolytic flux. Mol. Microbiol. 16:157-167. [DOI] [PubMed] [Google Scholar]
- 34.Rolland, F., J. Winderickx, and J. M. Thevelein. 2002. Glucose-sensing and -signalling mechanisms in yeast. FEMS Yeast Res. 2:183-201. [DOI] [PubMed] [Google Scholar]
- 35.Rose, M., W. Albig, and K. D. Entian. 1991. Glucose repression in Saccharomyces cerevisiae is directly associated with hexose phosphorylation by hexokinases PI and PII. Eur. J. Biochem. 199:511-518. [DOI] [PubMed] [Google Scholar]
- 36.Rosenzweig, R. F. 1992. Regulation of fitness in yeast overexpressing glycolytic enzymes: parameters of growth and viability. Genet. Res. 59:35-48. [DOI] [PubMed] [Google Scholar]
- 37.Schaaff, I., J. Heinisch, and F. K. Zimmermann. 1989. Overproduction of glycolytic enzymes in yeast. Yeast 5:285-290. [DOI] [PubMed] [Google Scholar]
- 38.van Hoek, P., J. P. van Dijken, and J. T. Pronk. 2000. Regulation of fermentative capacity and levels of glycolytic enzymes in chemostat cultures of Saccharomyces cerevisiae. Enzyme Microb. Technol. 26:724-736. [DOI] [PubMed] [Google Scholar]
- 39.Verduyn, C., E. Postma, W. A. Scheffers, and J. P. Van Dijken. 1992. Effect of benzoic acid on metabolic fluxes in yeasts: a continuous-culture study on the regulation of respiration and alcoholic fermentation. Yeast 8:501-517. [DOI] [PubMed] [Google Scholar]
- 40.Verduyn, C., T. P. L. Zomerdijk, J. P. Van Dijken, and W. A. Scheffers. 1984. Continuous measurement of ethanol production by aerobic yeast suspension with an enzyme electrode. Appl. Microbiol. Biotechnol. 1984:181-185. [Google Scholar]
- 41.Wieczorke, R., S. Krampe, T. Weierstall, K. Freidel, C. P. Hollenberg, and E. Boles. 1999. Concurrent knock-out of at least 20 transporter genes is required to block uptake of hexoses in Saccharomyces cerevisiae. FEBS Lett. 464:123-128. [DOI] [PubMed] [Google Scholar]
- 42.Wilson, W. A., S. A. Hawley, and D. G. Hardie. 1996. Glucose repression/derepression in budding yeast: SNF1 protein kinase is activated by phosphorylation under derepressing conditions, and this correlates with a high AMP:ATP ratio. Curr. Biol. 6:1426-1434. [DOI] [PubMed] [Google Scholar]
- 43.Ye, L., A. L. Kruckeberg, J. A. Berden, and K. van Dam. 1999. Growth and glucose repression are controlled by glucose transport in Saccharomyces cerevisiae cells containing only one glucose transporter. J. Bacteriol. 181:4673-4675. [DOI] [PMC free article] [PubMed] [Google Scholar]


