Abstract
Clustering of pathogens in the environment leads to hot spots of diseases at local, regional, national, and international levels. Scotland contains regional hot spots of Johne's disease (caused by Mycobacterium avium subsp. paratuberculosis) in rabbits, and there is increasing evidence of a link between paratuberculosis infections in rabbits and cattle. The spatial and temporal dynamics of paratuberculosis in rabbits within a hot spot region were studied with the overall aim of determining environmental patterns of infection and thus the risk of interspecies transmission to livestock. The specific aims were to determine if prevalence of paratuberculosis in rabbits varies temporally between seasons and whether the heterogeneous spatial environmental distribution of M. avium subsp. paratuberculosis on a large scale (i.e., regional hot spots) is replicated at finer resolutions within a hot spot. The overall prevalence of M. avium subsp. paratuberculosis in rabbits was 39.7%; the temporal distribution of infection in rabbits followed a cyclical pattern, with a peak in spring of 55.4% and a low in summer of 19.4%. Spatially, M. avium subsp. paratuberculosis-infected rabbits and, thus, the risk of interspecies transmission were highly clustered in the environment. However, this is mostly due to the clustered distribution of rabbits. The patterns of M. avium subsp. paratuberculosis infection in rabbits are discussed in relation to the host's socioecology and risk to livestock.
In understanding risk and controlling disease it is important to know the distribution of the disease in the environment, both spatially and temporally. Diseases are often found to be clustered in space (e.g., bovine tuberculosis in badgers in Ireland [25] and in livestock in Argentina [26], bovine spongiform encephalopathy in Switzerland [14] and France [1], and paratuberculosis in Scotland [33]) or in space and time (e.g., bovine tuberculosis in badgers in Great Britain [12] and in opossums in New Zealand [27] and bluetongue in Europe and North Africa [31]) at local, regional, national, or even international levels. The studies cited above identify “hot spots” of disease and provide patterns of disease at high spatial scales (e.g., regional hot spots), often using farms as the unit of spatial resolution. However, where wildlife hosts pose a risk of disease to livestock, the farm may not be the most relevant scale. Determining patterns of disease within these hot spots could provide greater insights into the disease dynamics. For example, identifying biologically relevant scales at which to map environmental distributions of disease may be useful to those involved in developing disease control and/or eradication strategies.
As stated above, Scotland is considered a hot spot for paratuberculosis (also known as Johne's disease), which is a chronic, often fatal, enteritis of all ruminants that is caused by Mycobacterium avium subsp. paratuberculosis, in cattle (33). Not only does this disease have welfare and economic implications for livestock and the agricultural industry, respectively, but there is also the possibility that it may be linked to Crohn's disease in humans (6, 18, 19). Establishing the environmental patterns of M. avium subsp. paratuberculosis will provide insights into the risk of disease and enable informed disease control strategies to be developed.
Paratuberculosis is notoriously difficult to control in farmed ruminants, and one possible explanation for this could be the role of wildlife in the epidemiology of the disease (10). Historically, paratuberculosis was thought to affect only ruminants, both wild and domestic. However, recent studies have shown that nonruminant wildlife species carry the infective agent (2, 3), adding to the environmental distribution of disease; of these species, the rabbit (Oryctolagus cuniculus) is thought to represent the greatest risk of transmission of M.avium subsp. paratuberculosis to cattle. Rabbits are asymptomatic carriers of M. avium subsp. paratuberculosis and shed sufficient numbers of bacteria in their feces so that one fecal pellet may constitute an infective dose for cattle (9). This leads to a high risk of infection via the fecal-oral route in grazing environments, which is considered to be the main route of M.avium subsp. paratuberculosis transmission (30). Cattle do not avoid rabbit feces while grazing (20), which is unusual. Furthermore, cattle inoculated with rabbit isolates of the bacteria have become infected with the disease (4). Therefore, the distribution of the infection in the rabbit population equates to the environmental risk of interspecies disease transmission to grazing livestock, as there are no behavioral complexities affecting this risk. Within Scotland, regional hot spots of paratuberculosis have been identified in rabbits (16). Here the overall aim was to determine the temporal and spatial dynamics of M. avium subsp. paratuberculosis within rabbit populations and thus the interspecies environmental risk to livestock in a hot spot. The particular aims were to ascertain any seasonal variation in infection prevalence and determine the distribution of M. avium subsp. paratuberculosis within the hot spot itself. This will facilitate the mapping of environmental patterns of infection within rabbits and, therefore, the risk of interspecies transmission from rabbits to livestock.
MATERIALS AND METHODS
Study site.
The study was carried out on a 2,000-ha site situated in Tayside, Scotland, a previously identified regional hot spot of paratuberculosis in rabbits (16). The site has an elevation of between 155 and 280 m above sea level and consists of a mixture of pasture, woodland, and gorse (Ulex spp.) throughout. Mycobacterium avium subsp. paratuberculosis has previously been isolated from cattle, sheep, and rabbits on the study site (16, 17), with clinical cases of paratuberculosis in up to 5.3% of the herd per year and with infection prevalences of a minimum of 20%. Livestock had access to all areas of the study site. The distribution of rabbits in the United Kingdom is largely determined by the distribution of good burrowing ground for nesting sites (7). The whole site was surveyed, and the position of each rabbit warren (a group of burrows used by a social group of rabbits) was mapped using Global Positioning System (GPS) readings taken on a handheld Garmin GPS12.
Rabbit sampling.
A total of 252 rabbits were sampled between April 2002 and May 2003, as part of the normal monthly pest control strategy. No unusual climate conditions were observed during the study period. A standardized sampling regimen, using even effort across the whole site on every sampling night, was followed. GPS readings were taken at the position at which each rabbit was sampled, again using a handheld Garmin GPS12. Briefly, the carcasses were weighed, sexed, and given a superficial gross examination before postmortem procedures were carried out. Postmortem procedures included taking four sections of the gut (sacculus, appendix, ileum, and cecum) along with a mesenteric lymph node, which were pooled for culturing. The eye lenses were removed for age determination purposes (see below) New instruments were used for each animal. The M. avium subsp. paratuberculosis disease status of each animal was determined by culture on Middlebrook 7H11 solid agar culture medium slopes and analysis by PCR using the IS900 insertion sequence, following the protocols previously described (16).
Histopathological examination.
Sections of the sacculus and appendix were taken for histopathological evaluation from a random subset of the sample. The tissues were fixed in 10% formol-saline for a minimum of 24 h, trimmed, dehydrated through graded alcohols, embedded in paraffin wax, and sectioned (5μm). The sections were stained with hematoxylin and eosin for routine histopathological examination and to test for acid-fast bacilli by the Ziehl-Neelsen method.
Determination of the ages of rabbits.
The eye lenses were used to determine the ages of rabbits sampled according to the protocol described by Wheeler and King (33a). Briefly, the eyeballs were stored in 10% formalin for a minimum of 14 days; the lenses were then removed from the eyeballs and oven dried at 85°C for 7 days. The mean dry weight of the lenses was then used to calculate the age of the rabbit by using the equation given by Wheeler and King (33a).
Statistical analysis.
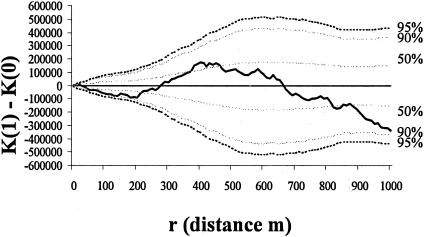
Generalized linear models using a negative binomial distribution with a logit link function were used to determine differences in prevalence between seasons (sampling was divided into five seasons: spring 2002, covering April and May; summer, covering June to August; autumn, covering September to November; winter, covering December to February; and spring 2003, covering March to May) and areas (see below). The difference between the observed and the fitted values, in light of the random variation described by the model, is given by the deviance ratio (dr). The K-function was used to test for complete spatial randomness (CSR) (28) of the distributions of rabbits, warrens, and M. avium subsp. paratuberculosis. The K-function takes an arbitrary point, determines the expected number of points within a given (user-defined) distance of this arbitrary point, and divides it by the overall intensity of points within the sampling region. If the points conform to CSR, then K(r) = πr2, where r is the distance. The K-function was plotted against distance in meters, with the sampling region set using the minimum convex polygon containing all points, along with a 95% confidence envelope obtained from 1,000 simulations of the K-function (28). If the distribution was completely spatially random, the line would follow zero; above zero indicates that there is clustering, while below zero indicates regularity. Random labeling was used to “assess the spatial association between two different types of events in a bivariate process” (13) for the infectious state of the animals sampled, i.e., to determine, given the locations of the animals, whether the infected ones are randomly distributed throughout or whether there is evidence that the infected animals are more clustered or regular than would be expected under randomness. This method calculates the K-function for each group (i.e., infected and noninfected rabbits), and the difference between the two K-functions was plotted against distance as described above, providing an indication of the distribution of infection within the rabbit population after accounting for the spatial clustering of the rabbits in the environment.
RESULTS
Culture and PCR.
Of the 252 rabbits sampled, 100 (39.7%) were culture positive for Mycobacterium species; i.e., bacterial colonies grew on the agar slopes. Bacterial colonies from the agar slopes of all 100 culture-positive individuals were confirmed as Mycobacterium avium subspecies paratuberculosis by PCR.
Histopathological examination.
Histopathological lesions consistent with M. avium subsp. paratuberculosis infection were found in 16 (28.6%) of the 56 samples sent for examination. No histopathological lesions were found in culture-negative animals.
Temporal distribution.
The prevalence of M. avium subsp. paratuberculosis infection varied between seasons (dr, 7.38; df, 4; P < 0.001). The prevalence was significantly lower in summer and autumn than in the other three seasons. There was no significant difference between prevalence in summer and autumn. The highest prevalence was in spring 2002, with the prevalence falling to a low in summer, steadily rising again through autumn and winter, and reaching a similar high prevalence again in spring 2003 (Table 1).
TABLE 1.
Number of rabbits sampled, number of positive rabbits (all are culture and PCR positive for M. avium subsp. paratuberculosis), and prevalence in each season
| Season | Total no. sampled | No. positive | % Positive |
|---|---|---|---|
| Spring 2002 | 65 | 36 | 55.4 |
| Summer | 62 | 12 | 19.4 |
| Autumn | 42 | 11 | 26.2 |
| Winter | 41 | 18 | 43.9 |
| Spring 2003 | 42 | 23 | 54.8 |
| Total | 252 | 100 | 39.7 |
Spatial distribution.
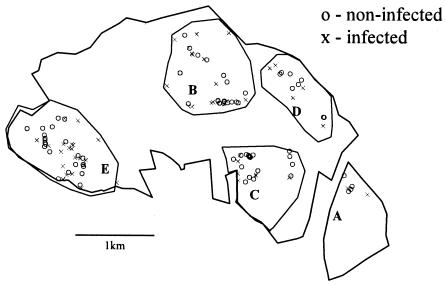
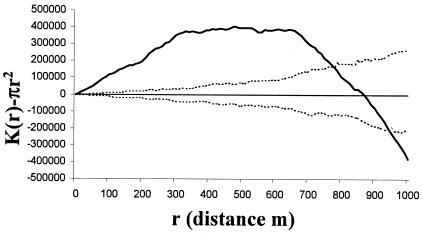
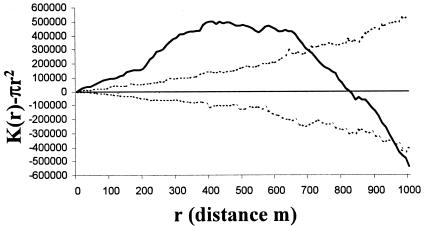
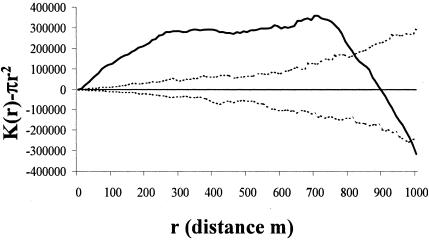
Visually, the rabbits were clustered in five areas, designated A to E (Fig. 1), and the prevalence of M.avium subsp. paratuberculosis infection in the rabbits was significantly lower in area A than in all other areas (dr, 4.76; df, 4; P < 0.001) (Table 2). The M. avium subsp. paratuberculosis-infected rabbits were significantly clustered across the site up to a distance of approximately 700 m, becoming regularly spaced at around 850 m (Fig. 2). That is, when the site was sampled at a high resolution, e.g., with “quadrats” of between 1 and 700 m in radius, infected rabbits appeared to be clustered; however, when sampling was at a low spatial resolution, using larger “quadrats” with radii of 850 m and greater, the infected rabbits appeared to be regularly distributed in space. All rabbits sampled were also clustered across the site up to a distance of approximately 850 m, when they also become regularly spaced (Fig. 3). The M. avium subsp. paratuberculosis-infected rabbits were regularly spaced within the distribution of all rabbits (i.e., after removing the effect of the clustered rabbit population in the environment in Fig. 3) up to a distance of about 200 m; from around 300 m they were relatively clustered, after which they become regularly spaced again at around 660 m (Fig. 4). Warrens were clustered across the site up to a distance of approximately 900 m, beyond which they became regularly spaced (Fig. 5).
FIG. 1.
Distribution of all rabbits sampled, divided into the five local populations.
TABLE 2.
Number of rabbits sampled, number of positive rabbits (all are culture and PCR positive for M. avium subsp. paratuberculosis), and prevalence by area
| Area | Total no. sampled | No. positive | % Positive |
|---|---|---|---|
| A | 45 | 7 | 15.6 |
| B | 39 | 19 | 48.7 |
| C | 44 | 15 | 34.1 |
| D | 26 | 13 | 50.0 |
| E | 93 | 46 | 49.5 |
| Unknown | 5 | 0 | 0.0 |
| Total | 252 | 100 | 39.7 |
FIG. 2.
K-function analysis of the distribution of M. avium subsp. paratuberculosis-infected rabbits across the site (dotted lines, 95% confidence envelope; solid line, CSR; boldface line, M. avium subsp. paratuberculosis distribution). Above CSR indicates that the M. avium subsp. paratuberculosis infection is clustered; below indicates that it is regularly distributed.
FIG. 3.
K-function analysis of the distribution of all rabbits across the site (dotted lines, 95% confidence envelope; solid line, CSR; boldface line, rabbit distribution). Above CSR indicates that the rabbits are clustered; below indicates that they are regularly distributed.
FIG. 4.
K-function analysis of the difference in the distributions of infected rabbits [K(1)] and noninfected rabbits [K(0)] across the site (dotted lines, confidence envelopes; solid line, CSR; boldface line, difference between K-functions of infected and noninfected rabbits). Above CSR indicates that the M. avium subsp. paratuberculosis-infected rabbits are clustered; below indicates that they are regularly distributed within the distribution of all rabbits.
FIG. 5.
K-function analysis of the distribution of warrens across the site (dotted lines, 95% confidence envelope; solid line, CSR; boldface line, warren distribution). Above CSR indicates that the warrens are clustered; below indicates that they are regularly distributed.
DISCUSSION
The overall aim of this study was to determine the temporal and spatial distributions of M. avium subsp. paratuberculosis infection in rabbits and therefore the environmental risk of interspecies transmission to cattle in a known hot spot for the disease in rabbits. This study shows that there are substantial, apparently cyclical, seasonal variations in the prevalence of M.avium subsp. paratuberculosis in rabbits. There are many potential but only two likely explanations for why the prevalence is lower in summer than in any other season. First, it could be due to the influx of young noninfected rabbits into the population in the summer. In the United Kingdom most young are produced in the middle of the breeding season (5, 7, 32), resulting in the largest numbers of young animals entering the population in the summer months. However, in this study only 10 out of 62 (16%) of the rabbits sampled in summer were in this age group; therefore, this is unlikely to have had a significant effect on the prevalence of M. avium subsp. paratuberculosis in summer.
The other likely explanation for the difference in prevalence between spring and summer could be the effects of overwintering on body condition and/or the stress associated with the onset of the breeding season. Spring is the time when many mammals are in their worst body condition, after surviving the harsher conditions of winter (21). The onset of the breeding season causes physiological stress for the males in terms of, e.g., increased aggression and mate guarding (29, 23) and for the females in terms of, e.g., the physical demands of gestation and lactation. Both a poorer body condition and higher physiological stress could compromise the immune system and result in higher levels of disease in many mammal species in the breeding season (24). Levels of infection in individual animals suffering from greater environmental stress may be higher and therefore easier to detect using culture and PCR, resulting in the appearance of increased prevalence in the spring.
The overall prevalence of M. avium subsp. paratuberculosis infection for the period of the study was 39.7%. As stated above, prevalence varied seasonally, from a low of 19.4% in summer to a high of 55.4% in spring 2002, as occurs in other diseases. For example, bovine tuberculosis in opossums is at a higher prevalence in spring (27). This was explained using knowledge of opossum socioecology, which suggested that the difference was due to an increase in transmission during the mating season (27). The time of year in which a survey of disease prevalence is carried out could, therefore, have a considerable effect on the results obtained. A previous study of M.avium subsp. paratuberculosis in the rabbits on the same study site gave a prevalence of 15% (3). However, that study took only a “snapshot” view, as the majority of the samples were collected in the summer. As with other studies, we have described the need to determine seasonal variations in disease prevalence in order to obtain an accurate picture of temporal patterns of disease prevalence and thus the risk of transmission of M. avium subsp. paratuberculosis from rabbits to livestock via the environment. This temporal variation in prevalence of M. avium subsp. paratuberculosis infection could be seen as more important with regard to the potential rabbit-to-livestock transmission of M. avium subsp. paratuberculosis, as cattle do not avoid rabbit feces while grazing (20). The amount of rabbit feces ingested is directly proportional to the level of rabbit fecal contamination of grazing pasture (20). As the prevalence of M. avium subsp. paratuberculosis in rabbits varies temporally, the proportion of infected rabbit fecal pellets on the pasture will also vary temporally. Consequently, the risk of interspecies transmission to cattle, and as such the environmental risk of M. avium subsp. paratuberculosis transmission from rabbits to cattle via the fecal-oral route, will follow the same temporal pattern. In terms of interspecies transmission, calves are at the greatest risk, as they are the most susceptible to M. avium subsp. paratuberculosis infection (30). At the study site the main calving period in spring occurs during the season of highest levels of M. avium subsp. paratuberculosis entering the environment from rabbits in their feces. Temporally, the peak time of infection risk to cattle thus coincides with the peak number of most susceptible animals.
M. avium subsp. paratuberculosis-infected rabbits were spatially clustered (up to 800 m) in the environment, suggesting a heterogeneous distribution of interspecific risk to cattle (Fig. 2). However, this apparent clustering of infection does not take into account the distribution of rabbits, which is similarly clustered (up to 950 m) (Fig. 3). Furthermore, the distribution of the warrens across the site showed clustering in the same pattern and to the same extent as the clustering of rabbits (Fig. 5), as would intuitively be expected, supporting the assumption that this was a representative sample of the resident rabbit population. Therefore, the spatial clustering of infected rabbits could be purely an artifact of the distribution of the areas of favorable habitat for the host species. While knowing the actual distribution of the disease in the environment is useful in terms of mapping the risk of rabbit-to-livestock transmission, to gain an insight into the dynamics of infection in the host population, it is necessary to remove any heterogeneous host distribution. The distribution of the infection shown in Fig. 4 takes into account that of the host species, in this example rabbits, and so gives a true picture of the distribution of M.avium subsp. paratuberculosis within the host population. Although the disease is obviously highly clustered within the study site, when looked at in relation to the host population, the pattern is quite different. At high spatial resolutions (i.e., <200 m) the disease tends towards being regularly spaced within the rabbit population; however, at medium resolutions (i.e., >200 m and <700 m) it appears to be clustered, while at low resolutions (i.e., >700 m) it appears to be more regularly spaced.
The differences in the distribution of M. avium subsp. paratuberculosis found by sampling at different spatial scales may be explained by looking at the socioecology of rabbits. Rabbits live in social groups of between 2 and 20 adults (average, 10); each social group inhabits its own warren (8), which is often located near other warrens to form a contiguous area of social groups which is referred to here as a bank. In the course of their daily routine, rabbits will range up to an average of 200 m from their warrens (11) and often will intermingle with individuals from other social groups in their bank but rarely with individuals from other banks. Even if not all social groups contained infected individuals, the regular distribution of the infection within the rabbit population seen at the highest spatial resolution could be accounted for by the random sampling of rabbits moving within their home ranges but intermingling with individuals from other social groups in the pasture adjacent to the banks. Sampling at lower spatial resolutions will include prevalence differences between banks of rabbits that will influence the perceived pattern of infection.
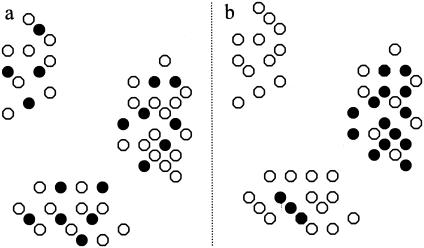
The method used here has shown how the perception of the distribution of parasites can vary depending on the spatial resolution of the sampling. As far as we are aware, although this method has been used extensively for other types of spatial point pattern analyses, including space-time interactions of disease outbreaks (15, 34), it has been used on only one other occasion to look at distribution of disease in the environment. Wilson et al. (35) used this method to show clustering of Salmonella spp. in badgers; however, they did not take into account the spatial distribution of the badger population itself. As our study has shown, this can lead to a misrepresentation of the actual distribution of the disease itself within the host population. The clustering of Salmonella spp. that they found could simply be a reflection of the distribution of the host, and the Salmonella-infected individuals may actually be regularly or randomly distributed within the badger population, as represented in Fig. 6a. Alternatively, the infection may be clustered within the heterogeneous distribution of the badgers, as represented in Fig. 6b. Often the actions necessary for disease control (e.g., culling of wildlife hosts) are impractical on a national scale, especially with pest species such as the rabbit in Scotland. Furthermore, these actions are often in conflict with conservation goals. For example, management of badgers has been used to try to control bovine tuberculosis in cattle in the United Kingdom; however, the badger is a protected species, often topping conservation lists (22). The answer to this conflict may be to concentrate wildlife management in areas of high risk (i.e., hot spots), in which case it is important to understand environmental patterns of disease within these hot spots. If clustering of disease occurs within the hot spot, then these areas can be targeted, potentially reducing the impact of management on the host species. Therefore, on a broad (e.g., regional or national) scale there is a need to identify where these hot spots are, and on a finer scale there is a need to determine how “hot” they are (i.e., whether the disease is regularly distributed across the hot spot or whether clustering occurs within the hot spot, creating areas of high prevalence). The spatial and temporal dynamics of disease in wildlife host populations will influence the timing, duration, and spatial scale of any proposed disease control strategy.
FIG. 6.
Representations of a regular distribution (a) and a clustered distribution (b) of infected individuals in a heterogeneously distributed host population (•, infected; ○, noninfected).
The results of this study show that the scale at which a disease is studied can have a considerable effect on the picture of spatial and temporal distribution obtained. Taking a “snapshot” on either a spatial or temporal scale can lead to misrepresentation of the disease status of an area; in this case, M.avium subsp. paratuberculosis infection in rabbits varies significantly both temporally and spatially. The heterogeneous distribution of disease on larger scales, as evidenced by the existence of regional disease hot spots, is replicated by a heterogeneous distribution of disease within the hot spot on a fine scale. In this example, M. avium subsp. paratuberculosis is highly clustered in the environment; however, this is mostly due to the clustered distribution of rabbits. Knowledge of the ecology of the host species, especially its distribution, gives a greater understanding of the mechanisms behind the environmental patterns of disease. Knowing the reasons behind the environmental distribution provides valuable information when determining disease risk, in this case the risk of transmission of paratuberculosis from rabbits to livestock.
Acknowledgments
We thank the study site owner for access to the property, Dennis Henderson for help with the postmortems and culturing, and James Mitchell for help with the postmortems.
This project was partially funded by the European Union (QLKZCT-2001-00879). The Scottish Agricultural College and Biomathematics and Statistics Scotland receive support from the Scottish Executive Environment and Rural Affairs Department (SEERAD). M.R.H. receives support from a SEERAD Senior Research Fellowship.
REFERENCES
- 1.Abrial, D., D. Calavas, N. Lauvergne, E. Morignat, and C. Ducrot. 2003. Descriptive spatial analysis of BSE in western France. Vet. Res. 34:749-760. [DOI] [PubMed] [Google Scholar]
- 2.Beard, P. M., M. J. Daniels, D. Henderson, A. Pirie, K. Rudge, D. Buxton, S. Rhind, A. Greig, M. R. Hutchings, I. McKendrick, K. Stevenson, and J. M. Sharp. 2001. Paratuberculosis infection of nonruminant wildlife in Scotland. J. Clin. Microbiol. 39:1517-1521. [DOI] [PMC free article] [PubMed] [Google Scholar]
- 3.Beard, P. M., S. M. Rhind, D. Buxton, M. J. Daniels, D. Henderson, A. Pirie, K. Rudge, A. Greig, M. R. Hutchings, K. Stevenson, and J. M. Sharp. 2001. Natural paratuberculosis infection in rabbits in Scotland. J. Comp. Pathol. 124:290-299. [DOI] [PubMed] [Google Scholar]
- 4.Beard, P. M., K. Stevenson, A. Pirie, K. Rudge, D. Buxton, S. M. Rhind, M. C. Sinclair, L. A. Wildblood, D. G. Jones, and J. M. Sharp. 2001. Experimental paratuberculosis in calves following inoculation with a rabbit isolate of Mycobacterium avium subsp. paratuberculosis. J. Clin. Microbiol. 39:3080-3084. [DOI] [PMC free article] [PubMed] [Google Scholar]
- 5.Boyd, I. L., and D. G. Myhill. 1987. Seasonal changes in condition, reproduction and fecundity in the wild European rabbit (Oryctolagus cuniculus). J. Zool. London 212:223-233. [Google Scholar]
- 6.Chiodini, R. J., H. J. van Kruiningen, and R. S. Merkal. 1984. Ruminant paratuberculosis (Johne's disease): the current status and future prospects. Cornell Vet. 74:218-262. [PubMed] [Google Scholar]
- 7.Corbet, G. B., and S. Harris. 1991. The handbook of British mammals, 3rd ed. Blackwell Scientific Publications, Oxford, United Kingdom.
- 8.Cowan, D. P., and D. J. Bell. 1986. Leproid social behaviour and social organisation. Mammal Rev. 16:169-179. [Google Scholar]
- 9.Daniels, M. J., D. Henderson, A. Greig, K. Stevenson, J. M. Sharp, and M. R. Hutchings. 2003. The potential role of wild rabbits Oryctolagus cuniculus in the epidemiology of paratuberculosis in domestic ruminants. Epidemiol. Infect. 130:553-559. [PMC free article] [PubMed] [Google Scholar]
- 10.Daniels, M. J., M. R. Hutchings, P. M. Beard, D. Henderson, A. Greig, K. Stevenson, and J. M. Sharp. 2003. Do non-ruminant wildlife pose a risk of paratuberculosis to domestic livestock and vice versa in Scotland? J. Wildl. Dis. 39:10-15. [DOI] [PubMed] [Google Scholar]
- 11.Daniels, M. J., J. D. Lees, M. R. Hutchings, and A. Greig. 2003. The ranging behaviour and habitat use of rabbits on farmland and their potential role in the epidemiology of paratuberculosis. Vet. J. 165:248-257. [DOI] [PubMed] [Google Scholar]
- 12.Delahay, R. J., S. Langton, G. C. Smith, R. S. Clifton-Hadley, and C. L. Cheeseman. 2000. The spatio-temporal distribution of Mycobacterium bovis (bovine tuberculosis) infection in a high density badger population. J. Anim. Ecol. 69:428-441. [Google Scholar]
- 13.Diggle, P. J. 2003. Statistical analysis of spatial point patterns, 2nd ed. Arnold, London, United Kingdom.
- 14.Doherr, M. G., A. R. Hett, J. Rufenacht, A. Zurbriggen, and D. Heim. 2002. Geographical clustering of cases of bovine spongiform encephalopathy (BSE) born in Switzerland after the feed ban. Vet. Rec. 151:467-472. [DOI] [PubMed] [Google Scholar]
- 15.French, N. P., E. Berriatua, R. Wall, K. Smith, and K. L. Morgan. 1999. Sheep scab outbreaks in Great Britain between 1973 and 1992: spatial and temporal patterns. Vet. Parasitol. 83:187-200. [DOI] [PubMed] [Google Scholar]
- 16.Greig, A., K. Stevenson, D. Henderson, V. Perez, V. Hughes, I. Pavlik, M. E. Hines, I. McKendrick, and J. M. Sharp. 1999. Epidemiological study of paratuberculosis in wild rabbits in Scotland. J. Clin. Microbiol. 37:1746-1751. [DOI] [PMC free article] [PubMed] [Google Scholar]
- 17.Greig, A., K. Stevenson, V. Perez, A. A. Pirie, J. M. Grant, and J. M. Sharp. 1997. Paratuberculosis in wild rabbits (Oryctolagus cuniculus). Vet. Rec. 140:141-143. [DOI] [PubMed] [Google Scholar]
- 18.Hermon-Taylor, J. 2001. Mycobacterium avium subspecies paratuberculosis is a cause of Crohn's disease. Gut 49:755-760. [DOI] [PMC free article] [PubMed] [Google Scholar]
- 19.Hermon-Taylor J., and T. Bull. 2002. Crohn's disease caused by Mycobacterium avium subspecies paratuberculosis: a public health tragedy whose resolution is long overdue. J. Med. Microbiol. 51:3-6. [DOI] [PubMed] [Google Scholar]
- 20.Judge, J., A. Greig, I. Kyriazakis, and M. R. Hutchings. 2005. Ingestion of faeces by grazing herbivores—risk of inter-species disease transmission. Agric. Ecosyst. Environ. 107:267-274. [Google Scholar]
- 21.Mitchell, B. 1977. Ecology of red deer: a research review relevant to their management in Scotland. Institute of Terrestrial Ecology, Cambridge, United Kingdom.
- 22.Morris, P. A. 1993. A red data book for British mammals. The Mammal Society, London, United Kingdom.
- 23.Myers, K., and W. E. Poole. 1959. A study of the biology of the wild rabbit, Oryctolagus cuniculus, in confined populations. I. The effect of density on home range and formation of breeding groups. Wildl. Res. 4:14-26. [Google Scholar]
- 24.Nelson, R. J., and G. E. Demas. 1996. Seasonal changes in immune function. Q. Rev. Biol. 71:511-548. [DOI] [PubMed] [Google Scholar]
- 25.Olea-Popelka, F. J., J. M. Griffin, J. D. Collins, G. McGrath, and S. W. Martin. 2003. Bovine tuberculosis in badgers in four areas in Ireland: does tuberculosis cluster? Prev. Vet. Med. 59:103-111. [DOI] [PubMed] [Google Scholar]
- 26.Perez, A. M., M. P. Ward, P. Torres, and V. Ritacco. 2002. Use of spatial statistics and monitoring data to identify clustering of bovine tuberculosis in Argentina. Prev. Vet. Med. 56:63-74. [DOI] [PubMed] [Google Scholar]
- 27.Pfeiffer, D., and R. S. Morris. 1991. A longitudinal study of bovine tuberculosis in possums and cattle, p. 17-39. In R. Jackson (ed.), Proceedings of a symposium on tuberculosis. Publication no. 132. Veterinary Continuing Education, Massey University, Palmerston North, New Zealand.
- 28.Ripley, B. D. 1976. The second-order analysis of stationary point processes. J. Appl. Probab. 13:255-266. [Google Scholar]
- 29.Southern, H. N. 1948. Sexual and aggressive behaviour in the wild rabbit. Behaviour 1:173-194. [Google Scholar]
- 30.Sweeney, R. W. 1996. Transmission of paratuberculosis, p. 305-312. In R. W. Sweeney (ed.), Paratuberculosis (Johne's disease). W. B. Saunders Company, Philadelphia, Pa.
- 31.Tatem, A. J., M. Baylis, P. S. Mellor, B. V. Purse, R. Capela, I. Pena, and D. J. Rogers. 2003. Prediction of bluetongue vector distribution in Europe and North Africa using satellite imagery. Vet. Microbiol. 97:13-29. [DOI] [PubMed] [Google Scholar]
- 32.Trout, R. C., and G. S. Smith. 1995. The reproductive productivity of the wild rabbit (Oryctolagus cuniculus) in south England on different soils. J. Zool. London 237:411-422. [Google Scholar]
- 33.Veterinary Laboratories Agency. 1993. Veterinary investigation diagnostic analysis report, 1991-1993. Veterinary Laboratories Agency, Addlestone, United Kingdom.
- 33a.Wheeler, S. H., and D. R. King. 1980. The use of eye-lens weights for ageing rabbits, Oryctolagus cuniculus (L.), in Australia. Aust. Wildl. Res. 7:79-84. [Google Scholar]
- 34.Wilesmith, J. W., M. A. Stevenson, C. B. King, and R. S. Morris. 2003. Spatio-temporal epidemiology of foot-and-mouth disease in two counties of Great Britain in 2001. Prev. Vet. Med. 61:157-170. [DOI] [PubMed] [Google Scholar]
- 35.Wilson, J. S., S. M. Hazel, N. J. Williams, A. Phiri, N. P. French, and C. A. Hart. 2003. Nontyphoidal salmonella in United Kingdom badgers: prevalence and spatial distribution. Appl. Environ. Microbiol. 69:4312-4315. [DOI] [PMC free article] [PubMed] [Google Scholar]


