Abstract
The effect of surface electrochemical polarization on the growth of cells of Pseudomonas fluorescens (ATCC 17552) on gold electrodes has been examined. Potentials positive or negative to the potential of zero charge (PZC) of gold were applied, and these resulted in changes in cell morphology, size at cell division, time to division, and biofilm structure. At −0.2 V (Ag/AgCl-3 M NaCl), cells elongated at a rate of up to 0.19 μm min−1, rendering daughter cells that reached up to 3.8 μm immediately after division. The doubling time for the entire population, estimated from the increment in the fraction of surface covered by bacteria, was 82 ± 7 min. Eight-hour-old biofilms at −0.2 V were composed of large cells distributed in expanded mushroom-like microcolonies that protruded several micrometers in the solution. A different behavior was observed under positive polarization. At an applied potential of 0.5 V, the doubling time of the population was 103 ± 8 min, cells elongated at a lower rate (up to 0.08 μm min−1), rendering shorter daughters (2.5 ± 0.5 μm) after division, although the duplication times were virtually the same at all potentials. Biofilms grown under this positive potential were composed of short cells distributed in a large number of compact microcolonies. These were flatter than those grown at −0.2 V or at the PZC and were pyramidal in shape. Polarization effects on cell growth and biofilm structure resembled those previously reported as produced by changes in the nutritional level of the culture medium.
In nature, surfaces often develop a potential difference with the surrounding aqueous medium, as a consequence of which an electrical double layer is formed at the interface. The thickness of this double layer depends on both the ionic properties of the electrolyte and the interfacial excess of charge. The potential difference decays mostly within the thickness of the double layer, inducing strong electric fields on the order of 105 V/cm due to the extremely short distances through which the potential change occurs. An analogous situation can be found in biological membranes, where a potential difference of 0.14 to 0.20 V drops within a typical distance of 10 nm across the thickness of the membrane, generating field strengths of the same order of magnitude (10).
Potential differences across biological membranes (i.e., membrane electrochemical potential, ΔΨ) have been related to several fundamental physiological processes, including ATP synthesis, flagellar rotation, and growth yield (7). Interestingly, it has been shown in eukaryotic cells that externally applied electric fields can modulate some cellular processes, including development, regeneration, and motility. These effects have often been related to local perturbations in the cell membrane potential (7).
It is generally accepted that most bacteria in nature live forming biofilms on virtually any kind of immersed surfaces, including glass, polymers, minerals, and metals. When growing on metals, biofilms are often related to corrosion problems. Charged metal surfaces can produce potential differences of several hundred millivolts within the bulk of the surrounding electrolyte (9). Bacteria growing at the metal-electrolyte interface are therefore exposed to potential perturbations that can modify their behavior, physiology, and growth.
The aims of the present work were to determine both the effects of low-amplitude direct-current polarization on the growth and division of individual bacterial cells of Pseudomonas fluorescens and the influence of polarization on biofilm formation by these bacteria.
MATERIALS AND METHODS
Biological material.
Pure cultures of P. fluorescens (ATCC 17552) were grown overnight at 32°C with continuous shaking in a culture broth containing peptone (Sigma) at 0.5 g liter−1 dissolved in 0.1 M NaCl, pH 6.8. After 18 h of growth, cultures were diluted with half a volume of fresh medium and cells were left to reach the exponential phase of growth, as determined by measuring the absorbance at 600 nm. Exponentially growing cells were harvested by centrifugation for 10 min at 10,000 × g in a Jouan BR4i refrigerated centrifuge, washed with 0.1 M NaCl, pH 6.8, and suspended in an NaCl solution of the same ionic strength after being centrifuged again.
Electrochemical thin-film flow cell.
All the experiments were performed using a cell described elsewhere (3). Briefly, a working electrode constructed by sputtering a thin film (10 to 20 nm) of gold onto a glass coverslip modified with (3-mercaptopropyl)trimethoxysilane (6) was placed facing down as a lid of a shallow (2-mm) acrylic chamber of 14-mm diameter into which a 0.75-mm platinum wire counterelectrode and a reference electrode were fitted. This arrangement allows the observation from the back of bacteria attached on the working electrode. Observations were made by phase-contrast microscopy using an Olympus BH-2 transmission microscope equipped with a series of D Achromat positive low-contrast lenses (Olympus, Tokyo, Japan), an IF550 green filter, and a phase-contrast condenser. The integrity of the gold films was verified by microscopic observation, and their electric resistance was measured in order to ensure electric conductivity. The reference electrode was Ag/AgCl-3 M NaCl, and all potentials are reported against this reference. The electrochemical cell was connected to the flow control system by silicone rubber tubing through stainless steel inlets.
Voltammetric measurements.
The voltammetric response of gold electrodes exposed to a flowing 0.5% NaCl solution was determined using an Autolab PGP201 potentiostat. The potential was cycled between 0.6 and −0.6 V at a scan rate of 10 mV · s−1, starting from the open circuit potential and in the anodic direction.
Potentiostatic growth experiments.
The flow system was inoculated with a bacterial suspension containing 2 × 10⁸ to 3 × 10⁸ cells ml−1. The bacterial cells were allowed to adhere to the gold working electrode at the rest potential for 2 minutes or until 30 to 60 attached bacteria could be observed in the microscope field (3). After attachment, the working electrode was polarized at the desired potential by using an EG&G 362 scanning potentiostat (Princeton Applied Research). Measurements were performed at potentials of −0.5, −0.2, 0.1, 0.5, and 0.8 V. A continuous flow of sterile medium was supplied, and the growth of bacteria was registered as a function of time. Experiments were carried out under a laminar flow of 0.7 ml min−1 (Reinolds coefficient = 8.10), which was created by hydrostatic pressure. Each experiment was recorded with a charge-coupled-device camera (500 by 582 active pixels) for 3 to 5 h in order to observe at least two consecutive division events for each cell. The optical magnification was ×2,000.
Sequential gray-scale images were captured from the videotapes with 3-min time intervals in order to determine the kinetics of bacterial growth under the different potential conditions. Micrographs were analyzed using the standard measurement tools of the public domain NIH-Image software (National Institutes of Health), which can be obtained free at http://rsb.info.gov/nih.image/.
The growth of the entire population in the field of view was estimated from the measurement of the area covered by the cells, on the assumption that the cell diameter did not change during each experiment. The percentage of cell coverage in every image was calculated after use of a specific background correction tool for the improvement of microscopic images, a threshold filtering, and a binary conversion to obtain black-and-white patterns on which the percentage of black pixels (cell bodies) on a white background was determined. After a linear fitting of experimental results, the doubling time (g) was calculated as g = 0.301/S, where S is the slope of the bacterial growth with time in a semilog plot (16). Values are reported as the means ± standard deviations of at least three independent determinations. The cell length and time to division were measured for each growing cell. The cell length was determined by drawing a straight line between cell poles and measuring the line length. Measurements were previously calibrated with the appropriate pixels/distance ratio. Time to duplication was estimated as the time from the initial division needed to observe the slip out of alignment between daughter cells, as described by Donachie and Begg (4). Cell length data were fitted to an exponential growth expression of the form l = l0 + A1 exp(x/t1), where l is the calculated cell length, l0 is the length offset, and A1 and t1 are the amplitude and the time constant of the exponential growth, respectively. The elongation rate was obtained as the first derivative of the calculated data.
After 3 and 8 h of growth, biofilms at three different areas randomly selected on the electrode surface were analyzed. The biofilm thickness was measured from the determination of the vertical displacement between focal planes at the metal surface and at the biofilm-liquid interface, using the method of Bakke and Olsson (1). In addition, sequential micrographs at a magnification of ×800 were taken at focal planes located at stepped distances from the electrode surface in order to compare the biofilm structures developed at selected applied potentials. The distance step was 4.5 μm. The area covered by cells at every focal plane of the biofilms was determined by digital analysis as described above. Reported values are the means ± standard deviations of at least three independent measurements.
RESULTS AND DISCUSSION
Voltammetric behavior of gold in 0.5% NaCl.
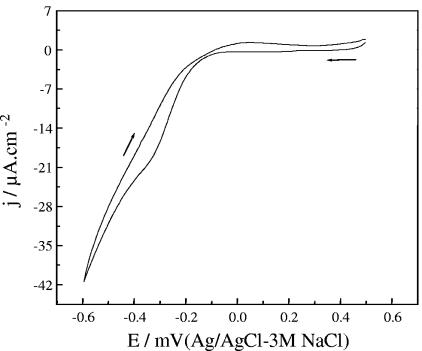
The typical voltammetric response of gold electrodes in 0.5% NaCl is shown in Fig. 1. A wide interval of low current density corresponding to nonfaradaic processes was observed at potentials above −0.15 and below 0.5 V. At potentials more negative than −0.15 V, a cathodic current wave in the reverse scan corresponding to the reduction of oxygen dissolved in the solution was observed. To investigate the effect of the applied potential on cell growth in the absence of faradaic processes, growth experiments were carried out at −0.2, 0.1, and 0.5 V. Since values ranging from 0.00 to 0.07 V (Ag/AgCl-KCl saturated) were found in the literature for the potential of zero charge (PZC) of gold in NaCl solutions (14), the experiments at 0.1 V were taken as a control for unperturbed growth in the absence of an electric field. Experiments at lower (−0.5 V) and higher (0.8 V) potentials were also performed to evaluate the influence of faradaic processes on cell growth.
FIG. 1.
Cyclic voltammetry of gold thin-film electrodes in 0.5% NaCl, pH 6.8. Arrows indicate the scan direction.
Bacterial population growth.
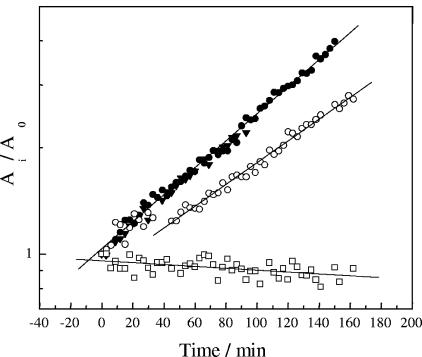
Results obtained for the growth under various potentials are shown in Fig. 2. During control experiments at a potential of 0.1 V (≅PZC), the bacterial population grew exponentially with a doubling time of 82.6 ± 7 min, with no evidence of a lag phase. When the applied potential was −0.2 V (i.e., negative to the PZC), the population growth kinetics did not show any difference from the control values. In contrast, at a more negative potential of −0.5 V, most of the bacteria did not adhere directly on the surface. Instead, they formed clusters loosely connected to the electrode, making it difficult to quantify the population growth from the measurement of the covered area. After 3 h of incubation, no evidence of growth of directly attached cells was observed, and neither was the formation of a biofilm after 24 h.
FIG. 2.
Growth of P. fluorescens on a polarized gold surface at −0.2 V (•), the PZC (▾), 0.5 V (○), and 0.8 V (□). Growth was measured every 3 min as the fraction of the total area covered by cells at every image (Ai) and was normalized to the area covered by cells at time zero (A0). Lines indicate the linear fitting results used to calculate the doubling time (g) (see Materials and Methods).
It has been previously shown that polarization to cathodic potentials of −0.2 V and −0.5 V prevents bacterial adhesion to an extent directly correlated to the magnitude of the applied potential (3). The effect was related to the electrostatic repulsive forces at the interface. In the present work, in addition to the negative surface charge induced on gold at both potentials, at −0.5 V oxygen reduction takes place (Fig. 1) by the reaction 2O2 + 4H+ + 4e− → 4OH−, raising the interfacial pH. The exposure of cells to an alkali stress can produce a transient failure in the intracellular pH homeostasis that has been directly related to the cessation of growth and cell division (17). For Escherichia coli the upper pH limit for growth has been reported to be pH 8.5 (12). In the present case, the electrochemical oxygen reduction can increase the interfacial pH at values much higher than pH 8.5, stopping cell division and growth. It is therefore proposed that this effect, together with the electrostatic prevention of cell adhesion to the surface, is responsible for impeding biofilm formation at an applied potential of −0.5 V.
When potentials positive to the PZC were applied, two different effects were observed, depending on the value of the applied potential. At 0.5 V a lag phase of 30 to 40 min in the population growth was followed by an exponential growth phase with a doubling time of 103 ± 8 min, higher than the value previously observed (Fig. 2). At 0.8 V, on the other hand, the bacteria did not grow, resembling the situation observed when a potential of −0.5 V was applied. In this case, the bacteria were in direct contact with the surface, allowing the area measurement. A slow decrease of the covered area with time was observed, indicating that initially adhered bacteria were disengaged from the surface by the flowing solution (Fig. 2). A biofilm had formed at this potential after 24 h of incubation.
Growth of individual cells.
After applying a potential, the time and cell size before division and the elongation of individual cells were analyzed as a function of time; these results are shown in Fig. 3 to 5.
FIG. 3.
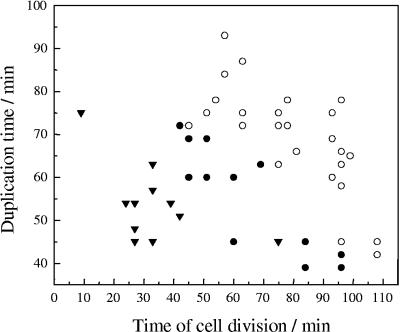
Duplication time for cells growing on a gold surface polarized at −0.2 V (•), the PZC (▾), and 0.5 V (○), as a function of the time of cell division during the experimentation time.
FIG. 5.
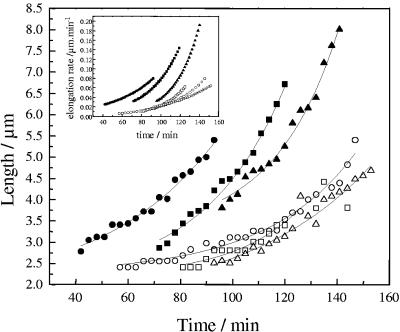
Evolution of cell length during the growth of cells on a gold surface at a potential of −0.2 V (closed symbols) or 0.5 V (open symbols). Different symbols correspond to cells originated at increasing experimentation times (•, 42 min; ▪, 72 min; ▴, 96 min; ○, 57 min; □, 81min; and ▵, 93min). Lines indicate the exponential growth fitting results used to calculate the elongation rates of individual bacteria (see Materials and Methods). Inset, elongation rates calculated by differentiation of the exponential growth fitting results.
As can be seen in Fig. 3, the time to division (i.e., duplication time) of a given cell was dependent on the time at which that particular cell was generated, showing an adaptation of the populations to the applied potential. When the applied potential was at the PZC or more negative values (−0.2 V), the time to division for the cells dividing first (after ∼30 min) varied greatly, from 50 to 72 min. Beyond 70 min from the start of the experiment, the time to division showed a lower dispersion and approached 40 min. On the other hand, for experiments at a positive potential, initial duplication times were between 70 to 92 min and decreased markedly with the progress of the experiment, also reaching values of approximately 40 min. It is important to note that duplication times were always longer for cells at a potential positive to the PZC for a given experimentation time, compared to those measured for cells at a negative potential at the same time from potential application (Fig. 3).
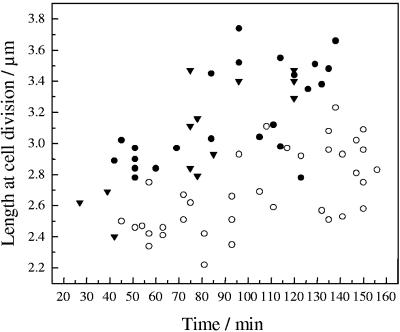
As shown in Fig. 4, the size at division also indicated an adaptation to the imposed potential conditions. Sizes at division were observed to increase with the progress of the experiment at all potentials. At the PZC or at −0.2 V, sizes increased from initial values ranging between 2.4 and 3.0 μm to values of between 3.1 and 3.8 μm. In contrast, at positive potentials, sizes changed from 2.3 to 2.7 μm to 2.4 to 3.2 μm during the progress of the experiment. The length was always shorter for cells grown at positive potentials at any given time than for cells grown at negative potentials (Fig. 5).
FIG. 4.
Length at cell division of cells growing on a gold surface polarized at −0.2 V (•), the PZC (▾), and 0.5 V (○), as a function of the experimentation time.
In order to gain additional information regarding the effect of applied potentials on cell growth, the elongation of cells was measured for experiments at −0.2 and 0.5 V. As can be seen in Fig. 5, cells grown at negative potentials produced longer daughter cells as a consequence of a higher rate of elongation during growth compared with those developing at a positive potential. Calculated elongation rates reached values of up to 0.19 and 0.08 μm/min at potentials of −0.2 and 0.5 V, respectively (inset in Fig. 5).
Evidence presented in Fig. 2 to 4 suggests that growth of cells is not affected by an applied potential of −0.2 V. In contrast, at a potential of 0.5 V, a set of deleterious effects on growth were observed. The response at this potential will be compared to that observed at −0.2 V.
As discussed elsewhere (11), bacterial cells become much bigger as they grow faster. During a typical shift-up experiment in which cells are shifted from a poorer to a richer medium, the rate of mass accumulation rapidly increases to a new value. The preshift rate of cell division is maintained for approximately 60 min after the shift (5), but during this time cell size increases. When the bacteria are placed in a poorer medium (shift down), the number of cells continues to increase at the preshift rate, while the increase in cellular mass almost ceases (11). After a lag period during which the size of the cells is adjusted (diminishes) appropriately for maximum growth rate in the new medium, growth of cellular mass proceeds at the postshift rate (11).
For cells growing at −0.2 V, the covered area grew exponentially with no observable lag period (Fig. 2). This was accompanied by an adaptation period, during which the duplication time was progressively reduced (Fig. 3) while the length at division increased (Fig. 4) due to the faster increase in the mass accumulation rate. All these changes observed at negative polarization are similar to those observed after a shift up in nutrient level (11).
Changes in the covered area at 0.5 V, however, resemble the response to a shift down. A lag period of 30 to 40 min was observed after applying the potential. After this, growth was resumed at a rate lower than those at the other potentials (Fig. 2). Variations in cell length and time to division in this case differ from the typical response to a shift down, since an increase in the former (Fig. 4) and a decrease in the later (Fig. 3) were observed. Beside this, it is important to note that the cells were always shorter and older at division when exposed to a positive potential than they were at a negative potential (Fig. 3 and 4), indicating that applying a positive potential interferes with the bacterial growth.
Although the origin of the dependence of bacterial growth on potential remains unclear, similarities found with the response to changes in nutrient availability deserve to be analyzed. As demonstrated in the work by Gross et al. (7), externally applied electric fields modulate the membrane potential of animal cells in a way that produces a hyperpolarization on the anode-facing side and a depolarization on the cathodal side of cells. Neglecting membrane conductance, those authors interpreted the membrane potential change as the difference between the interior unperturbed potential and the change of the local exterior potential due to action of the electric field. If these arguments are applicable to bacteria, the question arises as to how hyperpolarization of cell membrane due to the surface polarization to 0.5 V would influence cell growth. It is proposed that due to the high electric component of membrane potential (ΔΨ, negative inside) induced by the field, proton translocation to the outer side of the membrane would be hindered, thus lowering both ΔpH and ATP synthesis. Additionally, the transport of electrons down the transport chain would also be prevented by the increased ΔΨ, and reduced compounds such as NADH or FADH would be accumulated, lowering both the rates of main oxidative metabolic pathways and the nutrient consumption (16). This effect together with the low ATP yield could be responsible for the shift-down-like response to positive polarization.
Biofilm structure.
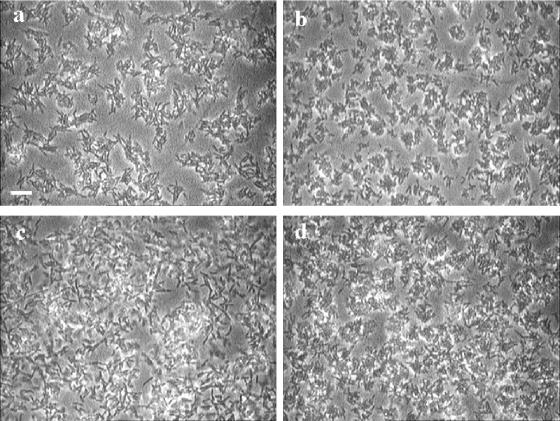
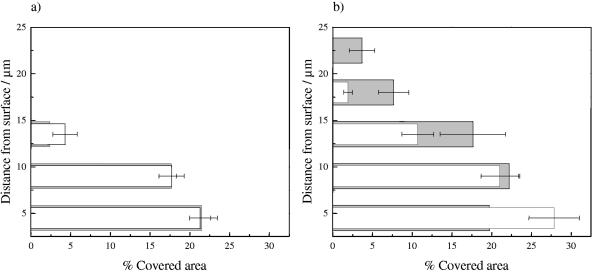
To evaluate the influence of changes of individual cell growth on biofilm structure, biofilms grown at potentials of −0.2 and 0.5 V were optically sectioned (magnification, ×800) after 3 and 8 h of incubation. As can be observed in Fig. 6a to d, a patchy biofilm grew at both potentials but showed different distribution patterns. After 3 h of growth at −0.2 V, microcolonies consisted of long cells distributed in an expanded and diffuse way. These were surrounded by large void spaces and channels (Fig. 6a). At a potential of 0.5 V, on the other hand, a large number of small microcolonies regularly distributed on the surface and composed of tightly packed short cells were observed (Fig. 6b). For biofilms grown at both potentials, 22% of the surface was covered by cells in the basal plane (Fig. 7a). The quantity of cell material was reduced markedly at the biofilm-liquid interface. In both cases, the biofilms formed reached an estimated thickness of 13 μm after 3 h of growth (Fig. 7a). After 8 h of growth, the colony and cell features described above at both potentials were still observed, together with the changes in the three-dimensional biofilm structure discussed below.
FIG. 6.
Representative images showing the distribution of biofilms grown on a polarized gold surface at −0.2 V (a and c) and 0.5 V (b and d) for 3 h (a and b) and 8 h (c and d). Optical magnification, ×800. The bar indicates 10 μm, and the scale applies to all the panels.
FIG. 7.
Percentage of area covered by cells in biofilm focal planes at increasing distances from the electrode surface. Biofilms were developed at −0.2 V (gray bars) and 0.5 V (white bars) and were analyzed after 3 (a) and 8 (b) h of growth.
At −0.2 V, the formation of expanded irregular colonies was observed. These protruded into the liquid phase, reaching an estimated thickness of 24 ± 2 μm (Fig. 7b). The higher cell density was registered at a distance of approximately 8 μm away from the surface (Fig. 7b), producing microcolonies resembling mushrooms. In contrast, at 0.5 V, colonies grew until they reached a maximum cell density of 27% ± 3% at the surface level. The quantity of cell material progressively diminished from the surface to the upper levels of the biofilms, rendering microcolonies pyramidal in shape (Fig. 7b). The maximum thickness observed at this potential was 16 ± 2 μm.
The changes in microcolony features and distribution can be explained if the synergic influence of the modified growth of individual cells, the electrophoretic effects on charged bacteria, and the electro-osmotic induction of cell clustering (2, 13, 15) is considered. All these processes are thought to contribute to the formation of tightly packed microcolonies under positive polarization (Fig. 6b and d). First, negatively charged bacteria (3) are expected to migrate towards the surface in the electric field associated with the anodically polarized electrode (0.5 V). Second, the electrostatic interaction between surfaces oppositely charged will favor irreversible adhesion (3). Finally, the participation of electro-osmotic ionic fluxes induced by disruption of the electrode double layer by primary colonizing bacteria will help with cell clustering (13). It is important to note that all these forces (electrophoretic, electrostatic, and electro-osmotic) will also work on newly originated bacteria, thus helping to retain daughter cells in the biofilm in a close relationship to the surface, leading to the formation of pyramidal clusters with a high density of cells in the basal layer (Fig. 7b).
On a negatively charged surface, on the other hand, field-induced forces will tend to spread newly formed cells in open microcolonies (Fig. 6a and 6c), with a weak association with the surface (Fig. 7b).
Even when this combination of physical processes could explain the observed response of a biofilm structure to polarization, the participation of growth-related effects in determining biofilm structure cannot be excluded. Interestingly, James et al. (8) reported that the irrigation of attached Acinetobacter sp. strain GJ12 cells with a high-nutrient medium led to the spread of surface-colonizing bacteria and to the formation of a dispersed biofilm, while irrigation with a starvation medium led to the formation of an aggregated biofilm composed of discrete microcolonies (8). These results can clearly be connected to the observations reported here to show a relationship between the effects of changes in nutrient levels and those derived from surface polarization.
Conclusions.
The growth of cells of P. fluorescens attached to a gold surface is in some way influenced by external polarization of the surface. The effects of polarization depend on the magnitude and polarity of the applied potential. Major effects are observed under positive polarization and are similar to those produced by a nutritional shift down.
Acknowledgments
The present research was supported by a grant from Fundación Antorchas, Argentina (project no. 14116-134).
Encouragement by and useful discussion with David J. Schiffrin, Liverpool, United Kingdom, are gratefully acknowledged.
REFERENCES
- 1.Bakke, R., and P. Q. Olsson. 1986. Biofilm thickness measurements by light-microscopy. J. Microbiol. Methods 5:93-98. [Google Scholar]
- 2.Bohmer, M. 1996. In situ observation of 2-dimensional clustering during electrophoretic deposition. Langmuir 12:5747-5750. [Google Scholar]
- 3.Busalmen, J. P., and S. R. de Sanchez. 2001. Adhesion of Pseudomonas fluorescens (ATCC 17552) to nonpolarized and polarized thin films of gold. Appl. Environ. Microbiol. 67:3188-3194. [DOI] [PMC free article] [PubMed] [Google Scholar]
- 4.Donachie, W. D., and K. J. Begg. 1970. Growth of the bacterial cell. Nature 227:1220-1224. [DOI] [PubMed] [Google Scholar]
- 5.Donachie, W. D., and A. C. Robinson. 1987. Cell division: parameters values and the process, p. 1578-1593. In F. C. Neidhardt, R. Curtiss III, J. L. Ingraham, K. B. Low, B. Magasanik, M. Schaechter, and H. E. Umbarger (ed.), Escherichia coli and Salmonella typhimurium: cellular and molecular biology, vol. 2. American Society for Microbiology, Washington D.C. [Google Scholar]
- 6.Goss, C. A., D. H. Charych, and M. Majda. 1991. Application of (3-mercaptopropyl)trimethoxysilane as a molecular adhesive in the fabrication of vapor-deposited gold electrodes on glass substrates. Anal. Chem. 63:85-88. [Google Scholar]
- 7.Gross, D., L. M. Loew, and W. W. Webb. 1986. Optical imaging of cell-membrane potential changes induced by applied electric-fields. Biophys. J. 50:339-348. [DOI] [PMC free article] [PubMed] [Google Scholar]
- 8.James, G., D. Korber, D. Caldwell, and J. Costerton. 1995. Digital image analysis of growth and starvation responses of a surface-colonizing Acinetobacter sp. J. Bacteriol. 177:907-915. [DOI] [PMC free article] [PubMed] [Google Scholar]
- 9.Jones, D. 1992. Principles and prevention of corrosion. MacMillan Publishing. Co., New York, N.Y.
- 10.Lohrengel, M. M. 1997. Interface and volume effects in biological cells and electrochemical microcells. Electrochim. Acta 42:3265-3271. [Google Scholar]
- 11.Neidhardt, F. C., J. L. Ingraham, and M. Schaechter. 1990. Physiology of the bacterial cell. A molecular approach, p. 389-417. Sinauer Associates Inc., Sunderland, Mass.
- 12.Padan, E., T. Tzubery, K. Herz, L. Kozachkov, A. Rimon, and L. Galili. 2004. NhaA of Escherichia coli, as a model of a pH-regulated Na+/H+antiporter. Biochim. Biophys. Acta 1658:2-13. [DOI] [PubMed] [Google Scholar]
- 13.Poortinga, A. T., R. Bos, and H. J. Busscher. 2000. Controlled electrophoretic deposition of bacteria to surfaces for the design of biofilms. Biotechnol. Bioeng. 67:117-120. [DOI] [PubMed] [Google Scholar]
- 14.Sokolowski, J., J. M. Czajkowski, and M. Turowska. 1990. Zero charge potential measurement of solid electrodes by inversion immersion method. Electrochim. Acta 35:1393-1398. [Google Scholar]
- 15.Solomentsev, Y., M. Bohmer, and J. L. Anderson. 1997. Particle clustering and pattern formation during electrophoretic deposition: a hydrodynamic model. Langmuir 13:6058-6068. [Google Scholar]
- 16.White, D. 1995. The physiology and biochemistry of prokaryotes. Oxford University Press, New York, N.Y.
- 17.Zilberstein, D., V. Agmon, S. Schuldiner, and E. Padan. 1984. Escherichia coli intracellular pH, membrane potential, and cell growth. J. Bacteriol. 158:246-252. [DOI] [PMC free article] [PubMed] [Google Scholar]


