Abstract
Over 70 million people were born into the baby-boom cohort between 1946 and 1964. Over 65 million of these individuals are presently alive, and thus the cohort continues to exert a powerful influence on regional population change in the United States. In this article, we examine the recent and current geographic distribution of the baby-boom cohort. In 1990, the members of the cohort comprised a particularly high proportion of the population in a small number of dynamic metropolitan areas. We also highlight the recent migration trends exhibited by this cohort; these trends are potentially important early indicators of the retirement-related migration patterns that the cohort might follow. The spatial redistribution of the cohort has many implications, including potentially significant consequences for intergenerational relationships and caregiving. Also highlighted in the article are the temporal and geographical implications for intergenerational caregiving. There has been much attention given to the “sandwich” generation, with its members having dual caregiving responsibilities to both parents and children. A more appropriate designation may be the “stretched” generation, because caregiving seems to extend over a long period. In particular, many members of the baby-boom cohort are beginning to care for their aging parents just as they finish child rearing.
Keywords: aging, spatial distribution
The baby-boom cohort, generally defined as the group of people born between 1946 and 1964, is now between 41 and 59 years old. The cohort currently has >65 million individuals, representing close to one-fourth of the population of the United States. Much has been written about the baby boom; an annotated bibliography on the subject from two decades ago (1) contains >700 entries, on subjects ranging from consumption and marketing to retirement financing. Demographic and economic predictions were made for the cohort by Russell (2), and Gillon (3) has recently expounded on how the generation has changed the country in myriad ways. Both the age and the size of the cohort portend dramatic changes in many social, economic, and demographic arenas.
Of the large volume of literature on the baby-boom cohort, only a small fraction has been written from a geographic perspective. The focus of this article is on the geographical consequences of the aging of the baby-boom cohort. We emphasize the recent, current, and future geographic distribution of the cohort, and we note some of the consequences for intergenerational caregiving. We first describe the recent geography of the baby boom in the United States, paying particular attention to recent changes in geographical distribution, and the migration trends of the cohort. We then focus upon temporal and geographical perspectives on intergenerational caregiving.
Recent and Current Distribution and Redistribution of the Baby-Boom Cohort
What is the geographic distribution of the baby-boom cohort in the United States? Is it spatially uniform, or are there clusters of high concentration in particular regions? It is of interest to examine both the current and recent geographic distribution and the recent redistribution of this large cohort.
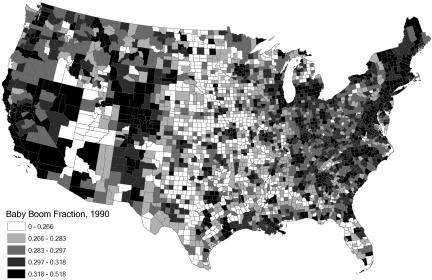
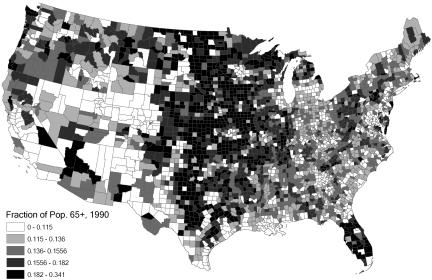
Fig. 1 depicts the relative size of the baby-boom cohort consisting of individuals ≈25-44 years old in 1990 county populations; it is similar to that given by Rogerson (4). The main features of the figure include bicoastal and metropolitan concentrations (we focus our attention here on the 48 contiguous states, primarily for the sake of convenience in mapping and visualization). The bicoastal concentrations ref lect long-standing migration patterns away from other parts of the country toward the coasts. Members of the baby-boom cohort took place in, and in fact were the driving force behind, these population shifts, particularly during their migration-prone years of young adulthood. The emptying of the American breadbasket of its breadwinners has left the Midwest with a disproportionate share of its population in older age groups. The spatial concentration of the elderly in the Midwest strikes many as surprising; although Florida, Arizona, and other popular retirement destinations have large proportions of their populations in the older age groups, so too does the Midwest, and the latter region constitutes the more prominent visual feature when the focus is on the spatial distribution of the elderly (see Fig. 2, which reveals the remarkable degree to which the elderly constitute the population of the Midwest).
Fig. 1.
Baby-boom population as a fraction of total population, 1990.
Fig. 2.
Fraction of population aged 65 and over, 1990.
Perhaps less apparent in Fig. 1, but still clearly notable, is the relative demographic importance of the baby-boom population in a small number of dynamic metropolitan areas, notably San Francisco, Portland (Oregon), Minneapolis, Denver, Dallas-Fort Worth, Washington DC, Phoenix, and Atlanta. Rogerson (4) notes that these concentrations are the result of net in-migration of the cohort to these areas; the baby boom itself was a fairly uniform spatial event, with slightly higher “production” of baby boomers in the Rocky Mountain region, the upper Midwest, and the Deep South.
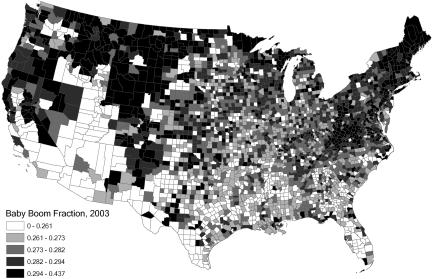
Fig. 3 essentially is an “update” of Fig. 1; it shows county populations aged 40-59 in 2003 as a fraction of total county population in 2003. One caveat is that it does not perfectly match the baby-boom cohort, whose members were between ages 38.5 and 57.5 at the time of the estimates. The figure reveals a distribution that is quite different from that in Fig. 1 for 1990. In particular, New England, the northern parts of the Rocky Mountain (Wyoming, Montana, Idaho) and Pacific (Oregon, Washington) regions, and parts of Virginia and West Virginia all now have relatively high percentages of baby boomers in their populations. What are the demographic reasons for these changes in the spatial distribution of baby boomers?
Fig. 3.
Baby-boom population as a fraction of total population, 2003.
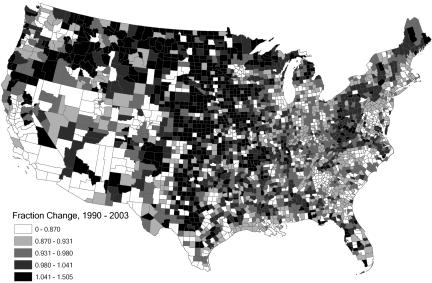
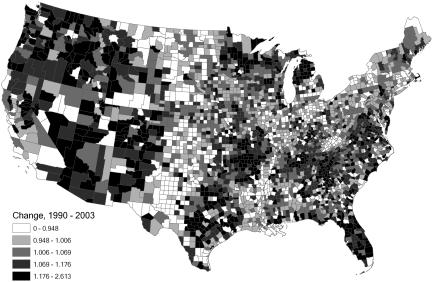
Fig. 4 highlights the changes by depicting the ratio between the 2003 and 1990 maps (Figs. 3 and 1, respectively). A ratio that is greater than one implies that the demographic importance of the baby-boom generation in county populations has grown over time. Such areas are not common in large part because of the declining size of the cohort due to mortality. Fig. 4 reveals that large portions of the Midwest, parts of western Pennsylvania, western Virginia, and West Virginia, portions of Florida, and the Pacific Northwest all have witnessed increases in the percentage of their populations that is composed of baby boomers. The two possible reasons for such increases are net in-migration among baby boomers and/or net out-migration of other age cohorts. Similarly, the light-shaded areas in Fig. 4, such as much of the Carolinas and Georgia, now have lower fractions of their populations in the baby-boom years, perhaps because of baby-boomer out-migration, but also perhaps because of the net in-migration of cohorts of other ages.
Fig. 4.
Ratio of baby-boom fraction in 2003 to baby-boom fraction in 1990.
A somewhat different, yet complementary, perspective on spatial change is achieved by mapping the ratio of 40- to 59-year-olds in 2003 to 25- to 44-year-olds in 1990 (Fig. 5). Again, the “match” is not perfect. We are examining a 13-year time period (1990 to 2003) and are looking at a cohort that is 15 years older. Adjustments could be made, but adjustments would entail estimation that would introduce error; the imperfect match still provides revealing insights into broad-scale demographic change.
Fig. 5.
Ratio of size of baby-boom cohort in 2003 to size of baby-boom cohort in 1990.
Areas in Fig. 5 with ratios greater than one imply a net increase in the number of individuals who are members of the baby-boom cohort. These areas are not common because of mortality; the net in-migration of cohort members must exceed declines from mortality if the ratio is to be greater than one. Dark areas in this figure could occur in regions with either (i) relatively low mortality, (ii) relatively high net in-migration of individuals in this age cohort, or (iii) both. Because mortality is fairly uniform spatially, the majority of the geographic variation shown in the figure is due to the migration of the baby-boom cohort. Net in-migration is evident in the Pacific Northwest, Florida, and selected areas of the South (e.g., the Ozark region and the western Carolinas). More generally, it seems that net in-migration has occurred in many of the areas surrounding the areas of high concentration in 1990 (portrayed in Fig. 1). Thus, we see in Fig. 5 that there has been net in-migration of the baby-boom cohort in the vicinity of Washington DC, Minneapolis, Atlanta, and Dallas. Unfortunately, the data are not detailed enough to show whether it is the same baby boomers who lived in these metropolitan areas in 1990 that have diffused outward into surrounding counties by 2003, but the maps suggest the possibility that such outward diffusion has occurred. In some cases, this diffusion seems to be confined to counties that are quite close to the metropolitan area; in other cases, diffusion may be taking place on larger spatial scales (for example, note that the dark areas in southern and central Michigan in Fig. 1 have “migrated” to the dark areas in northern Michigan in Fig. 5).
These findings are broadly consistent with findings about specific regions (for example, Plane and Heins (5) note the popularity of both the Ozarks and northern Michigan as migrant destinations) and with more general observations regarding regional population change. With respect to the latter, Plane et al. (6) suggest the importance of older individuals moving down the urban hierarchy, and Garreau (7) and others have commented on the importance of “edge cities” and the population growth that occurs near, but not in, major urban centers.
A caveat associated with these findings is that the effects of immigration have essentially been ignored here. Indeed, immigration to the coasts and immigration patterns that have bypassed the interior portions of the country have at least in part contributed to the patterns displayed in the figures. Still, the magnitude of internal migration at these spatial scales is greater than the magnitude of immigration, and the majority of the effects can likely be attributed to the former.
Geographical Perspectives on Intergenerational Relationships
The changing spatial distribution of the baby-boom cohort has many social, economic, and demographic consequences. A consequence of particular importance concerns intergenerational relationships, because there have been several studies that have reported that the geographic distance between parents and their offspring is the primary determinant of interaction between them (8, 9). This section focuses upon the spatial and temporal dimensions of intergenerational relationships between the baby boomers and (i) their parents, and (ii) their children.
Spatial Dimensions of Intergenerational Relationships. Plane and Rogerson (10) have noted that, whereas the baby-boom cohort exhibited lower-than-average mobility rates during their migration-prone, young-adult years, their migration efficiency (that is, their ability to effect regional population change through migration, as measured by the ratio of net to total migration) was relatively high. Despite such relatively high efficiency, the combination of low mobility rates and, more importantly, the fact that the majority of moves are short-distance moves (over half of all moves are <6-10 miles; see ref. 11) has meant that parents and their adult children are not separated by large distances. For example, Rogerson et al. (12) found that more than half of married individuals with both parents alive and living together lived within 10 miles of either their own parents, or their in-laws, and two-thirds lived within 25 miles. These spatial separations vary with education; those with a college education are separated from their parents by a median distance of 100 miles, whereas those without one have a median separation distance of just 15 miles, based on a sample size of >6,300. Spatial separation also varies with location; those living in the West live a median distance of 80 miles from their parents and individuals in the South and Midwest census regions live a median distance of 20 miles from their parents. The corresponding figure for respondents from the Northeast is 15 miles (12).
The consequences of these patterns for intergenerational relationships may be summarized as follows. For the majority of individuals, spatial separation between generations is not large, and therefore the effect of spatial separation on caregiving is not an important issue. This is not to diminish the importance of the significant impacts that distance can have on caregiving when it is an issue (e.g., for the college-educated). The relationship between spatial separation and distance also implies that a disproportionate share of caregiving falls upon those without a college education. It would be interesting to discern whether siblings provide complementary forms of assistance, with distant siblings providing more financial assistance and closer siblings providing relatively more assistance with physical and day-to-day tasks. Some evidence for this hypothesis comes from the National Survey of Families and Households [Lin and Rogerson (13)]. Through interviews with individuals, Climo (14) has explored some of the emotional issues that accompany large geographical separations between generations.
The lack of a perfect correspondence between distance and caregiving should also be noted. Interestingly, Lin and Rogerson (13) report that daughters live no closer to parents than do sons, yet Brody (15) has shown that daughters are more likely than sons to provide care.
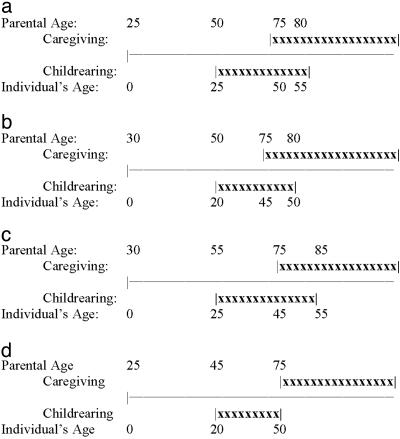
Temporal Perspectives: The Sandwich Generation and Stretched Periods of Caregiving. We next turn to the timing of caregiving. There is a general sense that delayed childbearing among baby boomers has increased the likelihood that they find themselves facing simultaneous caregiving demands from their parents and their children. To assess whether the duration of these demands is longer for baby boomers than for their parents, consider Fig. 6, which is a schematic of the timing of caregiving. Fig. 6a shows the years spent in potential caregiving for a baby-boom member born when his or her parents were 25 (and, because boomers' parents were having children at earlier ages, this individual is likely to be roughly in the middle of the birth order). Members of the baby-boom cohort typically had first children around age 25 and completed childbearing by age 35, implying that they were empty-nesters at age 55. At this time, the individual's parents were ≈80 years old. If we take 75 to be the year at which caregiving begins, there is a period of 5 years where simultaneous demands are placed on the baby boomer.
Fig. 6.
The timing of caregiving throughout the life course.
Contrast this picture with that in Fig. 6b, where the individual began having children at age 20 and completed childbearing at age 30. This person, representing the parent of the baby boomer, started childbearing at a relatively early age; she was born when her own parents were ≈30, which might be the case for a middle birth-order child as the baby boomers' grandparents delayed childbearing. This individual would also have simultaneous caregiving demands for a period of 5 years (from the time her parents turned 75, when she herself was 45, until she completed child rearing and became an empty-nester at age 50).
This crude analysis reveals that the timing itself places no additional demands on baby boomers. Increasing life expectancies, however, have implied that baby boomers' parents are more likely to be alive and in need of caregiving, relative to the situation faced by the boomers' parents. With regard to the average burden per person, baby boomers have more potential for spreading out care for their parents across a larger number of siblings, in comparison with the parental care demands faced by their own parents, who were members of a smaller cohort and consequently had fewer siblings (the notion of “burden” here should not necessarily be taken too literally, because selfless giving and reciprocity in intergenerational relationships are common).
Fig. 6c considers the possibility that the children of the baby boomers will also delay having children. In this case, the middle birth-order child with a baby boomer parent who is ≈30 years older will begin having children around age 25 and become an empty-nester at about age 55, when his parents are 85, thus creating the potential of a 10-year period of caring for children and parents. Thus, it is the children of the baby boomers who may find themselves truly sandwiched. In addition, the situation will be exacerbated by the fact that these individuals will have fewer siblings to share in the care of their baby boomer parents (relative to the situation faced by their baby-boomer parents, who had relatively more siblings to share in the caregiving). The difficulties that might soon face baby boomers with respect to receiving care from their children could easily be as great as any difficulties imposed by feeling sandwiched. As with many other phenomena that have affected the baby boom, the popular “crisis of the moment” that faces the generation changes as the generation ages. Without denying the sandwich demands placed on this generation, it is quite probable that these demands will be even greater on their children, and a looming crisis may be the relative difficulty in receiving support from their children.
To complete the picture, consider successive generations of individuals characterized by early childbearing (Fig. 6d). Middle children have parents who are about age 25; they begin having children around age 20 and become empty-nesters at about age 50. As the Fig. 6d indicates, there is no period of simultaneous caregiving in this scenario.
The concept of the baby boom as sandwich generation caught between the simultaneous need to care for parents and children may therefore be slightly overstated. The concept of the sandwich generation has been around at least since the early 1980s (16), and likely much longer [Miller (16) refers to the work of Litwak (17) in the mid-1960s]. Interestingly, the oldest parents of the baby boomers were turning 75 at the time of Miller's article, and the members of the biggest bulge in the cohort, born in 1957, were in the middle of their childbearing years. Thus, at the time of Miller's article, the generation was at the initial stage of the sandwich.
Although the notion of a sandwich generation may be somewhat overstated, it is notable that caregiving occurs over such a stretched period. A stretched period of caregiving is particularly likely for successive cohorts characterized by early childbearing (Fig. 6d), for whom the child rearing years are equal to ≈30 (from age 20 to age 50), plus the 12 years of life expected for a 75-year old (the parents of this cohort will be ≈75 when the cohort member becomes an empty-nester and the assumption is that cohort members will care for their parents until their parents' death). Generations like the baby-boom (Fig. 6a), can expect the total number of caregiving years to be shorter, approximately equal to 30 for child rearing, plus the 9 years of life expected for an 80-year old (because the individual's parent will be ≈80 years of age when the last child leaves home). Those born at the height of the baby boom in 1957 are now 48 years old; the modal age of their offspring is 23, and the modal age of their mothers is ≈70. Although the majority of baby boomers have become, or are about to become, empty-nesters, they are just beginning to grapple with care issues associated with their parents. Finally, successive generations characterized by late childbearing, as may be the case with the children of the baby boomers, have a relatively lower expectation for the number of caregiving years (30, plus the 7 years of life expected for an 85-year-old), despite having the greatest number of years with simultaneous responsibilities. Perhaps more important than a 5- or 10-year period of simultaneous caregiving is the more basic fact that caregiving itself can easily be stretched >40 years or more.
Summary
We have examined the current and recent spatial distribution of the large baby-boom cohort born between 1946 and 1964. In 1990, members of this cohort were clustered predominantly in county populations along the east and west coasts. A small number of metropolitan areas also had large percentages of baby boomers in their populations. By 2003, the locations with large percentages of baby boomers had shifted, primarily to areas surrounding large metropolitan areas and to many northern areas of the country, including New England, the northern Rocky Mountain region, and the northern parts of Wisconsin and Minnesota. Many of these changes were brought about by the net in-migration of baby boomers to these regions and by net out-migration away from their bicoastal and metropolitan locations of 1990. The Midwest also witnessed an increase in the fraction of their populations made up of baby boomers, but this increase was due more to the out-migration of younger cohorts.
These changes in spatial distribution have many consequences, and, in this article, we have focused upon both the spatial and temporal dimensions of intergenerational relationships. Although spatial separation between generations is not great because of the relatively short distances moved by the majority of movers, it is significant for many, particularly the college-educated and those living in the West. With regard to the timing of intergenerational caregiving, although it is true that members of the baby-boom cohort are sandwiched between simultaneous support of children and parents, the demands of simultaneous caregiving are likely to be even greater for the children of baby boomers. In addition, because baby boomers have had fewer children than their parents, the spatial distribution of aging baby boomers and the nature of their spatial separation from their (relatively few) children will become even more important during the next few decades. Also important is the fact that intergenerational caregiving is stretched over a significant portion of the life course. Periods of 40 years of caregiving, first to children, then simultaneously to children and parents, and then to parents, are not uncommon, and the effects in social and economic terms deserve additional study from this perspective.
Acknowledgments
We thank W. A. V. Clark, Susan Hanson, David Plane, and an anonymous reviewer for helpful suggestions.
Author contributions: P.A.R. designed research; P.A.R. and D.K. performed research; D.K. analyzed data; and P.A.R. wrote the paper.
Conflict of interest statement: No conflicts declared.
This paper was submitted directly (Track II) to the PNAS office.
References
- 1.Byerly, G. & Rubin, R. E. (1985) The Baby Boom: A Selective Annotated Bibliography (Heath, Lexington, MA).
- 2.Russell, C. (1987) 100 Predictions for the Baby Boom, (Plenum, New York).
- 3.Gillon, S. (2004) Boomer Nation: The Largest and Richest Generation Ever, and How it Changed America (Simon and Schuster, New York).
- 4.Rogerson, P. (1999) in Migration Restructuring in the United States: A Geographic Perspective, eds. Pandit, K. & Withers, S. D. (Rowman and Littlefield, New York), pp. 174-192.
- 5.Plane, D. A. & Heins, F. (2003) Ann. Reg. Sci. 37, 107-130. [Google Scholar]
- 6.Plane, D. A., Henrie, C. J. & Perry, M. J. (2005) Proc. Natl. Acad. Sci. USA 102, 15313-15318. [DOI] [PMC free article] [PubMed] [Google Scholar]
- 7.Garreau, J. (1991) Edge City: Life on the New Frontier (Doubleday, New York).
- 8.Crimmins, E. & Ingegneri, D. G. (1990) Res. Aging 12, 3-35. [DOI] [PubMed] [Google Scholar]
- 9.Kivett, V. R & Atkinson, M. P. (1984) J. Gerontol. 39, 499-503. [DOI] [PubMed] [Google Scholar]
- 10.Plane, D. & Rogerson, P. (1991) Prof. Geogr. 43, 416-430. [Google Scholar]
- 11.Rogerson, P. (1990) Math. Popul. Stud. 2, 229-238. [DOI] [PubMed] [Google Scholar]
- 12.Rogerson, P., Weng, R. H. & Lin, G. (1993) Ann. Assoc. Am. Geogr. 83, 656-671. [Google Scholar]
- 13.Lin, G. & Rogerson, P. (1995) Res. Aging 17, 303-331. [Google Scholar]
- 14.Climo, J. (1992) Distant Parents (Rutgers Univ. Press, New Brunswick, NJ).
- 15.Brody, E. (1985) Gerontologist 25, 19-29. [DOI] [PubMed] [Google Scholar]
- 16.Miller, D. (1981) Soc. Work 26, 419-423. [Google Scholar]
- 17.Litwak, E. (1965) in Social Structure and the Family: Generational Relations, eds. Shanas, E. & Streib, G. F. (Prentice-Hall, Englewood Cliffs, NJ), pp. 290-323.


