

Abstract
We used modified immunocytochemical conditions to quantify a membrane form of estrogen receptor-α (mERα) in a rat pituitary tumor cell line, GH3/B6/F10. We studied the regulation of mERα vs. levels of intracellular ERα (iERα) using our 96-well plate immunoassay. The anti-ERα antibody C542 was used to label the ERα (via conjugated alkaline phosphatase) in fixed permeabilized (for iERα) vs. nonpermeabilized cells (for mERα). Expression of mERα was highest at low cell densities (<1000 cells/well) and decreased significantly at densities where cellular processes touched, whereas the more abundant iERα increased with increasing cell density over the same range. Serum starvation for 48 h caused increases in mERα, whereas iERα levels showed no significant changes. A large decline in mERα and iERα levels with cell passage number was observed. Minutes after nM 17β-estradiol (E2) treatment, a portion of the cells rounded up and detached from the culture plate, whereas nM cholesterol had no such effect. Although E2 treatment did not change mERα levels, the antigen was reorganized from a fine particulate to aggregation into asymmetric large granules of staining. That common culturing conditions favor down-regulation of mERα may explain the relatively few reports of this protein in other experimental systems.—Campbell, C. H., Bulayeva, N., Brown, D. B., Gametchu, B., Watson, C. S. Regulation of the membrane estrogen receptor-α: role of cell density, serum, cell passage number, and estradiol.
Keywords: estrogens, nongenomic effects of steroids, rapid, nuclear receptors
Several members of the steroid receptor family have isoforms located intracellularly and in the membrane (reviewed in ref 1). Studies of the membrane form of the glucocorticoid (2), estrogen (3–6), and progesterone (7) receptors have shown that the membrane versions can be related to the intracellular form of the receptor. In other systems, however, data have been interpreted to suggest that membrane steroid receptors are unique proteins unrelated to nuclear receptors (1). Whereas the membrane and intracellular forms may or may not be related, they play different roles in the cell (1, 8). Nuclear steroid receptors are involved in synthetic genomic functions that occur over extended periods whereas the proximal actions of membrane steroid receptors have been associated with rapid, non-genomic signaling functions (1–4, 7, 9).
The membrane estrogen receptor-α (mERα) has been identified in multiple systems (10–12) and has been correlated with rapid responses to estrogen, including calcium release (13), prolactin release (9, 12, 14–16), MAP kinase activation (6, 17–19), and cell proliferation (6, 20). In some of these studies, immunocytochemical evidence suggests that mERα and the intracellular estrogen receptor-α (iERα) are closely related (4, 9, 17) and originate from the same genetic coding sequence (4–6). Our studies have focused on mERα in the rat pituitary tumor cell line GH3/B6 (3, 4, 12, 15). Using live- and fixed-cell immunocytochemical techniques, we identified a subclone, GH3/B6/F10 (F10) with high mERα expression levels (12). We recently developed a plate assay combining our immunocytochemical methodology with the soluble alkaline phosphatase product para-nitrophenol (pNp) (21). This assay allows quantification of the amount of mERα present in this subclone and direct comparison with the amount of iERα in permeabilized cells (4).
In earlier studies we demonstrated that the mERα is a dynamic protein whose expression varies greatly under different experimental conditions (12, 15). In this paper, we use our quantitative assay to examine the regulation of the mERα by such common culture variant factors as cell density, serum starvation, and cell passage number. For a comparison with the mERα, we examined regulation of the iERα with respect to these same parameters, using almost identical methodologies. Cellular rapid responses, mERα levels, and expression patterns, as perturbed by brief treatment with 17β-estradiol (E2) treatment, were also assessed.
MATERIALA AND METHODS
Ham’s F-10 medium and phenol red-free DMEM were purchased from GIBCO-BRL (Grand Island, NY). All sera were obtained from Hyclone (Logan, UT). Cytoseal 280 and a 25% stock solution of glutaraldehyde were from Electron Microscopy Services (Ft. Washington, PA). Biotinylated universal anti-mouse/rabbit IgG, VECTASTAIN ABC-AP (avidin:bioti-nylated enzyme complex with alkaline phosphatase as the detection system), levamisole, Vector Red, and para-nitrophenylphosphate (pNpp) were from Vector Laboratories (Burlingame, CA). The anti-estrogen receptor-α antibody C542 (raised against residues 582–595 of human ERα) (22) was provided by Drs. Dean Edwards and Nancy Weigel; this antibody is now commercially available from StressGen (Collegeville, PA). All other reagents were purchased from Sigma (St. Louis, MO). Please note that since the non-ionic detergent Nonidet P-40 is no longer produced, IGEPAL CA-630 is recommended as an acceptable substitute.
Cell culture
GH3/B6/F10 cells were subcloned from GH3/B6 cells (obtained from Dr. Bernard Dufy; Universitie de Bordeaux II, Bordeaux, France) by limited dilution and found to be enriched for mERα as determined by live cell labeling with the ERα R3 antibody (12). Cells used in these studies were from passages 3 through 25. The GH3/B6/F10 cells were routinely maintained in Ham’s F-10 medium supplemented with 12.5% heat-inactivated equine serum, 2.5% defined-supplemented calf-serum, and 1.5% FCS at 37°C in 5% CO2. We have often observed that cells grown in sera-supplemented medium have lower levels of mERα compared with serum-starved cells. Therefore, in some experiments the cells were transferred to a defined medium consisting of DMEM containing 5 μg/mL insulin, 5 μg/mL transferrin, 5 ng/mL sodium selenite, 0.1% BSA, 20 mM sodium pyruvate, and 25 mM HEPES.
96-well plate assay
Cells were trypsinized and plated at a density of 1000 cells per well for most of these studies; for density experiments, cells were seeded at densities ranging from 100 to 6000 cells per well. For growth on poly-d-lysine-coated plates, 100 μL of 10 μg/mL poly-d-lysine was incubated in each well for 10 min; excess poly-d-lysine was removed and the wells were rinsed twice with 200 μL PBS before cells were plated.
Two days after plating, the sera-supplemented Ham’s F-10 medium was removed and cells were serum-starved for 48 h in the defined medium. For experiments in which the effects of serum starvation were examined, sera-supplemented medium was removed and the cells were cultured in defined medium for 24, 48, 72, and 96 h. The defined medium was removed by turning each plate upside down and flicking it side to side, then up and down to remove all remaining liquid; this method was used for all reagent removal steps. E2 was solubilized in 0.001% ethanol in the defined medium. For the E2 exposure experiments, vehicle or E2 was removed after 1, 3, 15, 30, or 60 min and the cells were washed once with PBS. For cell attachment experiments, cholesterol was prepared similarly to E2 and added to the cells at varying concentrations for 3 or 60 min. Membrane antigens were preserved by fixing cells with 50 μL/well of 2% para-formaldehyde, 0.1% glutaraldehyde (P/G) in PBS, pH 7.4, for 30 min at room temperature. Intracellular antigens were exposed by permeabilizing the cells with the addition of 0.5% Nonidet P-40 and 0.15 M sucrose to the P/G fixative; cells were thus fixed and permeabilized for 30 min. Fixation was followed by two PBS washes (5 min each) delivered to the plate using a Combi Cell Harvester (Skatron Instruments Inc., Leucadia, CA). Free reactive aldehyde groups were reduced using 50 μL/well 13 mM NaBH4, 70 mM NaHPO4 in ddH20 for 15 min at room temperature, followed by two PBS washes (5 min each). Nonspecific antibody binding was blocked with 350 μL/well 0.1% coldwater fish skin gelatin in PBS, at room temperature for 45 min. The primary antibody (C542) was diluted to 1 μg/mL in 0.1% gelatin in PBS and incubated with the cells overnight at 4°C; this primary antibody concentration was chosen because it had been found to be optimal for immunocytochemical use (15) and for saturation of the epitope in the plate assay (21). The unbound primary antibody solution was then removed and a brief PBS rinse was followed by three PBS washes (5 min each). Cells were incubated for 1 h at room temperature with 50 μL/well of 5 μg biotinylated secondary antibody per milliliter of 0.1% gelatin in PBS. After three PBS washes (5 min each), cells were incubated with 100 μL Vectastain ABC-AP. Nonpermeabilized cells were washed five times with PBS (5 min each) whereas permeabilized cells required four washes with 0.1% Nonidet P-40 in PBS (5 min each), followed by a single 5 min wash in PBS. The Vectastain substrate solution was prepared immediately before use by mixing 500 μL of 100 mM pNpp with 10 mL of 100 mM sodium bicarbonate, then adding 40 μL of 125 mM levamisole to inhibit generation of pNp by endogenous alkaline phosphatase present in our cells (21); the final concentrations were 5 mM of pNpp and 0.5 mM of levamisole. Vectastain substrate solution (100 μL) was then added to each well, and the plates were incubated in the dark in a SpectraMax Plus Microplate Spectrophotometer (Molecular Devices Corporation, Sunnyvale, CA) at 37°C. Hydrolysis of pNpp was monitored at 405 nm in the dark for up to 30 min at 37°C, with the caveat that the instrument could not quantitate absorbance (A405) readings of >2. We used readings taken at 15 min, previously determined to be well within the linear range of the assay (21).
Determination of cell number, density-based growth patterns, and normalization of receptor levels to cell number
To allow normalization of the pNp A405 readings to cell number in individual wells, the crystal violet (CV) assay (23–25) was performed on the same plates to measure cellular protein levels. Comparison of GH3/B6/F10 cell counts via hemocytometer to CV absorbances confirmed a linear relationship between CV absorbances and cell number (C. H. Campbell and C. S. Watson, unpublished observation). The pNp solution was removed and two 5 min washes were performed in ddH2O. Cells were incubated for 30 min at room temperature in 50 μL 0.1% crystal violet (filtered within 2 wk of use to remove crystallized dye). After three brief washes with ddH2O to remove unbound dye, absorbed dye was released with 50 μL 0.2% Triton X-100 during a 30 min incubation at room temperature. The absorbance was then measured at 562 nm (A562). When cells were grown on poly-d-lysine-coated plates, only a portion of the crystal violet dye was solubilized with Triton X-100 (C. H. Campbell, B. Jakubas, and C. S. Watson, unpublished observation), so the dye was released with a 15 min incubation with 10% acetic acid and absorbance was measured at 590 nm (A590) (25). The pNp A405 readings were divided by the CV A 562 or CV A590 readings, yielding a value representative of the number of receptors per cell. The relative levels of mERα and total ERα in the F10 subclone were determined with this method, and values for the iERα were obtained by subtracting the mERα (unpermeabilized) values from the total ERα (permeabilized) values. The percentages of cells scored in each growth pattern (Fig. 1c) were determined by counting 16 wells (2 fields each). All controls were performed on separate plates because E2 caused the cells in non-E2-treated wells to detach from the culture plate. The extent of E2’s effect on cell attachment was determined by calculating the percent difference from control. Data points > 2 SD from the average were excluded. Data were compared for significance of differences using SigmaStat 2 (Jandel Scientific, San Rafael, CA). A one-way ANOVA test was followed, where appropriate, by a Tukey test.
Figure 1.
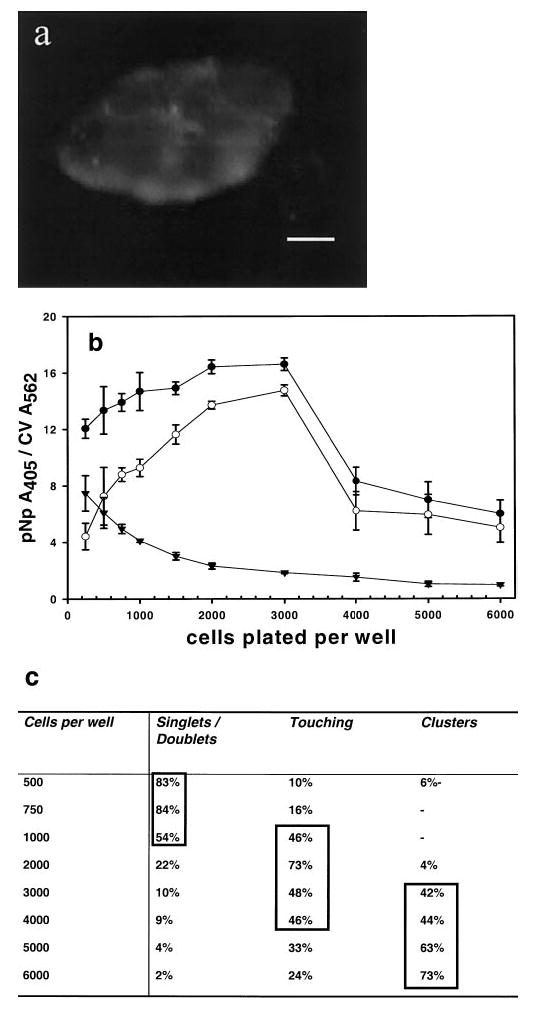
Expression of the mERα and iERα is dependent on cell density. a) A group of cells with mERα staining along the edge of the clump. The bar represents 10 μm. b) Cells were plated at the indicated densities and total ER-α (^), mERα (▾), and iERα (○) were measured at each density. Expression of mERα decreased significantly at densities of ≥ 1500 cells/well, P < 0.001. Expression of iERα at 3000 cells per well was significantly different from expression levels on cells plated at 250-1000 cells per well and ≥ 4000 cells/well, both P < 0.001, as determined by the ANOVA and Tukey test. Error bars are ± se. c) Two fields of cells in each well were counted and scored according to their growth pattern. Cells that grew as singlets or doublets, cells that touched other cells, and those that grew in multicell clusters were the three patterns scored. Percentages > 40 are boxed to show where the majority of cell morphologies fall.
Determination of cell viability and plating capacity after E2 treatment
To check the viability and growth potential of E2-detached cells, we plated the cells in 25 cm2 flasks and applied 1 nM E2 for 5, 10, 15, and 30 min. After E2 exposures as indicated, we collected the medium from each flask and pelleted the detached cells (5 min at 500 g). Cells from each group were then resuspended in F10 medium and cell number was measured with a hemocytometer. Viability of the cells was determined by trypan blue exclusion assay, then each group of cells was plated in a separate well of a 6-well plate. After 5 h of incubation, the medium was collected from each well and the number of cells floating (not attached) was calculated with another hemocytometer reading. The percentage of plated cells able to attach to new plate was calculated by comparative hemocytometer readings.
Immunocytochemistry
Coverslips were placed into T-75 flasks and cells were plated in the flasks. After 48 h, the sera-supplemented medium was removed and cells were incubated in defined medium for 72 h. After 72 h, the defined medium was removed and cells were exposed to either vehicle (0.001% ethanol in defined medium) or 10 nM E2 (in vehicle) for 3 or 60 min. At the end of this incubation period, the medium was removed and cells that had come unattached were recovered by cytocentrifugation at 800 rpm for 5 min (low acceleration setting) in a Cytospin 3 cytocentrifuge (Shandon, Pittsburgh, PA).
Cells still adhering to the coverslips, and those recovered via cytocentrifugation, were fixed for 30 min at room temperature with the P/G fixative. After two PBS washes (5 min each), free reactive aldehyde groups were reduced using 13 mM NaBH4, 70 mM NaHPO4 in ddH2O for 15 min at room temperature, followed by two PBS washes (5 min each). Nonspecific antibody binding was blocked with 0.1% coldwater fish skin gelatin in PBS at room temperature for 45 min. C542 was diluted to 1 μg/mL in 0.1% gelatin in PBS and incubated with the cells overnight at 4°C.
After the unbound primary antibody was removed and samples were rinsed twice with PBS, they were incubated with 5 μg biotinylated secondary antibody per milliliter of 0.1% gelatin in PBS. Three PBS washes (5 min each) were followed by incubation in Vectastain ABC-AP for 1 h. Cells were then washed three times with PBS (5 min each). The Vector Red alkaline phosphatase substrate was prepared immediately before use according to the manufacturer’s instructions. To each 10 mL of substrate solution, 40 μL of 125 mM levamisole was added to inhibit endogenous alkaline phosphatase; the final levamisole concentration was 0.5 mM. The Vector Red substrate solution was then added to each coverslip; after a 5 min incubation, the substrate solution was removed and cells were rinsed with ddH2O. Samples were then dehydrated with two changes (30 s each) of 70% ethanol, followed by two changes (30 s each) of 100% ethanol. Coverslips were cleared in three xylene washes (3 min each) and mounted with Cytoseal 280. Slides were examined using a Leitz Wetzlar Orthoplan microscope with a rhodamine filter. Fluorescence images were captured at 200× magnification, with an exposure setting of 1/2, using an Optronics Engineering DEI750 digital image capture system.
RESULTS
Cell density affects expression of mERα and iERα
We observed that cells growing in clumps were predominantly labeled for mERα on cells growing at the outer edge of the clumps (Fig. 1a). Because this might indicate higher expression on cells, which have less contact with adjacent cells, we examined the effect of cell density on mERα expression and found that expression of mERα and iERα was dependent on cell density (Fig. 1b). When cells were plated sparsely (<1500 cells/well), mERα expression was at its highest. At plating densities of ≥ 1500 cells per well, there was a significant decline (P<0.001) in mERα expression that occurred when singlet or doublet cells branched out to touch other cells via long, thin processes; this decrease in mERα levels remained as the cells became confluent. At low cell densities, iERα was present at levels much lower than mERα, but as plating densities were increased to 3000 cells per well, iERα levels became almost sevenfold greater than mERα levels. Cells plated at very high densities (≥4000 cells/well) exhibited a significant decrease in expression of iERα as well (P<0.001). Despite the dramatic changes in mERα and iERα expression, total ERα expressed did not change significantly at densities of 250–3000 cells per well.
Cells were scored on the following categories of growth patterns: singlets or doublets (two cells touching extensively, apparently having just divided), cells touching via processes, and cells clustered in multicell groups. When cells were least dense, growing mostly as singlets or doublets, they expressed the highest level of mERα; when single or doublet cells touched or formed clusters, mERα expression decreased significantly (P<0.001; Fig. 1b, c). Immunocytochemistry confirmed that cells growing singly or in small groups (several cells) expressed a great amount of mERα over the entire cell surface. The outer edges of cell clusters expressed mERα more abundantly (Fig. 1a).
Length of serum starvation affects the amount of mERα expressed
Previous immunocytochemical measurements of mERα via live cell labeling showed an increase in mERα levels cultured for some time in defined medium (12, 15). We addressed this question quantitatively in F10 cells using our plate assay. Levels of the mERα and iERα were compared when cells were grown in serum-replete medium vs. serum-starved conditions for 24, 48, 72, or 96 h. The only significant increase in mERα was observed after cells were serum-starved for 48 h (P<0.001; Fig. 2a). A comparison of iERα expression in cells grown in serum-replete medium vs. those serum-starved showed no significant difference in the amount of iERα detected at each point (Fig. 2b). Compared to cells serum-starved for 48 h, however, cells serum-starved for 96 h showed a significant decrease in mERα and iERα levels (P<0.001); these decreases may be due to a lack of necessary nutrients or growth factors after 96 h in serum-deprived medium. Though decreases were observed in receptor levels in cells grown in serum-replete medium, those decreases might also be influenced by the much higher cell densities achieved with longer periods in culture.
Figure 2.
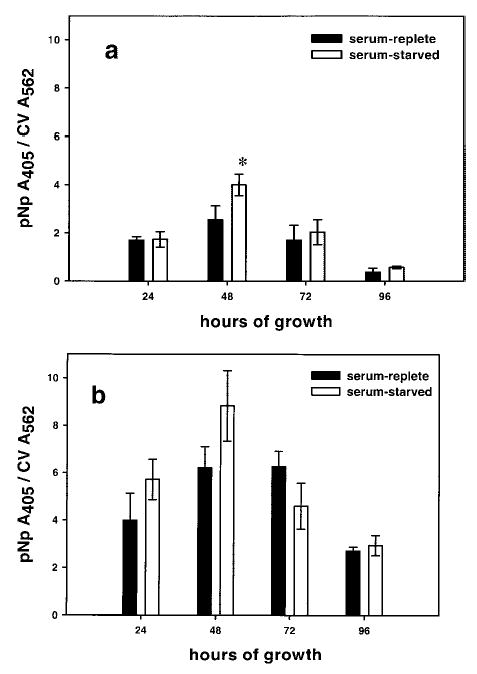
Serum starvation enhances the amount of mERα protein expressed. a) Comparison of cells grown in serum-replete vs. serum-starved media reveals that at 48 h, the mERα signal in serum-starved cells is significantly greater than the signal in cells grown in serum-replete media, P < 0.001, as determined by ANOVA and Tukey tests. Error bars are ± se. b) Serum starvation does not significantly enhance iERα expression. Error bars are ± se.
Increases in cell passage can alter expression of the mERα
We noticed that F10 cells at high passage numbers appeared to express little to no mERα. The pNp assay was used to confirm these early qualitative observations. Cells closest in passage number to the initial separation and isolation of the F10 subclone tended to express more mERα than cells that were subcultured for longer periods (Fig. 3a). There were some exceptions, perhaps attributable to other, as yet unknown parameters. Comparison of data for mERα, iERα, and total ERα showed that cells assayed for ERα earlier than passage 11 expressed significantly more of both receptor subtypes than cells at later passages (passage 15 or greater, P<0.001; Fig. 3b).
Figure 3.
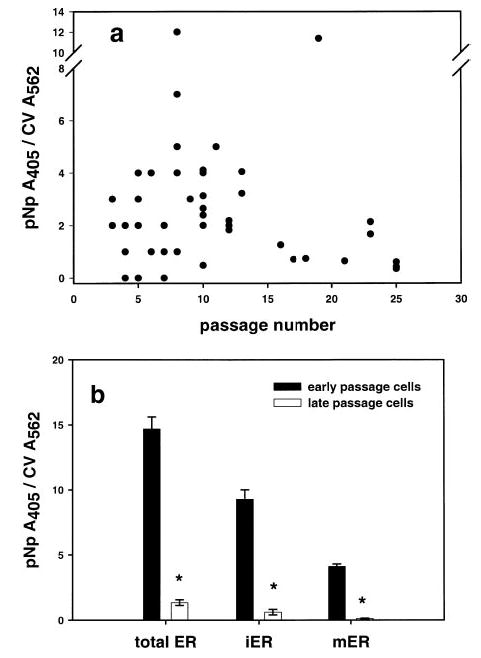
The expression of ER-α decreases with passage number. a) Data from 69 experiments show that as cells are propagated longer in culture, expression of mERα decreases. b) Expression of both forms of the ER-α is dependent on passage number. Early (before passage 11) and late passage cells (passage 15 and above) were compared for total ER-α, iERα, and mERα levels. *Significant differences between early and late passage ER-α levels, P < 0.001, as determined by ANOVA and Tukey tests. Error bars are ± se.
E2 treatment rapidly alters cell adherence
We previously detected mERα in the absence of E2 (using defined media), so we sought to examine the effect of acute E2 exposure on mERα expression in F10 cells. We collected crystal violet data in each plate assay experiment to normalize pNp receptor values to cell number. Comparison of the crystal violet data between E2-treated and untreated cells revealed that E2 treatment affected the number of cells remaining attached to the plate at the end of each experiment. We knew this could not be due to the mechanics of the assay itself, as we have already shown that untreated cells remain well attached throughout the assay (21). A significant decrease in cell number was observed when cells were treated with 1 nM E2 for 1 h compared with vehicle controls (P<0.001; Fig. 4a). Exposure times as short as 1–3 min consistently resulted in a 10–13% decrease in cell number. Hour-long exposure to E2 concentrations ranging from 10−7 to 10−15 M induced detachment of 20–30% of the cells from the plates (Fig. 4b). Further examination revealed that untreated wells located up to several rows away from the E2-treated wells experienced at least a 10% loss of cells, and wells in rows adjacent to E2-treated cells suffered greater losses of up to 35% (Fig. 4c). Samples from experiments previously believed to have demonstrated no E2 effect were then compared with controls from non-hormone-treated plates from the same preparation. In all cases, these comparisons revealed that when any row of wells on a plate was treated with E2, almost all of the wells experienced some loss of cells. Therefore, we found it necessary to use separate, non-E2-treated plates for the vehicle control conditions as opposed to including vehicle controls on the same plate as the E2 exposed samples. E2 specificity of this occurrence was tested by exposing cells to cholesterol at concentrations from 10−7 to 10−15 M for 3 or 60 min. There was no resultant decrease in cell adhesion (data not shown).
Figure 4.
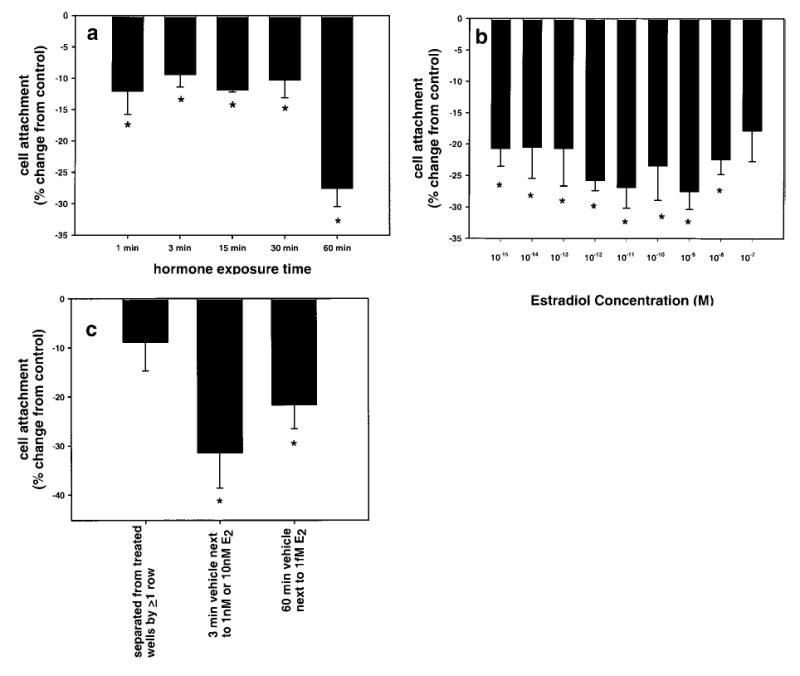
E2 treatment induces cells to detach from the culture plate. a) Exposures to 1 nM E2 of 1–60 min. *Significant difference from control, P < 0.05, as determined by ANOVA and Tukey tests. Error bars are ± se. b) 1 h. E2 treatments at concentrations from 10−8 to 10−15 cause significant detachment of cells from the culture plate. *Significant difference from control, P < 0.05, as determined by ANOVA and Tukey tests. Error bars are ± se. c) E2 causes cells in adjacent untreated wells to lift off the plate. *Significant difference from control, P < 0.05, as determined by ANOVA and Tukey tests. Error bars are ± se. All vehicle controls were performed on a separate plate. The mean CV A562 control value for these experiments was 0.1146 ± 0.0048 (se).
Cytocentrifugation of medium removed from E2-exposed cells confirmed that cells were lost with E2 treatment; cells recovered via cytocentrifugation are referred to as “detached cells.” After 3 min of treatment with 10 nM E2, the detached cells isolated were either single cells or small clusters (Fig. 5h). After 60 min of 10 nM E2 treatment, however, the majority of the detached cells were grouped in large clusters (Fig. 5j). Examination of the corresponding (60 min) E2-exposed cells that were still attached revealed many stained cellular “footprints” and left-behind membrane fragments where cells had previously been attached (26) (Fig. 5f). These cell “tracks” were not observed among cells remaining adherent after a 3 min exposure to E2 (Fig. 5d).
Figure 5.
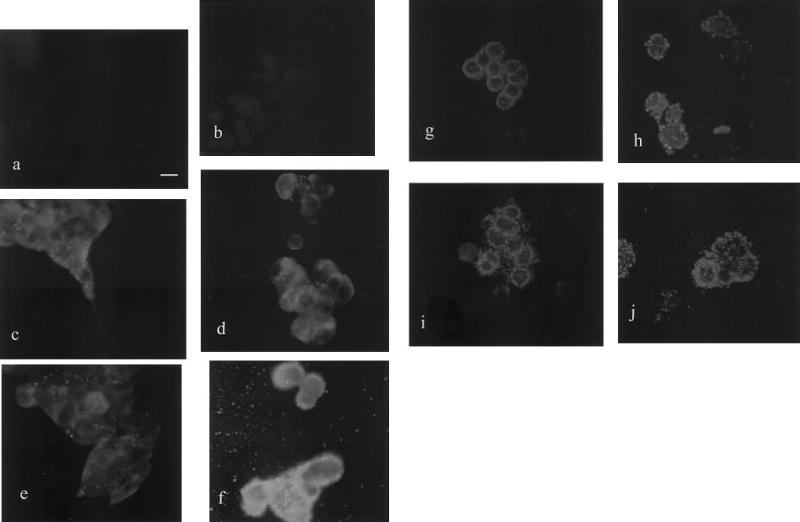
The effects of E2 and attachment status on cell shape and mERα staining pattern. Cells were grown on coverslips and treated with E2 or vehicle for 3 or 60 min. Controls performed included exclusion of primary antibody (a) and exclusion of primary and secondary antibodies (b). Remaining left panels show cells treated with vehicle that remained attached after 3 (c) and 60 (e) min and those cells that detached after 3 (g) and 60 (i) min. The panels on the right show cells treated with E2 that remained attached after 3 (d) and 60 (f) min and those that detached after 3 (h) and 60 (j) min. a) Bar represents 10 μm; all panels are at the same magnification.
E2 treatment induces aggregation of the mERα in a time-dependent manner
The mERα staining pattern was altered on cells treated with E2, and the degree of alteration was dependent onthe length of E2 exposure. After 3 min of E2 treatment, mERα on attached cells had shifted to one side of the cell surface and the label appeared as large punctate granules interspersed with very fine dots (Fig. 5d). After 60 min of E2 treatment, the entire surface of the attached cells was labeled evenly with large granules, which appeared in greater number around the periphery of the cells (Fig. 5f); the staining is especially apparent on blebs extending from the cell surface.
Immunocytochemical staining of detached cells that had been exposed to E2 for 3 and 60 min revealed that the mERα antigen was present as concentrated aggregates of staining. After 3 min, staining was observed as large granules along the entire periphery of the cell, with granules occasionally confined to one edge of the cell (data not shown) and as fine punctate labeling across the cell surface (Fig. 5h). After 60 min of hormone treatment, large granules were observed to be evenly distributed across the surface of all cells (Fig. 5j).
E2 alters cell shape and morphology
Since E2 treatment caused cells to detach from the culture dish, we monitored coincident changes in morphology between adherent and detached cells. The cytoplasm of the non-E2-treated cells was spread out and the cells were found to have long cytoplasmic extensions (Fig. 5, panels c, e, g, i). E2-treated cells, however, were very round with few cytoplasmic extensions (Fig. 5, panels d, f, h, j). We observed the cytoplasm of these cells to be a thin rim surrounding the nucleus, with some smaller, peripheral bleb-like extensions of cytoplasm. E2-treated cells that remained attached to the coverslip tended to be flatter than the control cells, causing the nucleus to protrude markedly from the rest of the cell. All of the morphological changes described were present after E2 treatment for 3 and 60 min, but were more pronounced at 60 min.
Attachment status affects mERα distribution pattern
Comparison of cells still attached after vehicle treatment vs. those that became detached revealed differences in the organization, but not the appearance, of the mERα label. The majority of mERα signal on vehicle-treated, attached cells was dispersed as fine dots, distributed irregularly and asymmetrically on the cell surface, especially along the edge of a clump (Fig. 5c, e). Detached cells of the same treatment group displayed regular staining as fine dots distributed evenly across the cell surface that were most apparent about the cell’s periphery (Fig. 5g, i). A similar shift from the asymmetric staining seen in attached cells, to even distribution on detached cells, occurred in the E2-treated groups. The detached cells appeared to have lost their orientation, allowing the antigen to be redistributed evenly across the now unpolarized cell surface.
E2-detached cells are viable and can be replated
Most cells that detached from the flask after 5, 10, 15, and 30 min E2 treatment were viable according to their exclusion of trypan blue dye (94%). Most of the detached cells (75–80%) were able to attach to a new substrate after 5 h in fresh medium (see Table 1).
TABLE 1.
Viability and subsequent attachment of E2-detached cellsa
| Time of treatment with 1 nM E2 | % cells detached | % viability (trypan blue exclusion) | % of cells that reattached after 5 h in new medium |
|---|---|---|---|
| 0 | 2.4 | 50 | 0 |
| 5 | 11.2 | 86 | 79 |
| 10 | 11.2 | 100 | 79 |
| 15 | 13.6 | 89 | 82 |
| 30 | 13.6 | 100 | 65 |
Cells were treated with 1 nM E2 for varying times of up to 30 min. Detached cells were recovered and tested for viability and the ability to attach to a new substrate.
E2 treatment does not alter the amount of mERα expressed
Although immunocytochemical studies revealed that the mERα staining pattern changed with E2 exposure, it was difficult to assess quantitative changes visually. Because E2 treatment induced cells to detach from the culture plate, poly-D-lysine was used to anchor the cells to the 96-well plates so that we could assay the mERα content of all treated cells. Cells grown on this substrate did not lift off the plate when treated with 10 nM E2 for either 3 or 60 min (Fig. 6a). Assay of the mERα status in these same cells showed that treatment with 10 nM E2 did not alter the amount of mERα expressed per cell (Fig. 6b).
Figure 6.
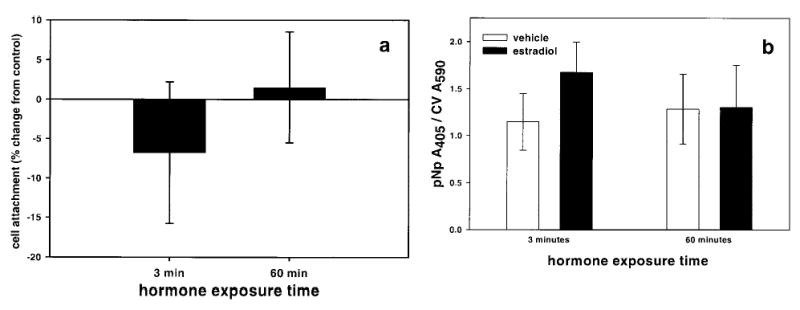
Effect of E2 on cell attachment and mERα expression on cells grown in wells coated with poly-d-lysine. a) Cells grown on poly-d-lysine do not detach with 10 nM E2 treatment. Each bar is the average of 4 experiments, 16 wells per experiment. Error bars are ± se. Mean CV A562 control values were 0.1107 ± 0.0197 (se) at 3 min and 0.1214 ± 0.0088 at 60 min. b) Treatment with 10 nM E2 does not alter mERα expression levels detected with the C542 antibody in anchored cells. All vehicle controls were performed on a separate plate. Each bar is the average of seven experiments, 16 wells per experiment. Error bars are ± se.
DISCUSSION
Characterization of factors that regulate the mERα may lead to a new understanding of its role in biological processes. The data presented here demonstrate how cell–cell interactions, serum, and hormonal factors affect ERα (nuclear and membrane) expression. Past studies have focused on measurements of the intracellular forms of the estrogen receptors and have showed that dynamic expression of the ERs plays a role in development, hormonal cycling in females, behavior, and progression of endocrine cancers. For example, expression of estrogen receptors in specific regions of the brain peaks 7 days after birth in neonatal rats. Soon after weaning, staining patterns for estrogen receptors change to reflect those found in adult rat brains (27). Levels of estrogen receptors in the pituitary glands of female rats fluctuate with the different stages of the estrous cycle (28). As breast cancers become more invasive, their growth and metastasis typically become hormone independent; only 40% of these non-E2-responsive cancers remain estrogen receptor positive (29). Though these data demonstrate that receptor dynamics influence biological functions, the role of the mERα in these processes is not understood. An important role for the mERα is suggested by its apparent high turnover rate. Antisense treatment blocks mERα expression entirely whereas iERα expression is barely affected during the same time frame (4). Since mER and iER appear to come from the same gene sequence, differential expression may be due to differences in alternate splicing or translational control, as seen with the glucocorticoid receptor (30, 31), or may be the result of post-translational modifications or interacting comodulator proteins (reviewed in ref 32). Improved methods of separately quantitating the mERα and the iERα will allow us to elucidate the separate or coordinate roles of these steroid receptors in biological processes.
Significant changes in mERα expression with cell density may indicate that the mERα plays a role in cell proliferation, particularly when the amount of mERα plunges to almost undetectable levels as cells begin to make contact with each other. At higher cell densities, the iERα becomes the predominant form of ERα and perhaps is better suited to perform the signaling required for gene expression and cell maintenance. This idea is further supported by immunocytochemical data for each receptor subform. Expression of the mERα varies according to the cells’ position in a cluster. Cells located on the outer edges of a clump of cells are least restricted by cell–cell contacts, express the most mERα, and are in a position to proliferate and expand the cluster, whereas cells at the center of a clump of cells express less mERα and rarely, if ever, replicate. In contrast, all of the cells within a cluster express similar amounts of iERα (21). Our work shows the importance of determining mERα and iERα signals separately instead of combining both signals as total ERα. If only total ERα expression were examined at the lowest cell densities (250–3000 cells/well), the dependence of any particular form of ERα expression on cell density would be missed. Other investigators have correlated the expression of greater levels of estrogen receptors with increasing cell density (33, 34), but the focus of those steroid binding studies was on the iER. In those studies of high-affinity binding sites for estrogens, ERα and ERβ were probably detected, as Sertoli and endometrial epithelial cells have since been shown to express ERβ in many species (35–37). Although ERβ has been found in the GH3 pituitary cell line (38), we have shown that the GH3/B6/F10 subclone does not express this form of the estrogen receptor (4, 21). Our study is the first systematic characterization of cell density vs. the expression of ERα at densities low enough to encompass changes in cell growth patterns representing the change from individual cells to those that touch one another by cytoplasmic processes and to those sharing significant borders in larger clusters.
When first characterizing mERα expression in GH3/B6 cells, we reported that cells selected via immunopanning for high mERα expression showed a decrease in the percentage of cells expressing mERα by ~80% after 10 wk in culture (16). Our data for the F10 subclone relating the loss of mERα with increasing cell passage numbers corroborated these initial findings with cells selected by a different technique and revealed that over the same period, iERα expression was lowered. The decrease in expression of ERα subforms may be related, as both originate from the same coding sequence (4–6). Other investigators have shown that ER transcripts decrease and eventually disappear in cultured cells that are repeatedly passaged (39).
Increased expression of ERs has been reported after in vitro serum starvation (40) and in vivo estrogen deprivation (41), and we found that serum starvation maximized the amount of mERα detectable via immunoassay in the GH3/B6/F10 cells. This increase in mERα levels after serum starvation may be due to removal of the chronic down-regulating influence on mERα by serum components. Removal of serum, which contains not only steroids but a myriad of other regulators, for 48 to 72 h also optimizes mERα-mediated responses (12, 15, 16, 42). This increased mERα expression may cause the cells to enter a mode of heightened sensitivity to E2, as suggested by our studies showing that serum starvation allows detection of rapid responses to very low E2 concentrations (4).
Although other rapid effects of E2 on GH3/B6 cells have been documented (9, 12, 14–16, 42, 43), we were surprised to observe the rapid change of cell shape and adherence properties in response to E2. We previously showed that when F10 cells were serum-starved, their morphology changed from a rounded shape to a flattened, elongated shape (4, 12), perhaps due to the removal of steroids and/or other growth factors contained in the serum. With E2 treatment, cells appeared to retract their cytoplasmic extensions and adopt a rounder shape, in some cases leading to detachment from the coverslip; cells that remained on the coverslip were still flattened out. However, reorganization of the cell surface was not limited to changes in cell shape and adherence. Immunocytochemistry showed that before E2 treatment, the mERα was expressed at moderate levels across the cell surface. E2 exposure caused aggregation of the mERα into large punctate granules. Others have reported similar mER aggregation with various detection systems that depended on ligand labeling (reviewed in ref 44) and, more recently, antibody recognition (45); we previously observed similar aggregation of mERα in live cells treated with the anti-ERα antibody R4 (46), an antibody that also elicits an mERα-triggered cellular response (15). Aggregation of mERα could be a consequence of partitioning into membrane rafts that become caveolae, as these organelles sequester a variety of signaling molecules and have been shown to harbor membrane estrogen receptors (47, 48).
Loss of cells in the control wells (untreated or vehicle-treated) of a plate containing E2-treated cells was a surprising demonstration of the great sensitivity of ER-mediated responses in serum-starved cells. Even femtomolar concentrations of E2 caused the GH3/B6/F10 cells to lift off the plate in nearby vehicle-treated wells. Though this occurrence alerted us to the changes in morphology and adhesion triggered by E2, it also left some experiments without control samples for comparison until we examined duplicate plates that had been used for other experiments not involving E2. E2 may be volatilized and recondensed into other wells at 37°C, as has been shown for other estrogenic compounds (49, 50), warranting administration of vehicle and steroid test compounds in separate plates. Further characterization of the effects of E2 on membrane and intracellular ERα expression in the F10 cells required that cells be prevented from lifting off the plates by coating the wells with an artificial matrix of poly-D-lysine before the cells were plated. Other investigators have reported that after chronic E2 treatment, whole cell or intracellular ER expression increases (28), decreases, or remains the same (51, 52); some of those studies measured α and β forms of the ER due to the detection methods used. Our studies found no net change in mERα levels after acute E2 exposure. Factors in media (such as those provided by serum) may be required for regulation of mERα protein levels; alternatively, a longer time frame may be required for this type of regulation, such as was seen in our studies demonstrating elevation of mERα after serum removal. Although it has been postulated that the mERα is internalized in response to E2, our data do not demonstrate acute relocalization of the mERα away from the cell surface. However, our use of the C542 carboxyl-terminal antibody for ERα detection could not rule out the possibility that the receptor could be cleaved during activation (53), potentially leaving only the carboxyl-terminal fragment in the membrane as a result.
The changes in cell shape, cell adherence, and mERα distribution induced by E2 treatment are probably related to each other and to distinct biological functions. Others have reported changes in cell morphology after exposure to nanomolar amounts of E2. These alterations include microtubule shortening and the rapid emergence and disappearance of microvilli (54), an increase in the number of processes (55), and expansion and retraction at the cell’s periphery accompanied by ruffling of the leading edge (56). Heinrich et al. reported that GH3 cells adopted a rounder shape and detached in response to E2 via an estrogen receptor signaling pathway that caused decreased N-cadherin protein on the cell surface (57). The ER antagonist ICI 182,780 blocked these E2-induced changes and increased N-cadherin protein on the cell surface, causing the cells to spread out and adhere tightly to each other. Activation of the mERα may be involved in this response. Several studies have linked activation of mERα to cell proliferation (6, 19) and suggested roles for estrogen receptors in cell migration (26). Certainly the cells released by E2 treatment in our studies remained viable and able to reattach to a new substrate. Cells in the G2 or M phases of the cell cycle often “round up” when preparing to divide and then become flatter when going through the G1 and S phases of the cell cycle (58). Our progressive partial detachment response (only 10–15% of cells at 3 min, but 25% of cells after 1 h) may indicate that cells at different stages of the cell cycle were differentially responsive to this effect of estrogens. When cells are migrating, there is usually intermittent detachment from the substrate [retraction of cellular extensions in one direction, leaving bits of cytoplasm and membrane behind (26), whereas the cell expands its pseudopodia in a different direction (59)]. The surface changes we observed in F10 cells may indicate that activation of the mERα by E2 is causing the cells to divide and/or migrate.
In summary, the development of a quantitative plate assay for membrane and intracellular ERα (21) has allowed us to explore the regulatory control of these receptor subforms using techniques, which are sufficiently similar to allow direct comparisons. Use of this assay confirmed and further explained some aspects of the extremely dynamic expression of the mERα. The inability of others to detect the mERα in the past may have been due to this dynamism of its expression. Careful attention to the regulatory changes in mERα described here may improve the success of membrane steroid receptor detection, allowing further elucidation of the role of mERα in E2-mediated functions and potential new approaches to their modulation. Further study of why the expression of both ERα subtypes are turned off with extended culturing may lead to a better understanding of the mechanisms contributing to the loss of specific steroid receptor expression and the accompanying loss of hormonal control over the proliferation of some aggressive cancers.
Acknowledgments
Supported by NICHD 32481. C.H.C. was supported by the Zelda Zinn Casper Fellowship Fund, the NIEHS Toxicology Training Grant 5232ES07254, and the UTMB Centennial Center for Environmental Toxicology. The authors wish to thank Dr. Darrell Carney for use of his plate reader and microscope and Dr. David Konkel for critical review of the manuscript. Some data contained in this manuscript were presented as a poster at the Endocrine Society Annual Meeting in Denver, June 2001.
References
- 1.Watson CS, Gametchu B. Membrane-initiated steroid actions and the proteins which mediate them. Proc Soc Exp Biol Med. 1999;220:9–19. doi: 10.1046/j.1525-1373.1999.d01-2.x. [DOI] [PubMed] [Google Scholar]
- 2.Gametchu B. Glucocorticoid receptor-like antigen in lymphoma cell membranes: correlation to cell lysis. Science. 1987;236:456–461. doi: 10.1126/science.3563523. [DOI] [PubMed] [Google Scholar]
- 3.Pappas TC, Gametchu B, Watson CS. Membrane estrogen receptors identified by multiple antibody and impeded ligand labeling. FASEB J. 1995;9:404–410. doi: 10.1096/fasebj.9.5.7896011. [DOI] [PubMed] [Google Scholar]
- 4.Norfleet AM, Thomas ML, Gametchu B, Watson CS. Estrogen receptor-α detected on the plasma membrane of aldehyde-fixed GH3/B6/F10 rat pituitary tumor cells by enzyme-linked immunocytochemistry. Endocrinology. 1999;140:3805–3814. doi: 10.1210/endo.140.8.6936. [DOI] [PubMed] [Google Scholar]
- 5.Chen Z, Yuhanna IS, Galcheva-Gargova Z, Karas RH, Mendelsohn RE, Shaul PW. Estrogen receptor alpha mediates the nongenomic activation of endothelial nitric oxide synthase by estrogen. J Clin Invest. 1999;103:401–406. doi: 10.1172/JCI5347. [DOI] [PMC free article] [PubMed] [Google Scholar]
- 6.Razandi M, Pedram A, Greene GL, Levin ER. Cell membrane and nuclear estrogen receptors (ERs) originate from a single transcript: studies of ERα and ERβ expressed in Chinese hamster ovary cells. Mol Endocrinol. 1999;13:307–319. doi: 10.1210/mend.13.2.0239. [DOI] [PubMed] [Google Scholar]
- 7.Ke FC, Ramirez VD. Binding of progesterone to nerve cell membranes of rat brain using progesterone conjugated to 125I-bovine serum albumin as a ligand. J Neurochem. 1990;54:467–472. doi: 10.1111/j.1471-4159.1990.tb01895.x. [DOI] [PubMed] [Google Scholar]
- 8.Norman AW, Song XD, Zanello L, Bula C, Okamura WH. Rapid and genomic biological responses are mediated by different shapes of the agonist steroid hormone, 1 alpha,25(OH)(2)vitamin D-3. Steroids. 1999;64:120–128. doi: 10.1016/s0039-128x(98)00091-9. [DOI] [PubMed] [Google Scholar]
- 9.Watson CS, Norfleet AM, Pappas TC, Gametchu B. Rapid actions of estrogens in GH3/B6 pituitary tumor cells via a plasma membrane version of estrogen receptor-α. Steroids. 1999;64:5–13. doi: 10.1016/s0039-128x(98)00107-x. [DOI] [PubMed] [Google Scholar]
- 10.Pietras RJ, Szego CM. Estrogen receptors in uterine plasma membrane. J Steroid Biochem. 1979;11:1471–1483. doi: 10.1016/0022-4731(79)90124-9. [DOI] [PubMed] [Google Scholar]
- 11.Pietras RJ, Szego CM. Specific binding sites for oestrogen at the outer surfaces of isolated endometrial cells. Nature (London) 1977;265:69–72. doi: 10.1038/265069a0. [DOI] [PubMed] [Google Scholar]
- 12.Pappas TC, Gametchu B, Yannariello-Brown J, Collins TJ, Watson CS. Membrane estrogen receptors in GH3/B6 cells are associated with rapid estrogen-induced release of prolactin. Endocrine. 1994;2:813–822. [Google Scholar]
- 13.Pietras RJ, Szego CM. Endometrial cell calcium and estrogen action. Nature (London) 1975;253:357–360. doi: 10.1038/253357a0. [DOI] [PubMed] [Google Scholar]
- 14.Zyzek E, Dufy-Barbe L, Dufy B, Vincent JD. Short-term effect of estrogen on release of prolactin by pituitary cells in culture. Biochem Biophys Res Commun. 1981;102:1151–1157. doi: 10.1016/s0006-291x(81)80132-5. [DOI] [PubMed] [Google Scholar]
- 15.Norfleet AM, Clarke C, Gametchu B, Watson CS. Antibodies to the estrogen receptor-α modulate prolactin release from rat pituitary tumor cells through plasma membrane estrogen receptors. FASEB J. 2000;14:157–165. doi: 10.1096/fasebj.14.1.157. [DOI] [PMC free article] [PubMed] [Google Scholar]
- 16.Pappas TC, Gametchu B, Watson CS. Membrane estrogen receptor-enriched GH3/B6 cells have an enhanced non-genomic response to estrogen. Endocrine. 1995;3:743–749. doi: 10.1007/BF03000207. [DOI] [PubMed] [Google Scholar]
- 17.Singh M, Setalo G, Guan XP, Warren M, Toran-Allerand CD. Estrogen-induced activation of mitogen-activated protein kinase in cerebral cortical explants: Convergence of estrogen and neurotrophin signaling pathways. J Neurosci. 1999;19:1179–1188. doi: 10.1523/JNEUROSCI.19-04-01179.1999. [DOI] [PMC free article] [PubMed] [Google Scholar]
- 18.Watters JJ, Campbell JS, Cunningham MJ, Krebs EG, Dorsa DM. Rapid membrane effects of steroids in neuroblastoma cells—effects of estrogen and mitogen activated protein kinase signalling cascade and C-FOS immediate early gene transcription. Endocrinology. 1997;138:4030–4033. doi: 10.1210/endo.138.9.5489. [DOI] [PubMed] [Google Scholar]
- 19.Migliaccio A, Didomenico M, Castoria G, Defalco A, Bontempo P, Nola E, Auricchio F. Tyrosine kinase/P21(RAS)/MAP-kinase pathway activation by estradiol-receptor complex in MCF-7 cells. EMBO J. 1996;15:1292–1300. [PMC free article] [PubMed] [Google Scholar]
- 20.Pietras RJ, Szego CM. Metabolic and proliferative responses to estrogen by hepatocytes selected for plasma membrane binding-sites specific for estradiol-17β. J Cell Physiol. 1979;98:145–160. doi: 10.1002/jcp.1040980116. [DOI] [PubMed] [Google Scholar]
- 21.Campbell CH, Watson CS. A comparison of membrane vs. intracellular estrogen receptor-α in GH3/B6 pituitary tumor cells using a quantitative plate immunoassay. Steroids. 2001;66:727–736. doi: 10.1016/s0039-128x(01)00106-4. [DOI] [PubMed] [Google Scholar]
- 22.Friend KE, Ang LW, Shupnik MA. Estrogen regulates the expression of several different estrogen receptor mRNA isoforms in rat pituitary. Proc Natl Acad Sci USA. 1995;92:4367–4371. doi: 10.1073/pnas.92.10.4367. [DOI] [PMC free article] [PubMed] [Google Scholar]
- 23.Gillies RJ, Didier N, Denton M. Determination of cell number in monolayer cultures. Anal Biochem. 1986;159:109–113. doi: 10.1016/0003-2697(86)90314-3. [DOI] [PubMed] [Google Scholar]
- 24.Lottering ML, Haag M, Seegers JC. Effects of 17β-estradiol metabolites on cell cycle events in MCF-7 cells. Cancer Res. 1992;52:5926 –5932. [PubMed] [Google Scholar]
- 25.Kueng W, Silber E, Eppenberger U. Quantification of cells cultured on 96-well plates. Anal Biochem. 1989;182:16–19. doi: 10.1016/0003-2697(89)90710-0. [DOI] [PubMed] [Google Scholar]
- 26.DePasquale JA. Cell matrix adhesions and localization of the vitronectin receptor in MCF-7 human mammary carcinoma cells. Histochem Cell Biol. 1998;110:485–494. doi: 10.1007/s004180050310. [DOI] [PubMed] [Google Scholar]
- 27.MacLusky NJ, Bowlby DA, Brown TJ, Peterson RE, Hochberg RB. Sex and the developing brain: suppression of neuronal estrogen sensitivity by developmental androgen exposure. Neurochem Res. 1997;22:1395–1414. doi: 10.1023/a:1022027408234. [DOI] [PubMed] [Google Scholar]
- 28.McGinnis MY, Krey LC, MacLusky NJ, McEwen BS. Steroid receptor levels in intact and ovariectomized estrogen-treated rats: an examination of quantitative, temporal and endocrine factors influencing the efficacy of an estradiol stimulus. Neuroendocrinology. 1981;33:158–165. doi: 10.1159/000123222. [DOI] [PubMed] [Google Scholar]
- 29.Brunner N, Boulay V, Fojo A, Freter CE, Lippman M, Clarke R. Acquisition of hormone-independent growth in MCF-7 cells is accompanied by increased expression of estrogen-regulated genes but without detectable DNA amplifications. Cancer Res. 1993;53:283–290. [PubMed] [Google Scholar]
- 30.Chen F, Watson CS, Gametchu B. Association of the glucocorticoid receptor alternatively-spliced transcript 1A with the presence of the high molecular weight membrane glucocorticoid receptor in mouse leukemic cells. J Cell Biochem. 1999;74:430–446. [PubMed] [Google Scholar]
- 31.Diba F, Watson CS, Gametchu B. 5′UTR sequences of the glucocorticoid receptor 1A transcript encode a peptide associated with translational regulation of the glucocorticoid receptor. J Cell Biochem. 2001;81:149–161. [PubMed] [Google Scholar]
- 32.Hermanson O, Glass CK, Rosenfeld MG. Nuclear receptor coregulators: multiple modes of modification. Trends Endocrinol Metab. 2002;13:55–60. doi: 10.1016/s1043-2760(01)00527-6. [DOI] [PubMed] [Google Scholar]
- 33.Nakhla AM, Mather JP, Janne OA, Bardin CW. Estrogen and androgen receptors in Sertoli, Leydig, myoid, and epithelial cells: effects of time in culture and cell density. Endocrinology. 1984;115:121–128. doi: 10.1210/endo-115-1-121. [DOI] [PubMed] [Google Scholar]
- 34.Gerschenson LE, Depaoli JR, Murai JT. Inhibition of estrogen-induced proliferation of cultured rabbit uterine epithelial cells by a cell density-dependent factor produced by the same cells. J Steroid Biochem. 1981;14:959–969. doi: 10.1016/0022-4731(81)90203-x. [DOI] [PubMed] [Google Scholar]
- 35.Shughrue PJ, Lane MV, Scrimo PJ, Merchenthaler I. Comparative distribution of estrogen receptor-alpha (ER-alpha) and beta (ER-beta) mRNA in the rat pituitary, gonad, and reproductive tract. Steroids. 1998;63:498–504. doi: 10.1016/s0039-128x(98)00054-3. [DOI] [PubMed] [Google Scholar]
- 36.Pelletier G, Luu-The V, Charbonneau A, Labrie F. Cellular localization of estrogen receptor beta messenger ribonucleic acid in cynomolgus monkey reproductive organs. Biol Reprod. 1999;61:1249–1255. doi: 10.1095/biolreprod61.5.1249. [DOI] [PubMed] [Google Scholar]
- 37.Matsuzaki S, Fukaya T, Uehara S, Murakami T, Sasano H, Yajima A. Characterization of messenger RNA expression of estrogen receptor-alpha and -beta in patients with ovarian endometriosis. Fertil Steril. 2000;73:1219–1225. doi: 10.1016/s0015-0282(00)00527-6. [DOI] [PubMed] [Google Scholar]
- 38.Mitchner NA, Garlick C, Steinmetz RW, Ben-Jonathan N. Differential regulation and action of estrogen receptors alpha and beta in GH3 cells. Endocrinology. 1999;140:2651–2658. doi: 10.1210/endo.140.6.6703. [DOI] [PubMed] [Google Scholar]
- 39.Iruela-Arispe ML, Rodriguez-Manzaneque JC, Abu-Jawdeh G. Endometrial endothelial cells express estrogen and progesterone receptors and exhibit a tissue specific response to angiogenic growth factors. Microcirculation. 1999;6:127–140. [PubMed] [Google Scholar]
- 40.Katzenellenbogen BS, Kendra KL, Norman M, Berthois Y. Proliferation, hormonal responsiveness, and estrogen receptor content of MCF-7 human breast cancer cells grown in the short-term and long-term absence of estrogens. Cancer Res. 1987;47:4355–4360. [PubMed] [Google Scholar]
- 41.Argarwal VR, Sinton CM, Liang CL, Fisher C, German DC, Simpson ER. Upregulation of estrogen receptors in the forebrain of aromatase knockout (ArKO) mice. Mol Cell Endocrinol. 2000;162:9–16. doi: 10.1016/s0303-7207(00)00227-6. [DOI] [PubMed] [Google Scholar]
- 42.Watson CS, Campbell CH, Gametchu B. Membrane estrogen receptors on rat pituitary tumor cells: immunoidentification and responses to estradiol and xenoestrogens. Exp Physiol. 1999;84:1013–1022. doi: 10.1111/j.1469-445x.1999.01903.x. [DOI] [PMC free article] [PubMed] [Google Scholar]
- 43.Dufy B, Vincent JD, Fleury H, Pasquier PD, Gourdji D, Vidal AT. Membrane effects of thyrotropin-releasing hormone and estrogen shown by intracellular recording from pituitary cells. Science. 1979;204:509–511. doi: 10.1126/science.107590. [DOI] [PubMed] [Google Scholar]
- 44.Szego CM, Pietras RJ. Lysosomal functions in cellular activation: propagation of the actions of hormones and other effectors. Int Rev Cytol. 1984;88:1–302. doi: 10.1016/s0074-7696(08)62759-x. [DOI] [PubMed] [Google Scholar]
- 45.Soji T, Mabuchi Y, Kurono C, Herbert DC. Folliculo-stellate cells and intercellular communication within the rat anterior pituitary gland. Microsc Res Tech. 1997;39:138–149. doi: 10.1002/(SICI)1097-0029(19971015)39:2<138::AID-JEMT5>3.0.CO;2-H. [DOI] [PubMed] [Google Scholar]
- 46.Watson CS, Pappas TC, Gametchu B. The other estrogen receptor in the plasma membrane: Implications for the actions of environmental estrogens. Environ Health Perspect. 1995;103:41–50. doi: 10.1289/ehp.95103s741. [DOI] [PMC free article] [PubMed] [Google Scholar]
- 47.Chambliss KL, Yuhanna IS, Mineo C, Liu P, German Z, Sherman TS, Mendelsohn ME, Anderson RG, Shaul PW. Estrogen receptor alpha and endothelial nitric oxide synthase are organized into a functional signaling module in caveolae. Circ Res. 2000;87:E44–E52. doi: 10.1161/01.res.87.11.e44. [DOI] [PubMed] [Google Scholar]
- 48.Razandi M, Oh P, Pedram A, Schnitzer J, Levin ER. ERs associate with and regulate the production of caveolin: implications for signaling and cellular actions. Mol Endocrinol. 2002;16:100–115. doi: 10.1210/mend.16.1.0757. [DOI] [PubMed] [Google Scholar]
- 49.Beresford N, Routledge EJ, Harris CA, Sumpter JP. Issues arising when interpreting results from an in vitro assay for estrogenic activity. Toxicol Appl Pharmacol. 2000;162:22–33. doi: 10.1006/taap.1999.8817. [DOI] [PubMed] [Google Scholar]
- 50.Pawlowski S, Islinger M, Volkl A, Braunbeck T. Temperature-dependent vitellogenin-mRNA expression in primary cultures of rainbow trout (Oncorhynchus mykiss) hepatocytes at 14 and 18 degrees C. . Toxicol In Vitro. 2000;14:531–540. doi: 10.1016/s0887-2333(00)00048-5. [DOI] [PubMed] [Google Scholar]
- 51.Murphy CS, Meisner LF, Wu SQ, Jordan VC. Short- and long-term estrogen deprivation of T47D human breast cancer cells in culture. Eur J Can Clin Oncol. 1989;25:1777–1788. doi: 10.1016/0277-5379(89)90348-9. [DOI] [PubMed] [Google Scholar]
- 52.Clancy AN, Norman MJ. Effects of testosterone and aromatase inhibition on estrogen receptor-like immunoreactivity in male rat brain. Neuroendocrinology. 1994;59:553–560. doi: 10.1159/000126705. [DOI] [PubMed] [Google Scholar]
- 53.Carlson KE, Choi I, Gee A, Katzenellenbogen BS, enellenbogen JA. Altered ligand binding properties and enhanced stability of a constitutively active estrogen receptor: evidence that an open pocket conformation is required for ligand interaction. Biochemistry. 1997;36:14897–14905. doi: 10.1021/bi971746l. [DOI] [PubMed] [Google Scholar]
- 54.Szego CM, Sjostrand BM, Seeler BJ, Baumer JW, Sjostrand FS. Microtubule and plasmalemmal reorganization: acute response to estrogen. Am J Physiol. 1988;254:E775–E785. doi: 10.1152/ajpendo.1988.254.6.E775. [DOI] [PubMed] [Google Scholar]
- 55.Garcia-Segura LM, Torres-Aleman I, Naftolin F. Astrocytic shape and glial fibrillary acidic protein immunoreactivity are modified by estradiol in primary rat hypothalamic cultures. Dev Brain Res. 1989;47:298–302. doi: 10.1016/0165-3806(89)90186-7. [DOI] [PubMed] [Google Scholar]
- 56.Brubaker KD, Gay CV. Specific binding of estrogen to osteoclast surfaces. Biochem Biophys Res Commun. 1994;200:899 –907. doi: 10.1006/bbrc.1994.1535. [DOI] [PubMed] [Google Scholar]
- 57.Heinrich CA, Lail-Trecker MR, Peluso JJ, White BA. Negative regulation of N-cadherin-mediated cell–cell adhesion by the estrogen receptor signaling pathway in rat pituitary GH(3) cells. Endocrine. 1999;10:67–76. doi: 10.1385/ENDO:10:1:67. [DOI] [PubMed] [Google Scholar]
- 58.Folkman J, Moscona A. Role of cell shape in growth control. Nature (London) 1978;273:345–349. doi: 10.1038/273345a0. [DOI] [PubMed] [Google Scholar]
- 59.Erickson CA, Trinkaus JP. Microvilli and blebs as sources of reserve surface membrane during cell spreading. Exp Cell Res. 1976;99:375–384. doi: 10.1016/0014-4827(76)90595-4. [DOI] [PubMed] [Google Scholar]