

Abstract
The function of the nervous system is a consequence of the intricate synaptic connectivity of its neurons. Our understanding of these highly complex networks has profited enormously from methods used over the past two decades that are based on the mechanical injection of tracer molecules into brain regions. We have developed a genetic system for the mapping of synaptic connections during development of the mammalian central nervous system and in the mature brain. It is based on the transsynaptic transfer of green fluorescent protein (GFP) in the brains of mice using a fusion protein with a nontoxic fragment of tetanus toxin (TTC) expressed in defined neurons. These transgenic mice allowed us to visualize neurons, at single-cell resolution, that are in synaptic contact by the detection of GFP in interconnected circuits. Targeted genetic expression with a specific promoter permitted us to transfer GFP to defined subsets of neurons and brain regions. GFP–TTC is coexpressed with a lacZ reporter gene to discriminate neurons that produce the tracer from cells that have acquired it transneuronally. The marker shows selective transfer in the retrograde direction. We have used electron microscopic detection of GFP to define the ultrastructural features of the system. Our work opens up a range of possibilities for brain slice and in vivo studies taking advantage of the fluorescence of GFP. We point the way toward the use of powerful multiphoton technology and set the stage for the transsynaptic transfer of other proteins in the brains of mice.
The nervous system is able to exert its function because of the intricate wiring of its constituent parts, billions of neurons, which in the course of neural development form synaptic connections thus specifying functional circuits. From there it follows that in the complex mammalian brain an understanding of function requires the detailed analysis of the connectivity of its neurons. Much progress has been made in the past decades by the introduction of sophisticated techniques allowing one to trace the connections between neurons. A recent review of the methods used can be found in ref. 1. In general, these mapping techniques require the mechanical injection of a tracer molecule into a brain region of interest from where it is taken up by dendrites or axons, transported anterogradely or retrogradely inside a neuron, and in certain cases across the synaptic cleft into a connected neuron. By its nature, this mechanical process of tracer injection in the animal has only limited precision for the targeting of specific groups of neurons, so that only broadly interconnected regions can actually be identified. Moreover, it is impossible to inject into a defined subtype of neuron, for example of a certain transmitter phenotype, or especially interneurons.
In contrast, transgenic expression of a marker molecule can be achieved specifically in individual cell types, and obviates the need for invasive brain surgery, which by its very nature might destroy part of the neural circuitry to be analyzed. To this end, we developed molecules that, when expressed in a defined neuron, are being transported across synapses, and can then be detected in connected cells. The neural circuit that this neuron belongs to can thus be identified.
Moreover, expressing a transsynaptic marker molecule transgenically has the valuable advantage that it can accumulate over long periods of time, thus allowing large quantities to be produced and transferred. This considerably facilitates the subsequent detection of the marker and allows high-resolution mapping.
The approach presented here is based on the properties of tetanus neurotoxin, reviewed in (2). It had already been shown that a purified fusion protein between the nontoxic C-terminal fragment (TTC) and β-galactosidase (β-gal) retains the properties of being taken up by nerve endings. It is then retrogradely transported to the soma and dendrites of motor neurons where it crosses a synapse to interconnected higher-order neurons (3). Montecucco and colleagues have postulated that this uptake occurs in an activity-dependent manner based on the active recycling of neurotransmitter by the presynaptic neuron (2). This hypothesis has been confirmed by an additional analysis that has recently been carried out at the neuromuscular junction, where uptake of injected β-gal–TTC fusion protein was found to depend on the activity of the nerve (4).
Here we show that transgenic expression of a fusion protein between TTC and green fluorescent protein (GFP) (5) yields brightly fluorescent cells in the brains of mice and permits us to trace GFP transfer to interconnected neurons. The direct detection of fluorescent GFP thus obviates the need for histochemical techniques that usually have to be applied (1).
The transneuronal tracer is coupled to an internal ribosome entry site (IRES) sequence (6) to coexpress a lacZ reporter gene as a marker of the cell where protein synthesis occurs. This “stationary” marker thus identifies the neuron actually expressing the transgene, and distinguishes it from the neurons receiving the fusion construct because those will be β-gal-negative, but GFP-positive. This allows a clear discrimination of cells that produce the tracer from those that have acquired it transneuronally. In an alternative strategy, coexpression of the two markers is obtained by cointegration of two constructs at the same locus. This is achieved by coinjection of two expression plasmids when generating transgenic lines, following well-established procedures (ref. 7 and Methods).
Methods
DNA Constructs.
Fusion between GFP and TTC.
Plasmid Cβ-poly(A) (from S. Bronson, ref. 8) contains the PGK polyadenylation sequence in Bluescript KS. The BglII site of the poly(A) was removed, and NheI and BglII sites were introduced to ligate the NheI–BglII fragment of plasmid pG2A (9) containing GFP and a 3′ spacer sequence. The TTC fragment (3) was introduced in-frame at the KS polylinker PstI site to give plasmid GT. Two different signal peptides were used to direct the fusion protein into the exocytotic compartment; the Icam signal peptide (10), a gift of Y. Yoshihara, was cloned by using PCR amplification with oligonucleotides that would allow its in-frame ligation with plasmid GT.
Its nucleotide sequence is ATGGCTCCCAGCAGCCCCCGGCCCGCGCTGCCCGCACTCCTGGTCCTGCTCGGGGCTCTGTTCCCAGGACCTGGCAATGCCCAGACATCTGTGTCC, which translates into MAPSSPRPALPALLVLLGALFPGPGNAQTSVS.
Alternatively, a 80-bp oligonucleotide corresponding to the GluR4 signal peptide (11) was ligated in-frame by using SalI/NheI sites. Its sequence is ATGAGGATTATTTGCAGGCAGATTGTCTTGTTGTTTTCTGGATTTTGGGGACTCGCCATGGGA, and the peptide sequence is MRIICRQIVLLFSGFWGLAMG.
It was preceded by a Kozak sequence (12) to promote high-level translation in mammalian cells.
Construction of the transgenes.
The fusion protein construct was cloned downstream of a 0.4-kb cytomegalovirus (CMV) promoter (13). The IRES–lacZ construct (from S. Tajbakhsh) was inserted into the SphI/NotI sites of plasmid GT, to give the transgenic expression cassette.
Cal-lacZ, a minimal promoter fragment of the rat calbindin promoter ligated to lacZ (14), was obtained from A. Chédotal. The lacZ and poly(A) parts of the construct were excised, and the expression cassette was religated with an oligonucleotide containing NheI and NotI restriction sites. This allowed the in-frame introduction of the NheI/NotI fragment of GT.
The NcoI/EcoRV fragment of plasmid EF1α-nlacZ (from J. Hadchouel) was used to introduce the nuclear localization signal into cal-lacZ by replacement of the original NcoI/EcoRV fragment. This plasmid is designated cal-nlacZ.
Generation of Transgenic Mice.
Three-week-old superovulated C57BL6xSJL F1 females were used as egg donors, and 6-week-old CD-1 females as recipients. Standard pronuclear injection procedures were used (15). Transgenics were identified by PCR genotyping of tail DNA. Five transgenic lines were obtained with the CMV promoter, and 15 by cointegration of cal-nlacZ and cal-GFP–TTC. This cointegration at the same locus was verified by PCR using sets of oligonucleotide primers recognising the two transgenes (data not shown). Founder animals were bred with C57BL6xSJL F1, C57BL6, and outbred CD-1 mice to establish lines. Complete cosegregation of the two transgenes from the same locus was confirmed by PCR genotyping, and found to be 100% for all lines. Animal husbandry was in accordance with European Commission directives 219/1990 and 220/1990.
Analysis of Brains.
Timed-pregnant females were killed on embryonic days (day of plug E0.5) E11.5, E12.5, E14.5, E15.5, E16.5, and E18.5, the embryos were removed, fixed for several hours in 2% paraformaldehyde with 0.2% glutar-aldehyde, and then either stained in toto for X-Gal (5-bromo-4-chloro-3-indolyl β-d-galactoside) (16) or prepared for cryostat sectioning. The heads of newborn pups were carefully opened with tweezers to expose the brain and fixed by immersion in fixative for several days. The animals representing the different lines were killed at regular intervals up into adulthood, and treated as described (16). Alternatively, brains were put into 20% sucrose in PBS overnight and then embedded in OCT compound for cryostat sectioning.
For X-Gal histochemistry, sections were treated as in ref. 16. This treatment typically produced a strongly labeled perinuclear rim within the perikaryon of neurons, the typical pattern for nuclear β-gal.
Immunohistochemistry.
Immunohistochemistry (IHC) was carried out as in ref. 16. Polyclonal and monoclonal antibodies were used against GFP (Biovalley, CLONTECH, Invitrogen) and β-gal (Cappel, Promega, Sigma).
In Situ Hybridization.
Selected cryostat sections were used for in situ hybridization following a slightly modified protocol developed previously (17). Briefly, sections were dehydrated, treated with chloroform, rehydrated, digested with proteinase K, and dehydrated. They were hybridized with a digoxigenin-labeled RNA probe complementary to the GFP transcribed in the transgenic brains. The probe was prepared by using the Roche RNA transcription kit. Hybridization was overnight in 2× SSC, 50% formamide, at 45°C. Washes were for 30 min each in 2× SSC at 45°C, then at room temperature. Detection of the hybrid was with a secondary antibody to digoxigenin following the Roche Genius protocol (17).
Electron Microscopy.
Selected X-Gal stained sections were further processed with an anti-GFP antibody, followed by a biotinylated secondary antibody and the Vectastain ABC reagent, and developed by using diaminobenzidine (DAB). Further processing was analogous to (16). Visualization was on a Zeiss transmission electron microscope.
Imaging.
Images of GFP fluorescence were taken on a Zeiss 510 LSM at high 488 nm energies; when double-labeling with a β-gal antibody, the 488 and 543 nm lines were used in alternating acquisition mode. Two-photon images were taken on a commercial Zeiss multiphoton instrument, with a Ti:Sapphire femtosecond laser at 900 nm pumped by a Coherent 10-W laser following procedures established by the creators of the method (18) and applied to neural imaging (19). Fresh, unfixed 500-μm brain slices were kept immersed in PBS and imaged with a new generation of Zeiss 40× and 63× water immersion objectives with high transmission properties in the infrared.
Results
Generation of Transgenic Mice.
To demonstrate the feasibility of the approach in a transgenic system, two different promoters were chosen. They permitted to target expression of the GFP–TTC fusion protein to subsets of neurons in the brains of mice, and to a variety of structures in the periphery.
A CMV promoter has often been used in transgenic mice to overexpress proteins in a variety of tissues (13). We obtained an expression pattern of the protein in one transgenic line, CMV5, that allowed us to establish the basic properties of the system. We thus tested for the possibility of anterograde transfer of the tracer into the central nervous system. The transgene containing the CMV promoter included in addition to the GFP–TTC hybrid gene and upstream signal sequence an IRES sequence (5) fused to a nlacZ reporter gene, Fig. 1A, to facilitate the discrimination of cells that produce the tracer from cells that have acquired it transneuronally.
Figure 1.
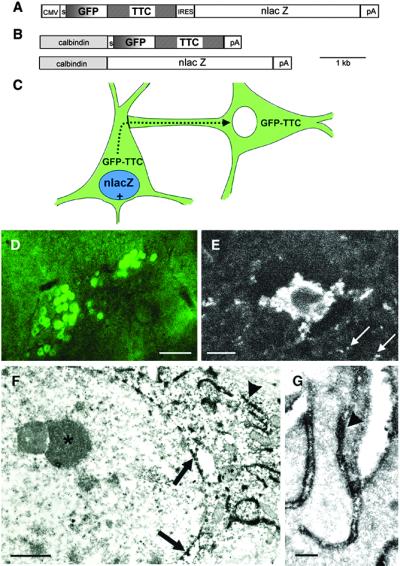
Basic description of the transsynaptic transfer system in transgenic mice. (A) Construct used for the generation of the CMV transgenic line: A CMV promoter drives expression of GFP–TTC, followed by an IRES sequence to coexpress nlacZ. (B) A calbindin promoter fragment is used to coexpress GFP–TTC and nlacZ. (C) Schematic of the transgenic strategy for mapping neuronal connections. Neurons expressing the transgenes are positive for lacZ as a nuclear marker (in blue) and fluorescent (in green) because of the expression of GFP–TTC. Neurons in synaptic contact receive the fusion protein (in green) but are β-gal negative. (D) Heavily GFP-positive neurons in the brainstem of line Cal3 detected with a 10× objective in a 70-μm slice by using FITC optics. (Scale bar, 100 μm.) (E) Strongly positive neuron, and surrounding neuropil (arrows), in the cortex of line Cal5 detected with a Zeiss two-photon microscope deep in a living slice. (Scale bar, 10 μm.) (F) Electron microscopic codetection of the GFP–TTC and β-gal proteins. Slices of a calbindin transgenic brain were stained with X-Gal, and then with an antibody to GFP followed by ABC peroxidase (16). The X-Gal staining gives small crystals in a perinuclear location (arrows), whereas the DAB stains dark in convoluted stacks of ER outside of the nucleus (arrowhead). Inside of the nucleus dense chromatin and a nucleolus are visible (asterisk). (Scale bar, 1 μm.) (G) High-power electron microscopy reveals the localization of the DAB reaction product indicative of the fusion protein at the inside of the ER lumen (arrowhead). (Scale bar, 250 nm.)
Pavlou et al. (14) cloned and described minimal promoter fragments of the rat calbindin gene that, in transgenic mice, directed strong expression of a lacZ marker in several identified cell types and several regions associated with strong calbindin expression in the brain, notably in the Purkinje cells of the cerebellum, neurons of the olfactory bulb, and parts of cortex, the hippocampus, and striatum.
We made use of a strong, neuron-specific promoter fragment to generate transgenic mice that would coexpress, in the same cell, a stationary marker, lacZ, as a marker of the neuron that is at the origin of a circuit; and the GFP–TTC fusion protein (Fig. 1B) that would then be transferred to interconnected neurons transsynaptically (Fig. 1C).
Fifteen transgenic founders were obtained after pronuclear injection of the cal–nlacZ and cal–GFP–TTC plasmids following established procedures for the coexpression of two genes from the same locus (ref. 7, and Methods). Representative animals of these lines were killed at different time points and analyzed by fluorescence visualization of GFP, histochemistry for β-gal, and double-label IHC for the two markers.
Detection of GFP Fluorescence.
Six lines showed very strong GFP signals in brain sections and were analyzed further. Fig. 1 D and E illustrate the fluorescence obtained in different calbindin transgenic lines in various parts of the brain. The neurons are easily detectable even in thick 70-μm vibratome sections viewed with a standard green fluorescence FITC filter set, without special GFP filters, and at low magnification (Fig. 1D). In typical electrophysiological slice setups, neurons can be visualized in 400-μm sections (data not shown). Fig. 1E shows a cortical neuron deep (≈100 μm) in a living slice of 500 μm thickness, imaged by using a Zeiss two-photon laser scanning microscope (19). The arrows point to GFP label in the neuropil surrounding the neuron and detectable in this unfixed preparation.
Ultrastructural Detection of GFP–TTC.
Electron microscopic visualization of GFP was used to better define the ultrastructural localization of the expressed fusion protein in the brains of transgenic mice. Fig. 1F shows the codetection of β-gal, the stationary marker, and GFP–TTC in a cortical neuron; the arrows point to crystals of X-Gal histochemical product deposited in a perinuclear arrangement; GFP–TTC is detected by IHC as a DAB-peroxidase reaction product in convoluted stacks of the endoplasmic reticulum (ER). Fig. 1G shows GFP–TTC in the lumen of the ER (arrowhead), an indication of the protein's subsequent transport through Golgi-associated organelles to the outside of the cell where it is available for uptake by axons.
Developmental Profile of Marker-Protein Expression.
The transneuronal tracer was coupled to an IRES sequence to coexpress the lacZ reporter gene with GFP–TTC from a single transcription unit (see Fig. 1A). We first analyzed the expression of β-gal in the CMV5 line, and one of the 15 calbindin transgenic lines, Cal2, during development at time points ranging from E11.5 to E16.5. Fig. 2A shows an example of the staining pattern obtained in CMV5 at E16.5. X-Gal labeling was first detected in the central nervous system (the roof of midbrain), sensory nerves of the face, the retina, olfactory sensory neurons, follicles of vibrissae, inner ear, and semicircular canal.
Figure 2.

Marker-protein expression during development and analysis of transfer properties. (A) β-gal expression in line CMV5 at E16.5. In toto coloration. Indicated are the vibrissae (v), cochlea and semicircular canal (csc), roof of midbrain (rm), and medulla oblongata (mo). The arrow points to X-Gal stained olfactory epithelium. (B) Confocal image of GFP–TTC in a developing cortical neuron at embryonic day 15.5 in line Cal2. A 20-μm section was viewed at 488 nm confocal illumination. (Scale bar, 5 μm.) (C) A developing cortical neuron at embryonic day 15.5 double-labeled by X-Gal, in blue, and GFP IHC (brown), demonstrating colocalization of the two signals in the same cells. (Scale bar, 10 μm.) (D) Olfactory epithelium of line CMV5 showing strong expression of GFP–TTC in ORN neurons. Confocal analysis. (Scale bar, 10 μm.) Asterisk marks nasal cavity. (E) Absence of GFP antibody staining in the main olfactory bulb (MOB), outlined by arrowheads. Analysis as in C. (Scale bar, 250 μm.) (F) A schematic representation of the olfactory circuit (modified from ref. 21). M/T, mitral and tufted cells projecting to olfactory cortex; Gr, granule neurons receiving input from olfactory cortex; P, periglomerular neurons; ORN, olfactory receptor neurons in the olfactory epithelium. (G) Low-power confocal image of the olfactory bulb of a typical calbindin line. GFP fluorescence is detected as in B, and an antibody to β-gal has been used to double-label neurons at the origin of expression, followed by Texas red-coupled secondary antibody (red). (Scale bar, 100 μm.) (H) High-power confocal analysis of olfactory bulb granule cells showing high levels of GFP detected as in B. (Scale bar, 10 μm.) (I) DAB IHC, after X-Gal staining, of a section of olfactory cortex (outlined by arrowheads) in a P0 mouse of the same calbindin line. Note absence of specific blue X-Gal, and absence of specific brown DAB peroxidase label by using a sensitive anti-GFP antibody. (Scale bar, 100 μm.) (J) Olfactory cortex in a P15 mouse of the same line, analyzed as in I. Note absence of specific blue X-Gal, but strong, specific, dark brown DAB label indicating transfer of GFP–TTC at this age. (Scale bar, 40 μm.) (K) GFP fluorescence in the olfactory cortex detected in an adult mouse of line Cal3. Note absence of red lacZ signal after antibody to β-gal. (Scale bar, 10 μm.)
Already at these early embryonic stages, strong GFP fluorescence was observed in many brain regions, as cells express high levels of GFP–TTC and are easily detected with a standard fluorescence microscope. Fig. 2B gives an example of a cortical neuron from the Cal2 line, at E15.5, and Fig. 2C shows a cortical neuron in a neighboring section double-stained for β-gal and GFP–TTC. At this age, colocalization of β-gal and GFP–TTC in the same neuron is 100% in all regions of the brain analyzed. This finding demonstrates that at early ages, no transfer of the marker-protein is detected in our system.
Identifying the Direction of Transfer.
In line CMV5 it became apparent that the olfactory epithelium was labeled already in the embryos (Fig. 2A). This heterogeneous pattern of expression was extremely informative as it permits, in the same animal, the study and comparison of the expected retrograde and a possible anterograde transsynaptic transport of the TTC fragment.
GFP fluorescence (Fig. 2D) was detected in adult mice sensory neurons of the nasal epithelia. These cells send axons to the main olfactory bulb, where immunodetection of GFP revealed no significant signal in the mitral cell layer (M/T), the tufted cells, or in the granule cells (Gr; Fig. 2E). Fig. 2F gives a schematic representation of the olfactory circuit. These observations indicate that the TTC fragment is not transferred in the anterograde direction.
Developmental Profile of Marker-Protein Transfer.
Calbindin lines Cal1 to Cal5, exhibiting very high levels of GFP, were analyzed for the time course of transsynaptic transfer of GFP–TTC. An antibody against β-gal was used to identify the neurons that are at the origin of expression. The absence of β-gal antibody staining in interconnected neurons, where the presence of GFP could be detected (see Fig. 1C), was used as a sign of transsynaptic transfer of the toxin. Fig. 2G shows high levels of GFP detected in the olfactory bulb, and Fig. 2H shows a high magnification confocal analysis of GFP fluorescence in the granule cell layer.
This system of retrograde connectivity between olfactory bulb and cortex allowed us to establish the temporal profile of synaptic transfer to neurons in olfactory cortex, a cell group that projects heavily to olfactory bulb granule cells (ref. 20, see Fig. 2F). IHC detection of GFP in olfactory cortex was used to follow the time course of GFP–TTC transfer. Fig. 2I shows the absence of specific DAB staining when using an anti-GFP antibody in a P0 (postnatal day 0) transgenic mouse, indicating an absence of detectable GFP transfer at this early age. After further development, at P15, Fig. 2J confirms the transfer of GFP by antibody staining followed by peroxidase-DAB. This IHC analysis demonstrates the gradual accumulation of GFP–TTC in the target area, and the large quantities of label transferred in the course of time.
Fig. 2K shows the corresponding bright GFP signal, with absence of any β-gal antibody labeling (see Fig. 1C) in the olfactory cortex target area. This transfer of GFP–TTC is confirmed by absence of specific signal in olfactory cortex after in situ hybridization with a digoxigenin-labeled probe (17) complementary to GFP, demonstrating that there is no expression of GFP in this area (data not shown).
Mapping Neural Circuitry by Using a Neuron-Specific Promoter.
To explore the potential of our transgenic neural circuit mapping approach combined with the use of a neuron-specific promoter fragment (14), the calbindin lines were analyzed further. Again, an antibody against β-gal was used to detect the neurons that are at the origin of expression (see Fig. 1C).
Lines Cal1 to Cal5 show a reproducible pattern of expression of GFP and β-gal, in contrast to the CMV lines, for example in cerebellar Purkinje cells, which are known to exhibit high, reproducible, and specific calbindin expression (14, 22). Fig. 3A shows such heavily GFP-positive Purkinje cells double-labeled with an antibody to β-gal (red); at the same time, the transfer of GFP–TTC to cerebellar granule cells is seen. This transfer occurs by way of the axonal projection of granule cells (the parallel fibers) to the Purkinje cell dendrite in the molecular layer (see Fig. 3F). Fig. 3B shows transfer of GFP–TTC from a Purkinje neuron to a cerebellar basket cell, recognizable by its characteristic morphology and location (22). Fig. 3C shows a high magnification projection of a cerebellar Golgi cell, receiving the fusion protein, identifiable by its location, size, shape, and characteristic processes (22) (see Fig. 3F). Sections of cerebellum were also stained with an antibody against GFP followed by IHC using DAB to prove the presence and transfer of GFP by an independent method and to exclude autofluorescence artifacts (data not shown). In situ hybridization (17) with a GFP riboprobe demonstrates that GFP is exclusively expressed in the Purkinje cells (Fig. 3D). Fig. 3E, obtained with an anti-GFP antibody after X-Gal histochemistry, demonstrates GFP transfer to brainstem nuclei like the inferior olive that sends important afferents to cerebellar Purkinje cells, indicated in Fig. 3F. Extensive in situ hybridization to the brainstem did not reveal any expression of GFP (data not shown). Fig. 3F summarizes the connectivity and retrograde transsynaptic transfer of TTC in the cerebellar system, from GFP-positive Purkinje neurons to cerebellar basket, Golgi, and granule cells, and to the inferior olive via the climbing fiber projection.
Figure 3.

Detailed analysis of calbindin transgenic mice. (A) Confocal image of a stained section of cerebellum. The Purkinje cells express high levels of GFP–TTC (arrow) and are double-labeled with an antibody to β-gal (red) that, as a stationary marker, identifies the cell where GFP–TTC protein is produced. Transfer of GFP–TTC can be visualized to cerebellar granule cells, the small ovoid neurons with dark nuclei lying below the Purkinje cells in their characteristic internal granular layer of the cerebellum, see F. Individual GFP positive granule cells are marked by arrowheads. (Scale bar, 20 μm.) (B) Transfer of GFP from a double-labeled Purkinje cell to an adjacent, strongly labeled basket cell, arrowhead. The putative site of synaptic contact between the two cells is marked by an arrow. Analysis was as in A. (Scale bar, 20 μm.) (C) Confocal analysis of a cerebellar Golgi neuron labeled with GFP. It is identified by its location and specific morphology. Note the absence of β-gal in the nucleus, arrow. Analysis as in A. (Scale bar, 20 μm.) (D) In situ hybridization (16) with a riboprobe complementary to GFP. Only the Purkinje cells are labeled. The Purkinje cell layer is outlined by arrowheads. Note the absence of signal elsewhere. (Scale bar, 200 μm.) (E) A section of brainstem analyzed as in Fig. 2C. Strong signal is detectable in the inferior olive, outlined by arrowheads, a major source of afferents to cerebellar Purkinje cells, see Fig. 3F. (Scale bar, 100 μm.) Asterisk marks basilar artery. (F) A scheme summarizing the retrograde transsynaptic transfer in the cerebellar system (modified from ref. 23), with an indication of the different cerebellar cell layers on the right, i.e., Molecular layer, Purkinje cell layer, and granular layer.
Efficiency and Limits of GFP Transfer.
Another brain structure with high-level expression of calbindin is the hippocampus, whose architecture and connectivity are presented in Fig. 4A. There, the basic hippocampal circuit can be followed: CA3 pyramidal cells send axons, the Schaffer collaterals, to CA1 neurons, and are in turn innervated by granule cells via their mossy fibers. Fig. 4B shows the fluorescence of a strongly positive hippocampal CA1 pyramidal cell. This is a pattern typically obtained with the promoter fragment used and described by Pavlou et al. (14). The arrowheads mark faint fluorescence in the axons of the Schaffer collaterals, the site of putative retrograde transfer of GFP–TTC from the major dendrite. At this level of confocal analysis on formaldehyde-fixed sections, the limits of direct detection of GFP transfer into axons are reached. However, as shown in Fig. 4C, the accumulation of GFP label allows its detection in cell bodies of CA3 pyramidal cells. Fig. 4D gives an example of third-order transfer into hippocampal dentate neurons detected with a sensitive anti-GFP antibody using DAB IHC. Fig. 4E shows the typical pattern obtained by in situ hybridization, strong GFP expression in CA1 but absence in CA3 and dentate gyrus. This analysis confirms the transsynaptic transfer of GFP into these two hippocampal subfields.
Figure 4.

Efficiency of transfer in calbindin transgenic mice. (A) Outline of the hippocampal system (modified from ref. 21), with an indication of axonal innervation of CA1 pyramidal cells by CA3 pyramidal cells (second-order neurons), that are in turn innervated by granule cells (third-order neurons). B–E are arranged in the same orientation as this scheme, to facilitate the identification of structures. (B) Fluorescence detection of GFP in a CA1 pyramidal cell and its major dendrite, with putative passage of the GFP into axons of the Schaffer collaterals, outlined by arrowheads. (Scale bar, 20 μm.) (C) Low-power confocal image of the hippocampal CA3 area, source of the Schaffer collaterals. GFP is detected in the somata. Analysis as in Fig. 3A. (Scale bar, 20 μm.) (D) X-Gal histochemistry and antibody to GFP in the hippocampal dentate gyrus to detect granule cells receiving GFP. Note absence of specific X-Gal labeling, but positive DAB signal in many dentate granule cells (arrows) indicating transfer of GFP–TTC to third-order neurons. (Scale bar, 30 μm.) (E) In situ hybridization to an adjacent section to demonstrate absence of GFP expression in thalamus (th), presence in cortex (ctx) and hippocampal CA1, and absence in hippocampal CA3 and dentate gyrus (dg). (Scale bar, 200 μm.)
Discussion
We have developed a strategy for mapping neural circuits in the brains of transgenic mice. The vector used for analyzing synaptic connections is a fluorescent fusion protein with a nontoxic part of tetanus neurotoxin. It has the property of passing from one neuron to an interconnected one in a retrograde manner. It provides a delivery system for the transsynaptic transport of the fused GFP from one neuron to a connected one in the nervous system of mice. The cell at the origin of the network is identified by coexpression of a stationary lacZ marker. This marker will not be transferred across the synapse, but will remain in the cell (see Fig. 1C).
We address, at single-cell resolution, fundamental questions about the possibility of mapping neural circuitry in the brains of transgenic mice. The use of a very strong, neuronal subtype-specific calbindin promoter fragment allowed us to establish the feasibility of the approach in well-defined neural circuits: the projections of a variety of cerebellar cell types, e.g., granule and basket cells, to the Purkinje cells. This expression in a number of typical calbindin-positive cell types is very robust, as demonstrated by the strong, reproducible expression of the fusion protein in olfactory bulb (Fig. 2), cortex (Fig. 2), cerebellum (Fig. 3), hippocampus (Fig. 4), hypothalamus, and striatum, in the different lines.
We also present mapped neural circuitry that can be of considerable help in analyzing connections within the hippocampus, with a precision at the level of the individual neuron.
This study considerably extends previous work on the transgenic expression of a plant lectin, wheat germ agglutinin (WGA; refs. 24 and 25). WGA is transferred anterogradely in the nervous system of mice, with a retrograde component that complicates the analysis of anatomical systems. A histochemical technique needs to be used to detect WGA, which eliminates its usefulness in living tissues, as demonstrated here (see Fig. 1). The very strong expression of GFP–TTC that we observe in our system lends itself, in an extension, to electrophysiological approaches; slices cut from transgenic brains show easily detectable signal in typical slice set-ups, and will allow the specific electrophysiological stimulation or inhibition of identified cells and their connections. Use can then also be made of recently developed in vivo two-photon imaging approaches (26) to outline synaptic connectivity in whole-animal studies by detecting GFP fluorescence and transfer. In addition, we prove the complete specificity of our fusion molecule in the retrograde direction.
Transgenic expression of GFP has the added advantage of allowing large amounts of label to be transferred, and consequently more easily detected, over the course of time, as shown in Fig. 2. This analysis suggests a considerable stability and enhanced detectability of the fluorescent fusion protein. Because we engineered the fusion construct to include a spacer molecule (ref. 9 and Methods) between GFP and TTC, GFP is able to fold independently of TTC. It is thus able to acquire its native, very special, and stable configuration required for maximum fluorescence (27). The use of powerful multiphoton imaging technology (18, 19) further enhances the detection of fluorescent neural circuits and permits even faint signals to be detected in living preparations (see Fig. 1).
As shown in Figs. 3 and 4, transfer of GFP–TTC can be visualized in neurons after an additional synaptic relay. These “third-order” neurons can be reached by the fusion protein and detected with the use of a sensitive anti-GFP antibody, rendering the system at least as sensitive as with the original β-gal–TTC fusion (3), where large amounts of protein had to be purified and injected.
Moreover, the transgenic approach will permit one, as exemplified by the use of IRES technology presented here, to coexpress other fluorescent marker molecules (28), to replace lacZ, and to identify neurons at the origin of expression in vivo by standard fluorescence microscopy. IRES technology is also a prerequisite for the use of homologous recombination in embryonic stem cells, permitting the simultaneous expression of two proteins from targeted endogenous promoters. This approach has already revolutionized the analysis of gene function in mammals; especially with gene replacement strategies (29), the so-called “knock-in,” the precise location and timing of the expression of one or more genes in specific cells can be analyzed by the introduction of these markers into the locus of interest. As an extension to this approach, it should become possible to analyze not only the role of a given gene in a given neuron, but also its effects on the synaptic connections. Thus, for example, one can study directly, and simultaneously, the consequences of a gene knockout in a given cell and on its neuronal circuits by a genetic method. Finally, the defined temporal expression of the marker is feasible by using recently developed inducible systems (30).
If the recently demonstrated activity-dependent uptake of a TTC fusion molecule into nerve terminals at the neuromuscular junction (4) can also be established in the central nervous system of mice, additional exciting experiments will become possible. One will then be able to follow and trace “active” neural networks, where the signal obtained in the presynaptic neuron will depend on the activity of the connection.
Many questions can now be addressed with the help of this mapping strategy, which allows the transsynaptic transfer of not only marker molecules, but also biological activities.
Acknowledgments
We thank J.-C. Bénichou for help with electron microscopy, two referees for their very helpful comments, and all colleagues mentioned for their generous gift of reagents. This work was supported by grants from the European Commission (QLG3-2000-01625), the Association Française Contre les Myopathies, and the Centre National de la Recherche Scientifique. U.M. acknowledges support from the European Commission (MC05879), the European Molecular Biology Organization (LTF025698), and Institut Pasteur. K.K. acknowledges support from Rhône-Poulenc and Pasteur-Weizmann.
Abbreviations
- GFP
green fluorescent protein
- β-gal
β-galactosidase
- TTC
tetanus toxin C-terminal fragment
- X-Gal
5-bromo-4-chloro-3-indolyl-β-d-galactoside
- CMV
cytomegalovirus
- IHC
immunohistochemistry
- DAB
diaminobenzidine
References
- 1.Vercelli A, Repici M, Garbossa D, Grimaldi A. Brain Res Bull. 2000;51:11–28. doi: 10.1016/s0361-9230(99)00229-4. [DOI] [PubMed] [Google Scholar]
- 2.Montecucco C, Schiavo G. Q Rev Biophys. 1995;28:423–472. doi: 10.1017/s0033583500003292. [DOI] [PubMed] [Google Scholar]
- 3.Coen L, Osta R, Maury M, Brûlet P. Proc Natl Acad Sci USA. 1997;94:9400–9405. doi: 10.1073/pnas.94.17.9400. [DOI] [PMC free article] [PubMed] [Google Scholar]
- 4.Miana-Mena F J, Roux S, Bénichou J-C, Osta R, Brûlet P. Proc Natl Acad Sci USA. 2002;99:3234–3239. doi: 10.1073/pnas.052023599. [DOI] [PMC free article] [PubMed] [Google Scholar]
- 5.Chalfie M, Tu Y, Euskirchen G, Ward W W, Prasher D C. Science. 1994;263:802–805. doi: 10.1126/science.8303295. [DOI] [PubMed] [Google Scholar]
- 6.Mountford P S, Smith A G. Trends Genet. 1995;11:179–184. doi: 10.1016/S0168-9525(00)89040-X. [DOI] [PMC free article] [PubMed] [Google Scholar]
- 7.Behringer R R, Ryan T M, Reilly M P, Asakura T, Palmiter R D, Brinster R L, Townes T M. Science. 1989;245:971–973. doi: 10.1126/science.2772649. [DOI] [PubMed] [Google Scholar]
- 8.Bronson S K, Plaehn E G, Kluckman K D, Hagaman J R, Maeda N, Smithies O. Proc Natl Acad Sci USA. 1996;93:9067–9072. doi: 10.1073/pnas.93.17.9067. [DOI] [PMC free article] [PubMed] [Google Scholar]
- 9.Baubet V, Le Mouellic H, Campbell A K, Lucas-Meunier E, Fossier P, Brûlet P. Proc Natl Acad Sci USA. 2000;97:7260–7265. doi: 10.1073/pnas.97.13.7260. [DOI] [PMC free article] [PubMed] [Google Scholar]
- 10.Mizuno T, Yoshihara Y, Inazawa J, Kagamiyama H, Mori K. J Biol Chem. 1997;272:1156–1163. doi: 10.1074/jbc.272.2.1156. [DOI] [PubMed] [Google Scholar]
- 11.Laukkanen M-J, Oker-Blom C, Keinänen K. Biochem Biophys Res Commun. 1996;226:755–761. doi: 10.1006/bbrc.1996.1425. [DOI] [PubMed] [Google Scholar]
- 12.Kozak M. Nucl Acids Res. 1987;15:8125–8148. doi: 10.1093/nar/15.20.8125. [DOI] [PMC free article] [PubMed] [Google Scholar]
- 13.van den Pol A N, Ghosh P K. J Neurosci. 1998;18:10640–10651. doi: 10.1523/JNEUROSCI.18-24-10640.1998. [DOI] [PMC free article] [PubMed] [Google Scholar]
- 14.Pavlou O, Ehlenfeldt R, Horn S, Orr R T. Mol Brain Res. 1996;36:268–279. doi: 10.1016/0169-328x(95)00259-u. [DOI] [PubMed] [Google Scholar]
- 15.Hogan B, Beddington R, Constantini F, Lacy E. Manipulating the Mouse Embryo. 2nd Ed. Plainview, NY: Cold Spring Harbor Lab. Press; 1994. [Google Scholar]
- 16.Maskos U, Brüstle O, McKay R D G. Dev Biol. 2001;231:103–112. doi: 10.1006/dbio.2000.0141. [DOI] [PubMed] [Google Scholar]
- 17.Brüstle O, Maskos U, McKay R D G. Neuron. 1995;15:1275–1285. doi: 10.1016/0896-6273(95)90007-1. [DOI] [PubMed] [Google Scholar]
- 18.Denk W, Strickler J H, Webb W W. Science. 1990;248:73–76. doi: 10.1126/science.2321027. [DOI] [PubMed] [Google Scholar]
- 19.Denk W, Svoboda K. Neuron. 1997;18:351–357. doi: 10.1016/s0896-6273(00)81237-4. [DOI] [PubMed] [Google Scholar]
- 20.Shipley T S, McLean J H, Ennis M. In: The Rat Nervous System. Paxinos G, editor. San Diego: Academic; 1995. pp. 899–926. [Google Scholar]
- 21.Shepherd G M. The Synaptic Organisation of the Brain. Oxford: Oxford Univ. Press; 1998. [Google Scholar]
- 22.Altman J, Bayer S A. The Cerebellar System. Boca Raton, FL: CRC Press; 1997. [Google Scholar]
- 23.Ghez C. In: Principles of Neural Science. Kandel E R, Schwartz J H, Jessell T M, editors. New York: Elsevier; 1991. p. 630. [Google Scholar]
- 24.Yoshihara Y, Mizuno T, Nakahira M, Kawasaki M, Watanabe Y, Kagamiyama H, Jishage K, Ueda O, Suzuki H, Tabuchi K, et al. Neuron. 1999;22:33–41. doi: 10.1016/s0896-6273(00)80676-5. [DOI] [PubMed] [Google Scholar]
- 25.Horowitz L F, Montmayeur J-P, Echelard Y, Buck L B. Proc Natl Acad Sci USA. 1999;96:3194–3199. doi: 10.1073/pnas.96.6.3194. [DOI] [PMC free article] [PubMed] [Google Scholar]
- 26.Helmchen F, Fee M S, Tank D W, Denk W. Neuron. 2001;31:903–912. doi: 10.1016/s0896-6273(01)00421-4. [DOI] [PubMed] [Google Scholar]
- 27.Ormo M, Cubitt A B, Kallio K, Gross L A, Tsien R Y, Remington S J. Science. 1996;273:1392–1395. doi: 10.1126/science.273.5280.1392. [DOI] [PubMed] [Google Scholar]
- 28.Baird G S, Zacharias D A, Tsien R Y. Proc Natl Acad Sci USA. 2000;97:11984–11989. doi: 10.1073/pnas.97.22.11984. [DOI] [PMC free article] [PubMed] [Google Scholar]
- 29.Le Mouellic H, Lallemand Y, Brûlet P. Cell. 1992;69:251–264. doi: 10.1016/0092-8674(92)90406-3. [DOI] [PubMed] [Google Scholar]
- 30.Mansuy I M, Bujard K. Curr Opin Neurobiol. 2000;10:593–596. doi: 10.1016/s0959-4388(00)00127-6. [DOI] [PubMed] [Google Scholar]