Abstract
A major limitation for the use of two-proton laser scanning microscopy (2P-LSM) in biofilm and other studies is the lack of a thorough understanding of the excitation-emission responses of potential fluorochromes. In order to use 2P-LSM, the utility of various fluorochromes and probes specific for a range of biofilm constituents must be evaluated. The fluorochromes tested in this study included classical nucleic acid-specific stains, such as acridine orange (AO) and 4",6"-diamidino-2-phenylindole (DAPI), as well as recently developed stains. In addition, stains specific for biofilm extracellular polymeric substances (EPS matrix components) were tested. Two-photon excitation with a Ti/Sapphire laser was carried out at wavelengths from 760 to 900 nm in 10-nm steps. It was found that autofluorescence of phototrophic organisms (cyanobacteria and green algae) resulted in strong signals for the entire excitation range. In addition, the coenzyme F420-related autofluorescence of methanogenic bacteria could be used to obtain images of dense aggregates (excitation wavelength, 780 nm). The intensities of the emission signals for the nucleic acid-specific fluorochromes varied. For example, the intensities were similar for excitation wavelengths ranging from 780 to 900 nm for AO but were higher for a narrower range, 780 to 810 nm, for DAPI. In selective excitation, fading, multiple staining, and combined single-photon-two-photon studies, the recently developed nucleic acid-specific fluorochromes proved to be more suitable regardless of whether they are intended for living or fixed samples. Probes specific for proteins and glycoconjugates allowed two-photon imaging of polymeric biofilm constituents. Selective excitation-emission was observed for Calcofluor White M2R (780 to 800 nm) and SyproOrange (880 to 900 nm). In addition, fluor-conjugated concanavalin A lectins were examined and provided acceptable two-photon emission signals at wavelengths ranging from 780 to 800 nm. Finally, CellTracker, a fluorochrome suitable for long-term labeling of microbial eucaryote cells, was found to give strong emission at wavelengths ranging from 770 to 810 nm. If fluorochromes have the same two-photon excitation cross section, they are suitable for multiple staining and multichannel recording. Generally, if an appropriate excitation wavelength and fluorochrome were used, it was possible to obtain more highly resolved images for thick biofilm samples with two-photon laser microscopy than with conventional single-photon laser microscopy. Due to its potential for higher resolution in light-scattering tissue-like material, such as biofilms, and extremely localized excitation, 2P-LSM is a valuable addition to conventional confocal laser scanning microscopy with single-photon excitation. However, further development of the method and basic research are necessary to take full advantage of nonlinear excitation in studies of interfacial microbial ecology.
Since the first description of the applicability of confocal laser scanning microscopy (CLSM) in biofilm research (10), CLSM performed with single-photon excitation has become a standard tool for investigation of interfacial microbial communities (11, 12, 14). The advantages of CLSM compared with conventional epifluorescence light microscopy have been summarized elsewhere (11, 12). Laser scanning microscopes with two-photon excitation have been commercially available since 1997. In two-photon laser scanning microscopy (2P-LSM) a high-power infrared laser with an extremely short pulse (in the femto- or picosecond range) is used to produce a high photon density, and two or more photons are able to interact simultaneously with a fluorescent dye molecule. Thus, the effect is the same as the effect achieved if the fluorescent molecule is excited with a photon with higher energy. The features and advantages of 2P-LSM have been summarized elsewhere (11, 15).
The use of two-photon excitation in laser scanning microscopy was first described in 1990 by Denk et al. (6). A general overview of 2P-LSM is found in the Handbook of Biological Confocal Microscopy (5). A comparison of single-photon microscopy and two-photon microscopy revealed the improved imaging performance of two-photon excitation in terms of the three-dimensional point spread function and the three-dimensional optical transfer function (8). In the last decade several articles on technical progress in this area have been published. An extensive list of multiphoton references up to 1999 was collected by Steve Potter and may be found at http://www.caltech.edu/∼pinelab/2-photonRefs.html. The properties of fluorochromes with respect to their two-photon cross sections have been the subject of cell biology studies. In two review articles the two-photon imaging technique was critically discussed with an emphasis on the use of this technique in cell biology studies (9, 21). The suitabilities of some well-established fluorochromes for two- and three-photon excitation have been described (22, 23). Nevertheless, new fluorochromes with large two-photon cross sections are being developed and are constantly being introduced (1, 3) without clear definitions of their applicability for biological samples.
To our knowledge, 2P-LSM has been applied to interfacial microbial communities in only a few previous studies performed with a very limited range of fluorochromes. These studies included imaging of oral biofilms with acridine orange (AO) (19). In a subsequent study the authors determined depth of penetration and detected pH gradients in a mixed-culture biofilm of oral bacteria grown in a constant-depth film fermentor after staining with rhodamine B (20). In another study images of fixed and Nanoplast-embedded stromatolites were obtained by CLSM and 2P-LSM after staining with 4",6"-diamidino-2-phenylindole (DAPI), whereas images of exopolysaccharide components were obtained by CLSM after labeling with concanavalin A (ConA)-fluorescein isothiocyanate (4).
The aim of this investigation was to evaluate the suitability of two-photon excitation of fluorochromes and fluor-conjugated probes originally developed for single-photon excitation. The stains were examined for single staining, as well as for possible combinations by using the multichannel mode. Several types of biofilms were employed to assess the two-photon emission of fluorochromes under in situ conditions.
MATERIALS AND METHODS
Biofilm systems.
Biofilms were grown in different reactor systems. River biofilms were grown in rotating annular reactors as described previously (13, 16). Biofilms in fluidized bed reactors were developed from activated sludge as enrichment cultures grown on glucose or EDTA (17). Anaerobic methanogenic aggregates were cultured in a modified Postgate medium B with methanol as the substrate (18). Aggregates of aquatic fungi (Heliscus lugdunensis) were cultivated in liquid media with malt extract (2). Except for the samples stained with Sytox stains, all samples were directly used for laser scanning microscopy, and no fixation or embedding procedure was employed. Samples were mounted on slides with coverslips and spacers (fungi), in coverslip chambers (aggregates), and in petri dishes (reactor biofilms).
Staining.
Bacterial cell distribution was determined after staining with nucleic acid-specific fluorochromes, such as AO (Molecular Probes, Eugene, Oreg.) and DAPI (Sigma, St. Louis, Mo.), as well as selected stains belonging to the Syto series (S9, S13, S40), SybrGreen, SybrGold, SytoxGreen, and SytoxBlue (all obtained from Molecular Probes). Other biofilm constituents were visualized by employing lectins conjugated with different fluorochromes, including fluorescein, OregonGreen, AMCA, MarinaBlue, and Alexa350 (all obtained from Molecular Probes), as well as Calcofluor White M2R (Sigma) and SyproOrange (Molecular Probes). CellTracker Green CMFDA (Molecular Probes) was used as a probe for eucaryotic biofilm organisms. Nucleic acid-specific stains were used as supplied and were diluted to obtain the following concentrations: AO, 10 μl in 1 ml; DAPI, 1 mg in 10 ml; all other nucleic acid-specific stains, 5 μl in 5 ml of demineralized water. Lectins were diluted to a concentration of 0.1 mg of protein per ml. The other stains were used as follows: Calcofluor White M2R, 0.048 mg in 10 ml; SyproOrange, 10 μl in 1 ml. The bacterial biofilms were stained with Syto40 and SybrGreen. The fungi were stained with Calcofluor White M2R and Syto13. CellTracker was used at a concentration of 5 μl in 5 ml of demineralized water. Aggregates of methanogens were visualized by their autofluorescence due to the presence of coenzyme F420. The autofluorescence of chlorophyll was used to obtain images of algae and cyanobacteria.
Laser microscopy.
The following two microscopes were available. First, a TCS 4D that could be attached to an upright or inverted microscope (Leica, Heidelberg, Germany) was used for conventional CLSM. The CLSM was equipped with an Ar-Kr laser source (488, 567, and 647 nm) and a UV laser source (351 to 364 nm) and had a fixed set of filters on the detection side. The microscope was controlled by ScanWare, version 5.10. Second, a TCS SP/MP that also could be attached to an upright or inverted microscope (Leica) was set up with three visible light lasers, an Ar laser (458, 476, 488, and 514 nm), a Kr laser (568 nm), and an He-Ne laser (633 nm), and a Ti/Sapphire infrared laser equipped with a midwave mirror set (760 to 900 nm). Thus, this instrument could be employed for both conventional CLSM and 2P-LSM. In addition, the spectral photometer feature allowed flexible and optimal adjustment of sliders on the detector side. The software available for the 2P-LSM included Leica TCS NT, version 1.6.587, and Leica Confocal software, version 2.00 Build 0477. For both instruments biofilm samples were observed with 63× 0.9 NA and 63× 1.2 NA water-immersible lenses. In addition a coverslip-corrected 63× 1.2 NA water immersion lens was available. The output power of the Ti/Sapphire infrared laser was recorded by using the power meter of the 2P-LSM.
Imaging.
Images were presented and analyzed by using the microscope software and IMARIS, version 3.06 (Bitplane, Zürich, Switzerland). Images were edited with Photoshop, version 5.5 (Adobe, San Jose, Calif.), and were printed with a DP8800 digital printer (Sony, Tokyo, Japan).
RESULTS
Fluorochrome evaluation.
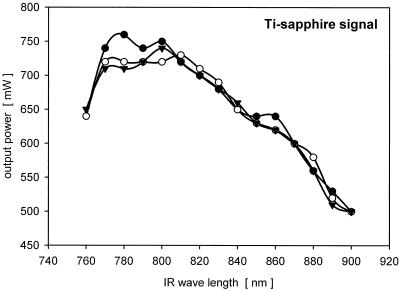
The excitation and emission of a fluorochrome were related to output power of the Ti/Sapphire laser. As the output power was not the same across the entire tuning range, it was recorded at wavelengths from 760 to 900 nm just in front of the glass fiber cable. When our results were compared with the values supplied by the manufacturer, they were slightly lower (Fig. 1). This was probably due to the critical alignment of the glass fiber and the efficiency of transfer of the beam into the glass fiber cable. In order to measure the two-photon signal intensities of fluorochromes and fluor-conjugated probes, the Ti/Sapphire laser was adjusted to wavelengths ranging from 760 to 900 nm in 10-nm steps. Series of three independent measurements were taken at random locations within the biofilms or hyphae. To obtain optimal intensity and contrast adjustment and to obtain comparable measurements, the glow-over-under option was used. The background value was set at zero, and the two-photon emission signal was set at a level so that just a few saturated pixels with an intensity of 255 became visible. In this procedure the voltage or sensitivity value for the photomultiplier (PMT) was considered a relative value for the two-photon signal of a fluorochrome.
FIG. 1.
Signal output of the Ti/Sapphire laser with the midwave mirror set before the signal entered the glass fiber. IR, infrared.
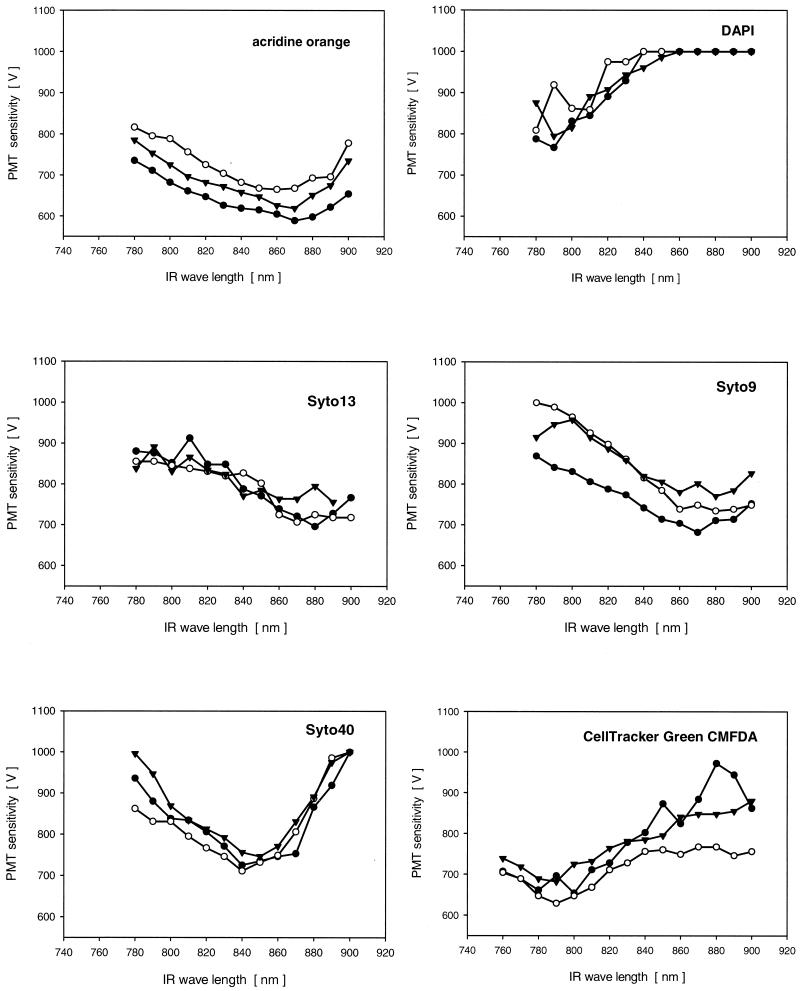
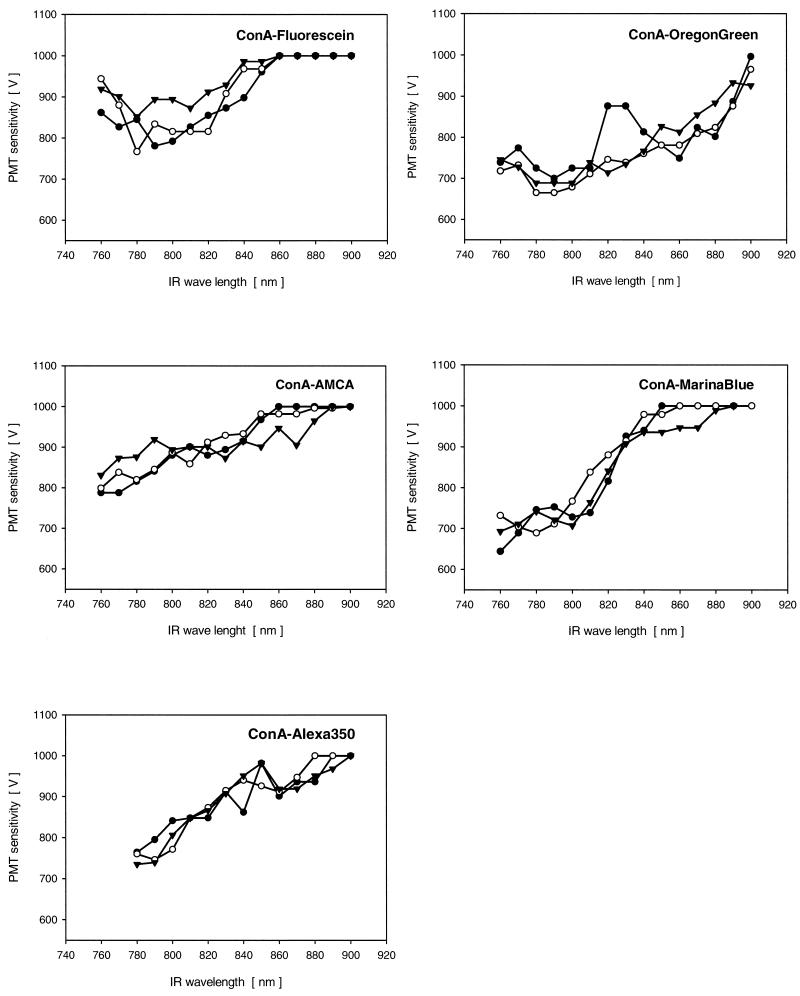
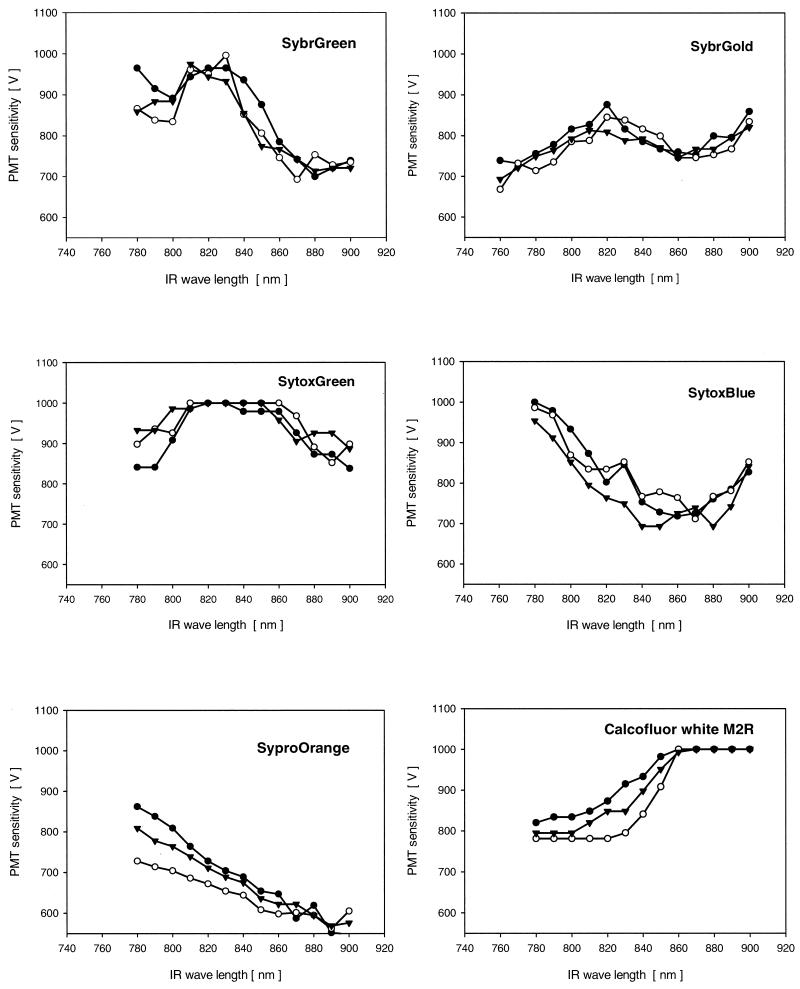
Figures 2 to 4 show the results obtained with traditional nucleic acid-specific fluorochromes, such as AO and DAPI, and recently developed nucleic acid-specific fluorochromes. In addition, the results obtained with probes specific for other biofilm constituents (e.g., proteins and glycoconjugates) are shown. The excitation wavelength of the Ti/Sapphire laser is plotted versus the voltage of the PMT. A low PMT voltage value means that there was a strong two-photon signal and vice versa. Most fluorochromes could be excited with several settings of the Ti/Sapphire laser that included several tens of nanometers. In general, each of the fluorochromes showed a maximum signal intensity in a specific area. The rule of thumb that in contrast to single-photon excitation a double wavelength is required for two-photon excitation could not always be confirmed.
FIG. 2.
Two-photon emission signals for several nucleic acid-specific fluorochromes in living complex biofilm samples. The CellTracker signal specific for eucaryotic cells was determined by using aquatic fungi. The different symbols indicate data for three measurements made at random locations in the biofilms or on hyphae. IR, infrared.
FIG. 4.
Two-photon emission signals for fluor-conjugated ConA-lectins bound to biofilm glycoconjugates. The different symbols indicate data for three measurements made at random locations in the biofilms. IR, infrared.
First, the two classical nucleic acid stains AO and DAPI were tested. AO was found to be excitable across the entire excitation range (780 to 900 nm) (Fig. 2). Because this fluorochrome can also be excited with different visible light lasers and because there is a signal in every possible channel on the detector side, it may not be suitable for multiple staining of biofilms. DAPI exhibited more selective excitation; it was excitable at wavelengths of 780 to 800 nm (Fig. 2). DAPI is a stain that is widely used for cell counting and is also used as a counterstain after in situ hybridization. Nevertheless, due to its broad emission signal it is not suitable for multiple staining because it may interfere with the emission signals in the green channel.
In a second series of experiments recently developed nucleic acid stains were assessed. Syto13 gave the strongest signal in the range from 860 to 890 nm (Fig. 2). A similar two-photon emission signal was obtained for Syto9 (Fig. 2). However, compared to the signal for Syto13, the signal for Syto9 exhibited a more well-defined maximum. Syto40 was found to have strong emission at wavelengths from 830 to 860 nm (Fig. 2). All three of these fluorochromes are suitable for multiple labeling in 2P-LSM imaging.
Sytox stains were developed for fixed samples in order to avoid having to use an expensive UV laser to obtain images of DAPI-stained cells. SytoxBlue showed the highest signal intensity at wavelengths from 840 to 870 nm (Fig. 3). SytoxGreen was found to have one signal maximum at 780 nm and a second signal maximum at 880 to 900 nm (Fig. 3).
FIG. 3.
Two-photon emission signals for highly sensitive nucleic acid-specific fluorochromes in living biofilms (SybrGreen, SybrGold), for fluorochromes developed for fixed bacterial samples (SytoxGreen, SytoxBlue), and for fluorochromes specific for other biofilm constituents (SyproOrange, Calcofluor White M2R). The different symbols indicate data for three measurements made at random locations in the biofilms. IR, infrared.
The other two nucleic acid-specific stains tested were originally developed as extremely sensitive fluorochromes for staining gels but were also used to stain virus-like particles. Like SytoxGreen, SybrGreen had a double maximum. However, there was a clear major maximum at 870 to 900 nm (Fig. 3). Very recently, an even more sensitive fluorochrome, SybrGold, became available. It also had a double maximum, at 760 nm and at 850 to 890 nm (Fig. 3).
The lectin ConA conjugated with different fluorochromes was used to stain glycoconjugates in biofilm systems, and the results were assessed. ConA-fluorescein had a signal maximum at 780 to 820 nm (Fig. 4). Similarly, ConA-OregonGreen was found to have a maximum at 780 to 840 nm (Fig. 4). However, the OregonGreen conjugate produced a higher signal intensity. The three UV conjugates of ConA had similar two-photon emission maxima, at 760 to780 nm (AMCA), at 760 to 800 nm (MarinaBlue), and at 780 to 800 nm (Alexa350). All three of these conjugates had an increasing maximum towards the shorter wavelengths of the infrared region (Fig. 4).
Two of the other fluorochromes evaluated also have the potential to stain various other biofilm constituents. Calcofluor White M2R, which is specific for (1→4)- and (1→3)-beta-d-glucan polysaccharides, was found to have a maximum at 780 to 810 nm (Fig. 3). A maximum at 840 to 900 nm was found for the protein-specific stain SyproOrange (Fig. 3).
Finally, a stain which may be used for long-term labeling of eucaryotic biofilm cells was tested by using aquatic fungi. CellTracker, which passes through the cell membrane and inside the cell undergoes a glutathione S-transferase reaction that produces a membrane-impermeant product, had a two-photon emission maximum at 770 to 810 nm (Fig. 2).
Two-photon imaging.
2P-LSM of biofilms exposed to light immediately showed a strong emission signal without any staining. The signal originated from phototrophic biofilm microorganisms, such as algae and cyanobacteria. The two-photon signal was strong at wavelengths from 760 to 900 nm (data not shown). The autofluorescence of coenzyme F420 from methanogenic bacteria was also used to obtain images of dense aggregates. Surprisingly, these aggregates could be subjected to two-photon imaging without a neutral-density filter and were not subject to fading or photodamage (data not shown).
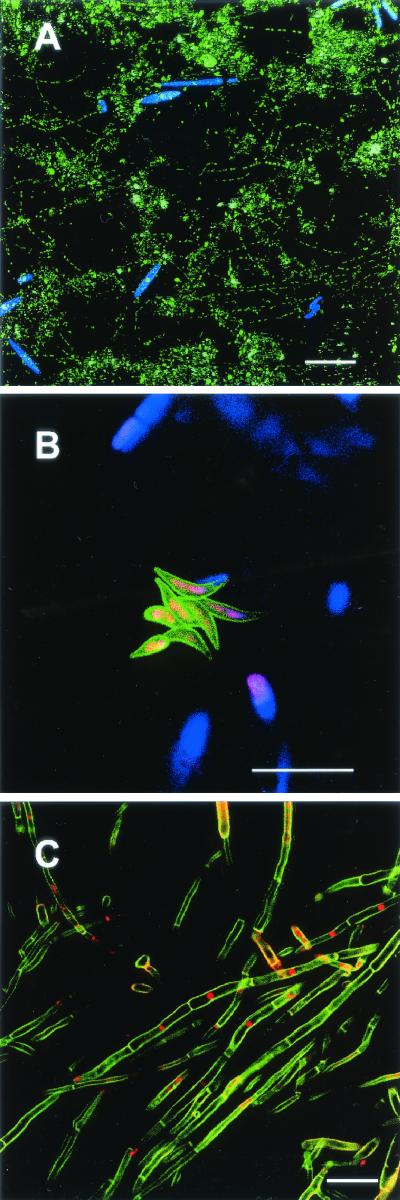
Two-photon excitation at a specific wavelength with multichannel imaging of different biofilm constituents was also observed. For example, a lotic biofilm stained with DAPI was examined at an excitation wavelength of 790 nm. The DAPI signal was recorded at 400 to 550 nm, and the algal autofluorescence signal was recorded at 650 to 750 nm (Fig. 5A). A second example revealed the autofluorescence of algae in combination with lectin staining. The Canavalia ensiformis-AMCA lectin allowed imaging of glycoconjugates in the surface layer of a Scenedesmus colony (Fig. 5B). Two-photon excitation at 800 nm was used, and signals were detected at 400 to 530 nm (ConA-AMCA), as well as at 545 to 630 and 650 to 750 nm (both autofluorescence signals). A third example consisted of aquatic fungi stained with Calcofluor White M2R and Syto13. The sample was excited at 820 nm, and signals were detected at 400 to 493 nm (Calcofluor White M2R) and 499 to 602 nm (Syto13). When this combination was used, the cell surfaces and septa of fungi and the presence of a nucleus could be recorded (Fig. 5C). These three examples clearly showed the potential of 2P-LSM for obtaining images of multiple biofilm components.
FIG.5.
Two-photon excitation and dual-channel recording of signals from different biofilm constituents. Scale bars = 20 μm. (A) Lotic biofilm image showing chlorophyll autofluorescence (blue) and DAPI-stained bacteria (green). (B) Lotic biofilm image showing algal autofluorescence (blue) and cell surface glycoconjugates of a Scenedesmus colony after lectin staining with ConA-AMCA (green). (C) Aquatic fungi with the cell surfaces stained with Calcofluor White M2R (green) and the nuclei stained with Syto13 (red).
DISCUSSION
CSLM has become a fundamental tool for investigation of interfacial microbial communities. 2P-LSM has certain advantages; however, its use requires an understanding of the behavior of fluorochromes in biological material. Here we describe an evaluation of several fluorochromes and fluor-conjugated probes that was performed to determine the suitability of these probes for 2P-LSM. The applicability of the 2P-LSM technique for complex systems was demonstrated by using different types of biofilms, including river biofilms, reactor biofilms, methanogenic aggregates, and aquatic fungal aggregates.
In this study the 2P-LSM system was used to evaluate the behavior of the fluorochromes, and the results are presented as PMT sensitivities. The precise PMT setting used may vary not only between instruments but also between samples. However, the pattern of excitation and emission should not vary. Therefore, the PMT values shown here are not absolute values but are relative guides to instrument settings when particular fluorochromes and infrared wavelengths are used.
Evaluation of fluorochromes.
In order to examine fluorochromes, they should be tested in situ by using the biological samples to be stained (e.g., environmental biofilm systems). Therefore, we assessed two-photon emission directly in complex biofilm samples. We found that most existing fluorochromes may be used for two-photon excitation of various biofilm constituents. This includes recently developed nucleic acid-specific stains which, compared to AO and DAPI, have a narrow emission signal and consequently are more suitable for multiple labeling and multichannel imaging of cell distribution in biofilms. In addition, we evaluated stains for glycoconjugates, specific polysaccharide types, proteins, and intracellular enzymes, all of which have potential for two-photon imaging of biofilm constituents. To our knowledge, such an evaluation has not been reported before. The fluorochromes evaluated previously were the fluorochromes usually employed in cell biology. In two reports the multiphoton cross sections of several cellular molecules, as well as popular cell biological stains, were measured at 700 to 900 nm and at 690 to 1,050 nm (22, 23). The values were expressed as the product of the fluorescence emission quantum efficiency and the two-photon absorption cross section in GM units (named after the scientist who predicted two-photon absorption processes in 1931, Göppert-Mayer [7]). Despite the suitability of existing fluorochromes for 2P-LSM, new molecules with large two-photon cross sections have been developed (1, 3). However, so far no specific two-photon fluorochromes are commercially available.
Due to the performance of the midwave mirror set, the output signal of the Ti/Sapphire laser is low at both ends of the usable infrared spectrum (760 to 900 nm). When the midwave mirror was set at 760 nm, a value of 640 mW was obtained for the output signal, and when the midwave mirror was set at 900 nm, a value of 500 mW was obtained for the output signal (Fig. 1). Despite the fact that the two-photon excitation signal is equal to the square of the illumination intensity, some fluorochromes (e.g., Calcofluor White and ConA-lectins conjugated with UV fluorochromes) exhibit maximum emission at 760 nm, whereas others (e.g., SybrGreen and SyproOrange) exhibit maximum emission at 900 nm. Nevertheless, the signal intensity obtained for a fluorochrome is a relative measure of its excitation with two photons.
Most of the fluorochromes tested in this study had a single maximum either at the lower end (e.g., Calcofluor White), at the high end (e.g., Syto9), or in the middle (e.g., Syto40) (Fig. 2 to 4 and Tables 1 and 2). Three of the fluorochromes (SytoxGreen, SybrGreen, SbyrGold) had two emission maxima, one in the lower excitation region (760 to 780 nm) and one in the higher excitation region (860 to 900 nm) (Fig. 3). For SybrGreen and SybrGold two single-photon excitation maxima at 497 and 254 nm and at 495 and 300 nm, respectively, have been reported. Consequently, the second emission maximum for both of these fluorochromes in the 760- to 790-nm region may be due to the second single-photon excitation maximum in the deep UV region.
TABLE 1.
Excitation wavelengths for single-photon laser scanning microscopy and 2P-LSM for various nucleic acid-specific fluorochromes for staining of bacteria in biofilms
| Fluorochrome | Excitation wavelength(s) (nm)
|
|
|---|---|---|
| Single photona | Two photon | |
| DAPI | 358 (360) | 780-800 |
| Syto40 | 420 (442) | 830-860 |
| SytoxBlue | 436 (442) | 840-870 |
| Syto9 | 480 (488) | 860-890 |
| Syto13 | 481 (488) | 860-890 |
| SybrGreen | 497 (488) | 790, 870-900 |
| SybrGold | 495 (488) | 760, 850-890 |
| SytoxGreen | 500 (488) | 780, 880-900 |
| AO | 500 (488) | 780-900 |
The values for single-photon excitation are the optimal wavelengths; the values in parentheses are the usual wavelengths of lasers that are available.
TABLE 2.
Excitation wavelengths for single-photon laser scanning microscopy and 2P-LSM for various fluorochromes for other biofilm constituents
| Fluorochrome | Excitation wavelength (nm)
|
|
|---|---|---|
| Single photona | Two photon [nm] | |
| ConA-Alexa350 | 346 (360) | 780-800 |
| ConA-AMCA | 346 (360) | 760-780 |
| ConA-MarinaBlue | 365 (360) | 760-800 |
| ConA-fluorescein | 494 (488) | 780-820 |
| ConA-OregonGreen | 496 (488) | 780-840 |
| Calcofluor White | 350 (360) | 780-810 |
| SyproOrange | 470 (488) | 840-900 |
| CellTracker | 492 (488) | 770-810 |
The values for single-photon excitation are the optimal wavelengths; the values in parentheses are the usual wavelengths of matching lasers that are available.
In general, it was found that the rule of thumb, that doubling the wavelength of one-photon excitation results in optimal signal for two-photon excitation, is not an absolute rule. In several cases, as shown in our study, it was possible to obtain two-photon excitation with wavelengths which were not equal to double the single-photon excitation wavelength (Tables 1 and 2). Regardless of the excitation source, fading is a problem with all fluorochromes and may have to be addressed through the use of fade retardants and through limiting exposure of the sample.
For multiple staining in single-photon laser scanning microscopy it is essential to have well-separated excitation-emission peaks for the different fluorochromes. However, when fluorochromes are used together for 2P-LSM, only one excitation wavelength is available. Therefore, the fluorochromes must have the same excitation cross section. Figure 5 shows images obtained for autofluorescence and nucleic acid staining (Fig. 5A) or lectin staining (Fig. 5B), as well as for double staining with two fluorochromes (Fig. 5C). Therefore, if combinations of fluorochromes are chosen carefully, 2P-LSM may be used for colocalization and multiple fluorochrome staining.
Conclusions.
Different types of phototrophic microorganisms (algae, cyanobacteria) produced strong two-photon autofluorescence signals at excitation wavelengths of 760 to 900 nm. These broad signals could be useful or could interfere with other fluorochromes. Furthermore, autofluorescence of methanogens could be obtained by using an excitation wavelength of 780 nm. Most of the fluorochromes originally developed for single-photon excitation may be used for two-photon excitation. However, many of these fluorochromes may be excited with wavelengths that are not equal to double the wavelength calculated for single-photon excitation. The two-photon emission signals of traditional nucleic acid-specific stains, such as AO, were similar for the entire excitation range, whereas DAPI had maximum emission at wavelengths between 780 and 810 nm. The recently developed nucleic acid-specific stains intended for living samples (e.g., Syto and Sybr) and fixed samples (e.g., Sytox) may be used for two-photon excitation. For excitation, fading, multiple staining, and combined single-proton laser scanning microscopy-2P-LSM, various stains with narrow two-photon emission signals were suitable fluorochromes.
Acknowledgments
The provision of and access to the 2P-LSM by Werner Zuschratter at the Institute of Neurobiology in Magdeburg, Germany, for very preliminary experiments are appreciated. M. Blümel, A. Leon, P. Otto, B. Pierau, and C. Walther are acknowledged for supplying biofilm samples.
REFERENCES
- 1.Albota, M., D. Beljonne, J.-L. Bredas, J. E. Ehrlich, J.-Y. Fu, A. A. Heikal, S. E. Hess, T. Kogej, M. D. Levin, S. R. Marder, D. McCord-Maughon, J. W. Perry, R. Röckel, M. Rumi, G. Subramaniam, W. W. Webb, X.-L. Wu, and C. Xu. 1998. Design of organic molecules with large two-photon absorption cross sections. Science 281:1653-1656. [DOI] [PubMed] [Google Scholar]
- 2.Atlas, R. M., and L. C. Parks. 1997. Handbook of microbiological media. CRC Press, New York, N.Y.
- 3.Cheng, P. C., S. J. Pan, A. Shih, K.-S. Kim, W. S. Liou, and M. S. Park. 1998. Highly efficient upconverters for multiphoton fluorescence microscopy. J. Microsc. 189:199-212. [Google Scholar]
- 4.Decho, A. W., and T. Kawaguchi. 1999. Confocal imaging of in situ natural microbial communities and their extracellular polymeric secretions using nanoplast resin. BioTechniques 27:1246-1251. [PubMed] [Google Scholar]
- 5.Denk, W., D. W. Piston, and W. W. Webb. 1995. Two-photon molecular excitation in laser-scanning microscopy, p. 445-458. In J. B. Pawley (ed.), Handbook of biological confocal microscopy. Plenum Press, New York, N.Y.
- 6.Denk, W., J. H. Strickler, and W. W. Webb. 1990. Two-photon laser scanning fluorescence microscopy. Science 248:73-76. [DOI] [PubMed] [Google Scholar]
- 7.Göppert-Mayer, M. 1931. Über Elementarakte mit zwei Quantensprüngen. Ann. Phys. 9:273-295. [Google Scholar]
- 8.Gu, M., and C. J. R. Sheppard. 1995. Comparison of three-dimensional imaging properties between two-photon and single-photon fluorescence microscopy. J. Microsc. 177:128-137. [Google Scholar]
- 9.König, K. 2000. Multiphoton microscopy in life sciences. J. Microsc. 200:83-104. [DOI] [PubMed] [Google Scholar]
- 10.Lawrence, J. R., D. R. Korber, B. D. Hoyle, J. W. Costerton, and D. E. Caldwell. 1991. Optical sectioning of microbial biofilms. J. Bacteriol. 173:6558-6567. [DOI] [PMC free article] [PubMed] [Google Scholar]
- 11.Lawrence, J. R., D. R. Korber, G. M. Wolfaardt, D. E. Caldwell, and T. R. Neu. 2001. Analytical imaging and microscopy techniques, p. 39-61. In C. J. Hurst, G. R. Knudsen, M. J. McInerney, R. L. Crawford, and L. D. Stetzenbach (ed.), Manual of environmental microbiology. American Society for Microbiology, Washington, D.C.
- 12.Lawrence, J. R., and T. R. Neu. 1999. Confocal laser scanning microscopy for analysis of microbial biofilms. Methods Enzymol. 310:131-144. [DOI] [PubMed] [Google Scholar]
- 13.Lawrence, J. R., G. D. W. Swerhone, and T. R. Neu. 2000. A simple rotating annular reactor for replicated biofilm studies. J. Microbiol. Methods 42:215-224. [DOI] [PubMed] [Google Scholar]
- 14.Lawrence, J. R., G. Wolfaardt, and T. R. Neu. 1998. The study of microbial biofilms by confocal laser scanning microscopy, p. 431-465. In M. H. F. Wilkinson and F. Shut (ed.), Digital image analysis of microbes. Wiley, Chichester, United Kingdom.
- 15.Neu, T. R., and U. Kuhlicke. 2001. Anwendungen der 2-Photonen Laser Scanning Mikroskopie in der Mikrobiologie. Biospektrum 7:379-382. [Google Scholar]
- 16.Neu, T. R., and J. R. Lawrence. 1997. Development and structure of microbial biofilms in river water studied by confocal laser scanning microscopy. FEMS Microbiol. Ecol. 24:11-25. [Google Scholar]
- 17.Nörtemann, B. 1999. Biodegradation of EDTA. Appl. Microbiol. Biotechnol. 51:751-759. [DOI] [PubMed] [Google Scholar]
- 18.Postgate, J. R. 1984. Genus Desulfovibrio, p. 666-672. In N. R. Krieg and J. G. Holt (ed.), Bergey's manual of systematic bacteriology, vol. 1. Williams & Wilkins, Baltimore, Md. [Google Scholar]
- 19.Sytsma, J., J. M. Vroom, d. C. J. Grauw, and H. C. Gerritsen. 1998. Time-gated fluorescence lifetime imaging and microvolume spectroscopy using two-photon excitation. J. Microsc. 191:39-51. [Google Scholar]
- 20.Vroom, J. M., K. J. De Grauw, H. C. Gerritsen, D. J. Bradshaw, P. D. Marsh, G. K. Watson, J. J. Birmingham, and C. Allison. 1999. Depth penetration and detection of pH gradients in biofilms by two-photon excitation micros-copy. Appl. Environ. Microbiol. 65:3502-3511. [DOI] [PMC free article] [PubMed] [Google Scholar]
- 21.Williams, R. M., D. W. Piston, and W. W. Webb. 1994. Two-photon molecular excitation provides intrinsic 3-dimensional resolution for laser-based microscopy and microphotochemistry. FASEB J. 8:804-813. [DOI] [PubMed] [Google Scholar]
- 22.Xu, C., R. M. Williams, W. Zipfel, and W. W. Webb. 1996. Multiphoton excitation cross-sections of molecular fluorophores. Bioimaging 4:198-207. [Google Scholar]
- 23.Xu, C., W. Zipfel, J. B. Shear, R. M. Williams, and W. W. Webb. 1996. Multiphoton fluorescence exitation: new spectral windows for biological nonlinear microscopy. Proc. Natl. Acad. Sci. USA 93:10763-10768. [DOI] [PMC free article] [PubMed] [Google Scholar]


