

Abstract
To clarify the significance of the activation of pyruvate formate-lyase (PFL) by PFL-activating enzyme (PFL-AE) in Streptococcus bovis, the molecular properties and gene expression of PFL-AE were investigated. S. bovis PFL-AE was deduced to consist of 261 amino acids with a molecular mass of 29.9 kDa and appeared to be a monomer protein. Similar to Escherichia coli PFL-AE, S. bovis PFL-AE required Fe2+ for activity. The gene encoding PFL-AE (act) was found to be polycistronic, and the PFL gene (pfl) was not included. However, the act mRNA level changed in parallel with the pfl mRNA level, responding to growth conditions, and the change was contrary to the change in the lactate dehydrogenase (LDH) mRNA level. PFL-AE synthesis appeared to change in parallel with PFL synthesis. Introduction of a recombinant plasmid containing S. bovis pfl and the pfl promoter into S. bovis did not affect formate and lactate production, which suggests that the activity of the pfl promoter is low. When the pfl promoter was replaced by the S. bovis ldh promoter, PFL was overexpressed, which caused an increase in the formate-to-lactate ratio. However, when PFL-AE was overexpressed, the formate-to-lactate ratio did not change, suggesting that PFL-AE was present at a level that was high enough to activate PFL. When both PFL-AE and PFL were overexpressed, the formate-to-lactate ratio further increased. It is conceivable that LDH activity is much higher than PFL activity, which may explain why the formate-to-lactate ratio is usually low.
Streptococcus bovis, an important amylolytic and lactate-producing bacterium, is one of the predominant bacteria in the rumen when ruminants are fed high-concentrate diets (12, 20). Rapid fermentation of starch often leads to an increase in lactate production, and high levels of lactate sometimes cause rumen acidosis (8). Since S. bovis is likely to contribute to lactic rumen acidosis (23), it is desirable to control lactate production by S. bovis.
However, lactate usually undergoes secondary fermentation in the rumen, and propionate is generally produced as a major product (24). Since an inverse relationship is generally observed between propionate production and methanogenesis (16), an increase in lactate production may lead to a decrease in methanogenesis. This is particularly important, because methanogenesis represents an energy loss for ruminants and, in addition, contributes to the greenhouse effect.
Furthermore, lactate serves as an electron donor for sequential nitrate reduction to ammonia (13). Lactate is utilized more effectively for nitrite reduction to ammonia than for nitrate reduction to nitrite (13). Since nitrite reduction is the limiting step in sequential nitrate reduction (8) and nitrite is toxic and mutagenic, stimulation of nitrite reduction is particularly important. Sequential nitrate reduction is also an important way to decrease methanogenesis (14).
Thus, it may be beneficial to modulate lactate production so that lactate is always present but does not accumulate too much in the rumen. It is desirable to maintain the balance between lactate production and utilization by preventing overproduction of lactate and stimulating the effective utilization of lactate.
S. bovis produces lactate as a major fermentation product when an excess energy source is present or the culture pH is low (5, 6). The proportion of lactate in the total fermentation products is affected by the ratio of lactate dehydrogenase (LDH) activity to pyruvate formate-lyase (PFL) activity (3, 6). The activities of both enzymes are regulated at two levels. One level is allosteric regulation. S. bovis LDH is activated by fructose 1,6-bisphosphate (2, 23), and PFL is inhibited by dihydroxyacetone phosphate and d-glyceraldehyde 3-phosphate (3). The intracellular concentrations of these glycolytic intermediates change so much that they affect the activities of the enzymes (4). The other level is regulation of LDH and PFL synthesis at the transcriptional level (5, 6). S. bovis increases lactate production by increasing LDH synthesis and simultaneously decreases formate production by decreasing PFL synthesis in response to a reduced pH and an excess energy supply (3, 5, 6).
S. bovis PFL appears to be synthesized as an inactive (nonradical) form and then is posttranslationally converted to an active (radical) form by accepting an electron from a PFL-activating enzyme (PFL-AE) (3). Similar to the activity of Escherichia coli PFL (15), the activity of S. bovis PFL may be regulated by PFL-AE activity.
In this study, we examined whether PFL and PFL-AE activities affect formate and lactate production. To do this, we analyzed the gene encoding PFL-AE (act) and generated recombinant strains overexpressing PFL and/or PFL-AE. We also examined the effects of culture conditions on the act mRNA level and on the levels of mRNA for PFL and LDH.
MATERIALS AND METHODS
Sources of bacterial strains and plasmids.
Bacterial strains used in this study are listed in Table 1. The source of S. bovis JB1 was described previously (2). Strain 12U1 was isolated from the rumen of a cow and was identified in our laboratory by using the criteria described in Bergey's Manual of Systematic Bacteriology (10). Except where indicated otherwise, the JB1 strain was used. E. coli DH5α was purchased from a commercial source (TOYOBO, Tokyo, Japan). Plasmid pUC18 was purchased from a commercial source and was used to clone the S. bovis act gene. Plasmid pQE30 was also purchased from a commercial source (QIAGEN) and was used to express a His-tagged fusion protein. Plasmid pSBE11, a shuttle vector between E. coli and S. bovis (21), was generously given by M. Nakamura (STAFF Institute, Tsukuba, Japan).
TABLE 1.
Strains of S. bovis used in this study
| Strain | Characteristics |
|---|---|
| JB1 | Wild type |
| 12U1 | Highly transformable strain isolated and identified in this laboratory; parent strain |
| PF1 | pfl promoter region (300 bp upstream of the pfl ATG start codon) and pfl ORF were integrated into a plasmid, pSBE11, and then introduced into 12U1 |
| PF2 | ldh promoter region (300 bp upstream of the ldh ATG start codon) and pfl ORF were integrated into pSBE11 and then introduced into 12U1 |
| PF3 | ldh promoter region and act ORF were integrated into pSBE11 and then introduced into 12U1 |
| PF4 | ldh promoter region, pfl ORF, and act ORF containing the Shine-Dalgarno sequence were integrated into pSBE11 and then introduced into 12U1 |
Growth conditions and determination of fermentation products.
The growth conditions for S. bovis in batch culture were the conditions described previously (2). The medium contained (per liter) 0.45 g of K2HPO4, 0.45 g of KH2PO4, 0.9 g of (NH4)2SO4, 0.9 g of NaCl, 0.12 g of CaCl2 · 2H2O, 0.19 g of MgSO4·7H2O, 0.1 g of Fe(NH4)2(SO4)2, 1.0 g of Trypticase (BBL, Becton Dickinson), 1.0 g of yeast extract (Difco Laboratories), and 0.6 g of cysteine·HCl. Either glucose or lactose (3 g/liter) was provided as an energy source. Culture incubations were performed in triplicate, and the pH was maintained at 7.0 or 4.5, which is the lowest pH permitting growth (2). Unless otherwise stated, S. bovis was grown until the late log stage.
A glucose- or ammonia-limited continuous culture was performed at pH 7.0 or 4.5 as described previously (3). When S. bovis cells were grown at pH 4.5, two cycles of culture incubation were carried out in order to collect enough cells for analysis. To prepare a fusion protein, E. coli was aerobically grown in Luria-Bertani medium. Organic acids were analyzed by high-performance liquid chromatography as previously described (11). Cellular nitrogen was determined by the Kjeldahl method as described previously (4).
Sequencing of the act gene.
Genomic DNA was extracted from S. bovis, and nucleotide sequences were determined for both strands as described previously (6). The sequence data were evaluated as previously described (6).
Based on the sequences of the act genes of Streptococcus mutans (accession number AF051356), E. coli (X08035), Haemophilus influenzae (U32703), and Listeria monocytogenes (AJ009627) registered in GenBank, two oligonucleotide primers for PCR were designed and prepared commercially (Hokkaido System Science, Hokkaido, Japan); these primers were designated act p1 (5′-GGNCCWGGTATHCGCTTT-3′; positions 334 to 351) and act p2 (5′-AWWACYAAATCNGTBAC-3′; positions 680 to 664). The PCR product obtained from the genomic DNA of S. bovis JB1 was a 347-bp fragment which exhibited high degrees of identity to parts of the act genes of the bacteria described above (BLAST search). Subsequently, the 347-bp fragment was labeled with a digoxigenin DNA labeling and detection kit (Boehringer Mannheim) and used as a hybridization probe for Southern blot and Northern blot analyses (act probe).
S. bovis genomic DNA was digested with Sau3AI and ligated to a plasmid, pUC18. The plasmid was then introduced into E. coli DH5α. A fragment containing the upstream and downstream regions of the 347-bp fragment was selected with the act probe.
Northern blot analysis.
Cultures were immediately frozen by immersing them in liquid nitrogen and were stored at −80°C (6). Northern blot analysis was performed as previously described (5). The probes specific for the genes encoding LDH (ldh) (accession number U60997) and PFL (pfl) (AB014686) were prepared as described previously (5, 6). The amounts of act, ldh, and pfl mRNA in 10 μg of total RNA were estimated from the peak area and intensity by using a Fluor-S Multi Imager (Bio-Rad) as described previously (5).
Primer extension analysis.
Primer extension analysis was carried out with IRD400-labeled primers act-EX (5′-AAAAATGACAAAGCGAACACCAGGC-3′; positions 360 to 336) for act and pfl-EX (6) for pfl as previously described (6).
Preparation of recombinant proteins.
The act, pfl, and ldh genes were amplified with primers having a BamHI or PstI restriction site in the 5′ or 3′ terminus and ligated into plasmid pQE30. The recombinant plasmid was introduced into E. coli DH5α, which overproduced recombinant proteins. The His-tagged proteins were purified with a HiTrap Chelating HP column (Amersham Pharmacia Biotech). The purified fusion proteins were confirmed to include target proteins, as judged from the molecular weights estimated by sodium dodecyl sulfate-polyacrylamide gel electrophoresis (SDS-PAGE) (19).
Activation of PFL.
PFL-AE activity was estimated from the rate of production of a 83-kDa fragment from PFL (87 kDa), because activated PFL is cleaved into two fragments (83 and 4 kDa) at the radical site in the presence of oxygen (3). The recombinant S. bovis PFL-AE was reconstituted by donating Fe2+ as a cofactor by using the method of Kulzer et al. (18). Each reaction mixture contained 50 mM MOPS (morpholinepropanesulfonic acid)-KOH (pH 7.5), 0.1 M KCl, 0.1 M mercaptoethanol, 0.2 mM Na2S, 0.25 mM Fe(NH4)2(SO4)2, and the recombinant PFL-AE.
The His-tagged S. bovis PFL was activated by the active form of PFL-AE with flavodoxin and chloroplasts by using the method of Knappe and Blaschkowski (17). The detailed procedure and apparatus have been described previously (3). To determine the relative amounts of cleaved PFL, SDS-PAGE was carried out under aerobic conditions. The bands were then analyzed by using a Fluor-S Multi Imager after Western blotting with the PFL antibody as described previously (3).
Western blot analysis of PFL and LDH.
Polyclonal antibodies against PFL and LDH were prepared from a rabbit, and Western blot analysis was performed as previously described (3). The amounts of PFL and LDH were estimated by SDS-PAGE by using a Fluor-S Multi Imager as described above.
Generation of recombinant S. bovis overexpressing PFL and PFL-AE.
The open reading frames (ORFs) of pfl and act were amplified by PCR. The promoter sequences upstream from the ldh and pfl ORFs were also amplified by PCR. The PCR products were blunted with T4 DNA polymerase and phosphorylated with T4 polynucleotide kinase. The resulting promoter sequences were ligated to the pfl and act ORFs, and then the ligated fragments were introduced into SmaI-digested pSBE11 (PF1 to PF3 in Table 1). To generate S. bovis that overexpressed PFL and PFL-AE simultaneously (PF4), the ldh promoter sequence was ligated to the pfl ORF and subsequently ligated to the act gene containing the act ORF and ribosome-binding site. The resulting fragment was also introduced into SmaI-digested pSBE11. The recombinant plasmids were electroporated into S. bovis 12U1 with a Gene Pulser (Bio-Rad) at 12.5 kV/cm and 200 Ω. Transformants of S. bovis were selected with 10 μg of erythromycin per ml.
Estimation of the degradation of act mRNA.
Rifampin (100 μg/ml) was added to cultures at the mid-log growth phase, and cells were harvested every 5 min after the addition of rifampin. The level of rifampin was confirmed to be high enough to inhibit RNA synthesis (4). Degradation of act mRNA was estimated from the decay curve.
Evaluation of data.
Data were evaluated by Tukey's test by using the SigmaStat statistical analysis system (Jandel Scientific, San Rafael, Calif.) at P < 0.05.
Nucleotide sequence accession number.
The nucleotide sequence of the ORF of the S. bovis act gene has been deposited in the GenBank nucleotide sequence database under accession number AB061728.
RESULTS AND DISCUSSION
Characterization of the act gene.
The full-length ORF sequence of the S. bovis act gene was identified from a 3.3-kbp chromosomal fragment hybridized with an act probe. The act operon was 789 bp long and included an ATG initiation codon and a TAG termination codon. The protein encoded by the act operon was calculated to consist of 261 amino acids with a molecular mass of 29,948 Da. The S. bovis PFL-AE showed 79 and 72% amino acid identity to Streptococcus pyogenes PFL-AE (GenBank accession number NP268700) and S. mutans PFL-AE, respectively. The levels of identity and similarity to E. coli PFL-AE were 50 and 61%, respectively. A three-cysteine cluster (Cys-36, Cys-40, and Cys-43), the catalytic site reported for E. coli PFL-AE (18, 26), was found to be conserved in S. bovis PFL-AE.
A putative Shine-Dalgarno sequence was present 10 bp upstream of the act start codon. An inverted repeat sequence, a potential rho-independent transcriptional terminator, was found between position 1072 (18 bp downstream of the termination codon) and position1103. Northern blotting gave a single band that hybridized with an act-specific probe (Fig. 1). The act mRNA was estimated to be approximately 3 kbp long, which is longer than the act ORF (789 bp). No product was detected by primer extension analysis in an 800-bp region upstream of the act start codon (data not shown), probably because the act mRNA is transcribed in a polycistronic fashion. The act mRNA of S. mutans has been reported to be polycistronic (GenBank accession number AF051356).
FIG. 1.

Change in the act mRNA level during growth in batch culture. S. bovis was grown for 2 h (lane 1), 5 h (lane 2), or 6 h (lane 3). Total RNA (10 μg) was added to the gel. The arrow indicates the band that hybridized with an act probe.
In E. coli (22), Clostridium pasteurianum (25), and H. influenzae (9), act is located downstream of pfl, whereas in S. mutans (27) and Lactococcus lactis (1), act is not located near pfl. As in the latter cases, S. bovis act was not located in the vicinity of pfl, suggesting that the act gene is not cotranscribed with pfl.
Activation of PFL by the recombinant PFL-AE.
The molecular mass of the recombinant S. bovis PFL-AE was approximately 30 kDa, as estimated by SDS-PAGE and gel filtration (data not shown). When the recombinant S. bovis PFL was activated with the recombinant PFL-AE under anaerobic conditions and then separated by SDS-PAGE under aerobic conditions, a cleaved PFL fragment was detected (Fig. 2). These results indicate that the protein produced from the act gene was actually PFL-AE and that the PFL-AE activated PFL as a monomeric form. Similarly, E. coli PFL-AE is known to be a monomeric enzyme (18).
FIG. 2.
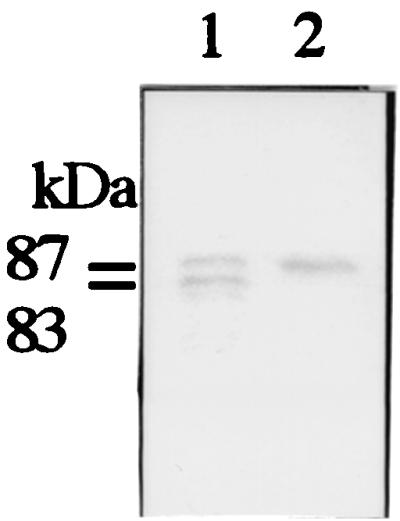
Western blot analysis of PFL protein. PFL was anaerobically incubated with (lane 1) or without (lane 2) PFL-AE.
Transcriptional regulation of the act gene.
When S. bovis was grown on glucose and the pH was maintained at 7.0, the amount of act mRNA increased as the growth rate decreased (Fig. 1 and Table 2). This trend was similar to the change in the pfl mRNA level, which was contrary to the change in the ldh mRNA level (5, 6). PFL-AE activity also increased as the growth rate decreased (Table 2). Since the degradation of act mRNA was not significantly affected by the growth rate or culture conditions (data not shown), the act mRNA level reflects the rate of transcription. Hence, it follows that PFL-AE synthesis in S. bovis is probably regulated at the transcriptional level.
TABLE 2.
Changes in act and pfl mRNA levels, PFL-AE activity, and formate-to-lactate ratio during growth of S. bovis in batch culture
| Time (h) | Growth ratea | Relative amt of mRNAb
|
Relative PFL-AE activityc | Formate-to-lactate ratiod | |
|---|---|---|---|---|---|
| act | pfl | ||||
| 2 | 0.92 | 1.0 | 1.0 | 100 | 0.16 |
| 5 | 0.31 | 1.4 | 1.8 | 150 | 0.29 |
| 6 | 0.14 | 2.4 | 3.4 | 220 | 0.51 |
Growth rate is expressed as the increase in the amount of cellular nitrogen (in milligrams) per hour.
Relative amounts of act and pfl mRNA as estimated by Northern blot analysis.
PFL-AE activity was estimated by cleavage of the PFL protein.
Ratio of the amount of formate to the amount of lactate produced in 1 h.
The act mRNA level decreased with an increase in the dilution rate from 0.1 to 0.6 h−1 at pH 7.0 in both glucose- and ammonia-limited cultures (Table 3). At the same dilution rate and pH, the act mRNA level tended to be slightly higher in the glucose-limited culture than in the ammonia-limited culture. The act mRNA level declined when the pH decreased from 7.0 to 4.5. The change in the act mRNA level was generally in line with the changes in the levels of pfl mRNA and PFL protein, although the pfl mRNA level changed much more than the act mRNA level changed (6). It is conceivable that transcription of the act gene and transcription of the pfl gene in S. bovis are regulated by the same factor(s).
TABLE 3.
Amounts of act and pfl mRNA in S. bovis grown in continuous culture
| Culture conditions | Dilution rate (h−1) | pH | Relative amt of mRNAa
|
|
|---|---|---|---|---|
| act | pfl | |||
| Glucose limited | 0.1 | 6.9 | 1.00 | 1.00 |
| Ammonia limited | 0.1 | 6.9 | 0.95 | 0.88 |
| Glucose limited | 0.6 | 6.9 | 0.71 | 0.66 |
| Ammonia limited | 0.6 | 6.9 | 0.68 | 0.60 |
| Glucose limited | 0.1 | 4.5 | 0.57 | 0.42 |
| Ammonia limited | 0.1 | 4.5 | 0.51 | 0.36 |
Relative amounts of act and pfl mRNA as estimated by Northern blot analysis.
Effects of PFL and PFL-AE activities on formate and lactate production.
The growth rate of S. bovis 12U1 on glucose at pH 7.0 was higher than that on lactose (Table 4), which is similar to the data obtained for the JB1 strain (4). Growth on glucose was faster at pH 7.0 than at pH 4.5. There was no difference in growth rate between a parent strain, 12U1, and any of the recombinant strains, PF1, PF2, PF3, or PF4, irrespective of the culture conditions, which indicates that overproduction of PFL, PFL-AE, and LDH did not affect the growth rate.
TABLE 4.
Effects of overexpression of PFL and PFL-AE on the ratio of formate to lactate produceda
| S. bovis strain | Energy source | pH | Growth rateb | Relative amt of mRNAc
|
Relative amt of proteind
|
Ratio of formate to lactatee | |||
|---|---|---|---|---|---|---|---|---|---|
| pfl | act | ldh | PFL | LDH | |||||
| 12U1 | Glucose | 7.0 | 0.98 A | 1.0 B | 1.0 B | 1.0 B | 1.0 B | 1.0 B | 0.07 B |
| Lactose | 7.0 | 0.78 B | 5.0 A | 2.4 A | 0.5 C | 4.2 A | 0.4 C | 0.57 A | |
| Glucose | 4.5 | 0.36 C | 0.6 C | 0.3 C | 2.0 A | 0.3 C | 2.1 A | 0.01 C | |
| PF1 | Glucose | 7.0 | 0.94 A | 1.6 B | 1.0 B | 1.0 B | 1.5 B | 1.0 B | 0.07 B |
| Lactose | 7.0 | 0.78 B | 6.0 A | 2.3 A | 0.5 C | 4.0 A | 0.5 C | 0.51 A | |
| Glucose | 4.5 | 0.37 C | 0.9 C | 0.3 C | 2.1 A | 0.3 C | 1.9 A | 0.02 C | |
| PF2 | Glucose | 7.0 | 0.94 A | 12.7 ABf | 1.1 B | 1.1 B | 9.8 Af | 1.1 B | 0.13 Bf |
| Lactose | 7.0 | 0.78 B | 10.1 Bf | 2.3 A | 0.5 C | 7.2 Bf | 0.5 C | 1.00 Af | |
| Glucose | 4.5 | 0.37 C | 14.5 Af | 0.3 C | 2.0 A | 9.5 Af | 2.0 A | 0.04 Cf | |
| PF3 | Glucose | 7.0 | 0.89 A | 1.0 B | 5.0 Af | 1.1 B | 0.9 B | 1.2 B | 0.08 B |
| Lactose | 7.0 | 0.78 B | 4.9 A | 4.5 Af | 0.4 C | 3.9 A | 0.4 C | 0.63 A | |
| Glucose | 4.5 | 0.36 C | 0.5 C | 5.2 Af | 1.9 A | 0.4 C | 1.9 A | 0.02 C | |
| PF4 | Glucose | 7.0 | 0.88 A | 13.2 ABf | 4.9 Af,g | 1.1 B | 9.4 Af | 1.1 B | 0.21 Bf,g |
| Lactose | 7.0 | 0.78 B | 10.7 Bf | 4.7 Af,g | 0.5 C | 7.0 Bf | 0.5 C | 1.25 Af,g | |
| Glucose | 4.5 | 0.46 C | 14.6 Af | 5.0 Af,g | 1.9 A | 9.6 Af | 2.0 A | 0.07 Cf,g | |
Within each column values followed by different letters for each strain are significantly different (P < 0.05).
Growth rate is expressed as the increase in the amount of cellular nitrogen (in milligrams) per hour during the log stage.
Relative amounts of mRNA as estimated by Northern blot analysis.
Relative amounts of PFL and LDH as estimated by Western blot analysis.
Ratio of the amount of formate to the amount of lactate produced in 1 h.
Significantly different from the corresponding value for the parent strain, 12U1 (P < 0.01).
Significantly different from the corresponding value for PF2 (P < 0.05).
When pH 7.0 cultures were used, 12U1 cells grown on lactose contained a higher level of pfl mRNA and a lower level of ldh mRNA than cells grown on glucose contained, which was reflected in the amounts of PFL and LDH (Table 4). The act mRNA level was in line with the pfl mRNA level, suggesting that the PFL-AE level increased when a culture was grown on lactose. Thus, it appears that the level of PFL-AE increases when the level of PFL increases. As a result, the ratio of formate to lactate was much greater when a culture was grown on lactose, which was similar to the results obtained with the JB1 strain (4).
When 12U1 was grown on glucose, the pfl mRNA, act mRNA, and PFL levels were decreased and the ldh mRNA and LDH levels were increased by reducing the culture pH from 7.0 to 4.5 (Table 4). As a result, the ratio of formate to lactate decreased greatly. It is likely that the change in the formate-to-lactate ratio was also caused by changes in the intracellular concentrations of fructose 1,6-bisphosphate, dihydroxyacetone phosphate, and d-glyceraldehyde 3-phosphate, because the levels of these glycolytic intermediates changed in response to a reduced pH (4).
The PF1 strain, possessing a plasmid containing pfl with a pfl promoter (Table 1), contained slightly, but insignificantly, larger amounts of pfl mRNA and PFL than its parent strain (Table 4). The ratios of formate to lactate in PF1 and 12U1 were not different. However, PF2, which has a plasmid containing pfl and an ldh promoter, overexpressed PFL under all the conditions examined. The levels of act mRNA, ldh mRNA, and LDH were not different in PF2 and 12U1. As a result, the formate-to-lactate ratio increased. However, a great increase in the PFL level did not lead to a great increase in the formate-to-lactate ratio, probably because the amount of PFL was much smaller than the amount of LDH, and in addition, not all the PFL was activated.
When cultures were grown on glucose at pH 7.0, the pfl mRNA level in PF2 cells was 13-fold higher than the pfl mRNA level in 12U1 cells (Table 4), suggesting that pfl transcription from the plasmid was stimulated when the ldh promoter was used. When cultures were grown on glucose at pH 4.5, PF2 had 24-fold-higher level of pfl mRNA than 12U1. This result suggests that activation of the ldh promoter was triggered by a reduction in pH, as observed for the transcription of S. bovis ldh (5, 6).
When cultures were grown on lactose, the pfl mRNA level in PF2 cells was only twofold higher than the pfl mRNA level in 12U1 cells (Table 4). In 12U1 the pfl mRNA level was fivefold higher when cells were grown on lactose than when cells were grown on glucose, but in PF2 the pfl mRNA level in lactose-grown cells was not significantly different from the pfl mRNA level in glucose-grown cells. In other words, the total amount of pfl transcript, from the chromosome and plasmid, was not increased by lactose. Probably, pfl transcription from the plasmid was decreased by lactose because of usage of the ldh promoter. This is in line with the finding that the ldh mRNA level decreased when 12U1 was grown on lactose (Table 4 and Fig. 3).
FIG. 3.

Primer extension analysis of S. bovis pfl mRNA in S. bovis 12U1 and PF2. The upper and lower arrows indicate the pfl mRNA from the chromosome and the plasmid, respectively. Lanes 1 to 3, 12U1 grown on glucose at pH 7.0 (lane 1), on lactose at pH 7.0 (lane 2), or on glucose at pH 4.5 (lane 3); lanes 4 to 6, PF2 grown on glucose at pH 7.0 (lane 4), on lactose at pH 7.0 (lane 5), or on glucose at pH 4.5 (lane 6).
Primer extension analysis, which was performed by using the difference in length between the pfl and ldh promoters, indicated that the amount of pfl mRNA from the plasmid was much smaller when PF2 was grown on lactose than when PF2 was grown on glucose (Fig. 3). Since the pfl mRNA level in PF1 having a pfl promoter in the plasmid was not significantly different from the pfl mRNA level in the parent strain (Table 4), the copy number of the plasmid was probably small. Therefore, the amount of pfl mRNA from the plasmid in PF2 probably reflects the rate of transcription. Thus, transcription of the introduced pfl was controlled by the ldh promoter.
The pfl mRNA level in PF2 was much higher than the pfl mRNA level in PF1 when cultures were grown on glucose (Table 4), indicating that the ldh promoter was much more active than the pfl promoter. This is consistent with the results of primer extension analysis (Fig. 3). Hence, in terms of enzyme production from chromosomal DNA, the amount of LDH is probably much larger than the amount of PFL when glucose is an energy substrate. Even when PFL was overproduced from the plasmid, the level of PFL was still less than the level of LDH, which partly explains why the formate-to-lactate ratio did not increase greatly despite a great increase in the PFL level (Table 4). In addition, not all the PFL protein was present as the active form.
On the other hand, when PF2 was grown on lactose, the level of pfl mRNA expressed from the plasmid was slightly lower than the level expressed from the chromosome because of reduced activity of the ldh promoter (Fig. 3). As a result, the difference in the amount of PFL between PF1 and PF2 (1.8-fold) was smaller than the difference observed when glucose was a substrate (6.5-fold) (Table 4). However, the formate-to-lactate ratio increased from 0.51 (PF1) to 1.00 (PF2), because the LDH level decreased when lactose was a substrate. Furthermore, as described above, it is likely that PFL was activated and LDH was inactivated by glycolytic intermediates under these conditions.
PFL activity may also be affected by PFL-AE activity. The PF3 strain, which harbors a plasmid containing an ldh promoter and the act gene, had higher levels of act mRNA than 12U1 (Table 4). It is conceivable that PF3 produced higher levels of PFL-AE. However, the formate-to-lactate ratio was not significantly different from the value for 12U1, suggesting that the amount of PFL-AE was sufficient to activate PFL in 12U1.
The formate-to-lactate ratio was increased by increasing the transcription of both the pfl and act genes under all the culture conditions examined (PF4), compared to the ratio in PF2 (Table 4). This finding suggests that more PFL-AE is needed to maximize PFL activation when the PFL level increases. However, even in PF4, the amount of formate produced was much less than the amount of lactate produced when cells were grown on glucose. As mentioned above, the amount of LDH is probably much larger than the amount of PFL, and in addition, the allosteric effects of glycolytic intermediates on LDH and PFL activities may be great.
There is a possibility that all the overproduced PFL-AE was not present as an active enzyme because of Fe2+ deficiency. It has been reported that E. coli PFL-AE requires Fe2+ for catalytic activity (7). The enzyme contains one iron per polypeptide chain (26). When E. coli PFL-AE was overexpressed in E. coli by introducing an act-containing plasmid, most PFL-AE was present as an apoform because of Fe2+ deficiency (18). The holoform of PFL-AE could be reconstituted from the apoform by addition of Fe2+ and sulfide (18). When PFL synthesis and PFL-AE synthesis are simultaneously enhanced, the intracellular Fe2+ level may need to be raised for maximal activation of PFL.
Conclusions.
The act mRNA level in S. bovis changed in response to changes in growth conditions, and the change was parallel to the change in the pfl mRNA level. PFL-AE synthesis appears to change in parallel with PFL synthesis. Overexpression of PFL resulted in an increase in the formate-to-lactate ratio. However, when PFL-AE was overexpressed, the formate-to-lactate ratio did not change, suggesting that PFL-AE is present at a level that is high enough to activate PFL. When both PFL-AE and PFL were overexpressed, the formate-to-lactate ratio increased further. These results indicate that a great increase in PFL and PFL-AE levels is needed to decrease lactate production, probably because the amount of LDH is usually much larger than the amount of PFL.
Acknowledgments
This study was supported in part by grants-in-aid for scientific research 4108 and 13660273 from the Ministry of Education, Culture, Sports, Science, and Technology of Japan and by research fellowship 4108 from the Japan Society for the Promotion of Science for Young Scientists.
REFERENCES
- 1.Arnau, J., F. Jorgensen, S. M. Madsen, A. Vrang, and H. Israelsen. 1997. Cloning, expression, and characterization of the Lactococcus lactis pfl gene, encoding pyruvate formate-lyase. J. Bacteriol. 179:5884-5891. [DOI] [PMC free article] [PubMed] [Google Scholar]
- 2.Asanuma, N., and T. Hino. 1997. Tolerance to low pH and lactate production in rumen bacteria. Anim. Sci. Technol. 68:367-376. [Google Scholar]
- 3.Asanuma, N., and T. Hino. 2000. Effect of pH and energy supply on the activity and amount of pyruvate formate-lyase in Streptococcus bovis. Appl. Environ. Microbiol. 66:3773-3777. [DOI] [PMC free article] [PubMed] [Google Scholar]
- 4.Asanuma, N., and T. Hino. Fructose bisphosphate aldolase activity and glycolytic intermediate concentrations in relation to lactate production in Streptococcus bovis. Anaerobe, in press.
- 5.Asanuma, N., M. Iwamoto, and T. Hino. 1997. Regulation of lactate dehydrogenase synthesis in a ruminal bacterium, Streptococcus bovis. J. Gen. Appl. Microbiol. 43:325-331. [DOI] [PubMed] [Google Scholar]
- 6.Asanuma, N., M. Iwamoto, and T. Hino. 1999. Structure and transcriptional regulation of the gene encoding pyruvate formate-lyase of a ruminal bacterium, Streptococcus bovis. Microbiology 145:151-157. [DOI] [PubMed] [Google Scholar]
- 7.Conradt, H., M. Hohmann-Berger, H. P. Hohmann, H. P. Blaschkowski, and J. Knappe. 1984. Pyruvate formate-lyase-activating enzyme of Escherichia coli: isolation and structural properties. Arch. Biochem. Biophys. 228:133-142. [DOI] [PubMed] [Google Scholar]
- 8.Dawson, K. A., M. A. Rasmussen, and M. J. Allison. 1997. Digestive disorders and nutritional toxicity, p. 633-660. In P. N. Hobson and C. S. Stewart (ed.), The rumen microbial ecosystem, 2nd ed. Blackie Academic and Professional, London, England.
- 9.Fleischmann, R. D., M. D. Adams, O. White, R. A. Clayton, E. F. Kirkness, A. R. Kerlavage, C. J. Bult, J. F. Tomp, B. A. Doughetry, J. M. Merrick et al. 1995. Whole-genome random sequencing and assembly of Haemophilus influenzae Rd. Science 269:496-512. [DOI] [PubMed] [Google Scholar]
- 10.Hardie, J. M. 1986. Other streptococci, p. 1068-1071. In P. H. A. Sneath, N. S. Mair, M. E. Sharpe, and J. G. Holt (ed.), Bergey's manual of systematic bacteriology, vol. 2. Williams and Wilkins, Baltimore, Md.
- 11.Hino, T., K. Shimada, and T. Maruyama. 1994. Substrate preference in a strain of Megasphaera elsdenii, a ruminal bacterium, and its implications in propionate production and growth competition. Appl. Environ. Microbiol. 60:1827-1831. [DOI] [PMC free article] [PubMed] [Google Scholar]
- 12.Hungate, R. E. 1966. Rumen and its microbes, p. 454. Academic Press, New York, N.Y.
- 13.Iwamoto, M., N. Asanuma, and T. Hino. 2001. Effects of pH and electron donors on nitrate and nitrite reduction in ruminal microbiota. Anim. Sci. J. 72:117-125. [Google Scholar]
- 14.Iwamoto, M., N. Asanuma, and T. Hino. 2001. Effect of energy substrates on nitrate reduction and nitrate reductase activity in a ruminal bacterium, Selenomonas ruminantium. Anaerobe 7:315-321. [Google Scholar]
- 15.Kessler, D., and J. Knappe. 1996. Anaerobic dissimilation of pyruvate, p. 199-205. In F. C. Neidhardt, R. Curtiss III, J. L. Ingraham, E. C. C. Lin, K. B. Low, B. Magasanik, W. S. Reznikoff, M. Riley, M. Schaechter, and H. E. Umbarger (ed.), Escherichia coli and Salmonella: cellular and molecular biology, 2nd ed., vol. 1. ASM Press, Washington, D.C.
- 16.Kirchgessner, M., W. Windisch, and H. L. Muller. 1995. Nutritional factors for the quantification of methane production, p. 317-331. In W. A. Engelhardt, S. Leonhard-Marek, G. Breves, and D. Giesecke (ed.), Ruminant physiology: digestion, metabolism, growth and reproduction. Ferdinand Enke Verlag, Stuttgart, Germany.
- 17.Knappe, J., and H. P. Blaschkowski. 1975. Pyruvate formate-lyase from Escherichia coli and its activation system. Methods Enzymol. 41:508-518. [DOI] [PubMed] [Google Scholar]
- 18.Kulzer, R., T. Pils, R. Kappl, J. Huttermann, and J. Knappe. 1998. Reconstitution and characterization of the polynuclear iron-sulfur cluster in pyruvate formate-lyase-activating enzyme. Molecular properties of the holoenzyme form. J. Biol. Chem. 273:4897-4903. [DOI] [PubMed] [Google Scholar]
- 19.Laemmli, U. K. 1970. Cleavage of structural proteins during the assembly of the head of bacteriophage T4. Nature 227:680-685. [DOI] [PubMed] [Google Scholar]
- 20.Marounek, M., and S. Bartos. 1987. Interactions between rumen amylolytic and lactate-utilizing bacteria in growth on starch. J. Appl. Bacteriol. 63:233-238. [DOI] [PubMed] [Google Scholar]
- 21.Nakamura, M., K. Ogata, T. Nagamine, K. Tajima, H. Matsui, and Y. Benno. 2001. The replicon of the cryptic plasmid pSBO1 isolated from Streptococcus bovis JB1. Curr. Microbiol. 43:11-16. [DOI] [PubMed] [Google Scholar]
- 22.Rodel, W., W. Plaga, R. Frank, and J. Knappe. 1988. Primary structures of Escherichia coli pyruvate formate-lyase and pyruvate formate-lyase-activating enzyme deduced from the DNA nucleotide sequences. Eur. J. Biochem. 177:153-158. [DOI] [PubMed] [Google Scholar]
- 23.Russell, J. B., and T. Hino. 1985. Regulation of lactate production in Streptococcus bovis, a spiraling effect that contributes to rumen acidosis. J. Dairy Sci. 68:1712-1721. [DOI] [PubMed] [Google Scholar]
- 24.Russell, J. B., and R. J. Wallace. 1997. Energy-yielding and energy-consuming reactions, p. 246-282. In P. N. Hobson and C. S. Stewart (ed.), The rumen microbial ecosystem, 2nd ed. Blackie Academic and Professional, London, England.
- 25.Weidner, G., and G. Sawers. 1996. Molecular characterization of the genes encoding pyruvate formate-lyase and its activating enzyme of Clostridium pasteurianum. J. Bacteriol. 178:2440-2444. [DOI] [PMC free article] [PubMed] [Google Scholar]
- 26.Wong, K. K., B. W. Murray, S. A. Lewisch, M. K. Baxter, T. W. Ridky, L. Ulissi DeMario, and J. W. Kozarich. 1993. Molecular properties of pyruvate formate-lyase activating enzyme. Biochemistry 32:14102-14110. [DOI] [PubMed] [Google Scholar]
- 27.Yamamoto, Y., Y. Sato, S. Takahashi-Abbe, N. Takahashi, and H. Kizaki. 2000. Characterization of the Streptococcus mutans pyruvate formate-lyase (PFL)-activating enzyme gene by complementary reconstitution of the in vitro PFL-reactivating system. Infect. Immun. 68:4773-4777. [DOI] [PMC free article] [PubMed] [Google Scholar]