Abstract
All of the marine bacterioplankton-derived 16S ribosomal DNA sequences previously deposited in GenBank were reanalyzed to determine the number of bacterial species in the oceanic surface waters. These sequences have been entered into the database since 1990. The rate of new additions reached a peak in 1999 and subsequently leveled off, suggesting that much of the marine microbial species richness has been sampled. When the GenBank sequences were dereplicated by using 97% similarity as a cutoff, 1,117 unique ribotypes were found. Of the unique sequences, 609 came from uncultured environmental clones and 508 came from cultured bacteria. We conclude that the apparent bacterioplankton species richness is relatively low.
There are approximately 106 bacterial cells per ml of surface seawater throughout the world's oceans (8). While this number has been known for at least 30 years, we still do not know how many bacterial species are actually present in the bacterioplankton. Addressing this question has been hampered by uncertainty as to how to define a bacterial species and a distrust of conventional cultivation techniques due to the sharp discrepancy between total and viable counts in seawater. The latter obstacle was circumvented by cloning and sequencing of 16S ribosomal DNAs (rDNAs) from uncultured marine microbial communities. Initially, these studies suggested that there is an immense amount of marine microbial diversity (15, 27).
Bacterial “species” are usually described by empirical criteria. DNA-DNA cross-hybridization of >70% has been suggested to indicate that two bacteria belong to the same species (28). This criterion was further developed by several authors who demonstrated that bacteria with cross-hybridization levels of >70% have a 16S rDNA sequence similarity of >97% (3, 6, 23). Hagström et al. analyzed the degree of DNA-DNA relatedness versus 16S similarity for a large number of marine isolates and found that a 16S rDNA sequence similarity of ≥97% is a reasonable level for grouping bacteria into species (16). The species definition based on 16S rDNA similarity has matured to the point that it has been entered into a major microbiological textbook (17).
The number of reported marine bacterioplankton bacteria has grown mostly by sequencing 16S rDNA genes from environmental DNA (1, 12, 15, 20). The assumed immense species richness of marine bacterioplankton is thus based solely on 16S rDNA diversity. However, as with all empirical classification schemes, the use of 16S rDNA is not without drawbacks. Reports of distinctly different copies of 16S rDNA from the same organism and phenotypic variability in bacterial isolates with high 16S rDNA similarity suggest an inherent uncertainty in the approach (21, 29, 30). Indeed, concerns about how to use new sequence information to place marine bacterioplankton into appropriate taxa has led researchers to add all new 16S sequencing data to the public databases. To date, no comprehensive overview of this vast amount of data has been presented. Thus, we tested the current assumption of great bacterioplankton species richness using 16S rDNAs sequences previously submitted to GenBank. Here we report the results of this analysis and conclude that the species richness of marine bacterioplankton is relatively low.
Sequences and their GenBank-associated files were downloaded from the National Center for Biotechnology Information website (http://www.ncbi.nlm.nih.gov/). Sequences were initially dereplicated into groups with >97% identity by using the pairwise comparison program FastGroup (22). To determine which sequences represented another section of the same 16S rDNA gene, SeqMan II software (Lasergene version 5; DNA Star, Inc., Madison, Wis.) was used to build consensus 16S rDNA sequences. BLAST analyses (2) of the consensus sequences were done both with SeqMan II software and directly from the National Center for Biotechnology Information website (http://www.ncbi.nlm.nih.gov/BLAST).
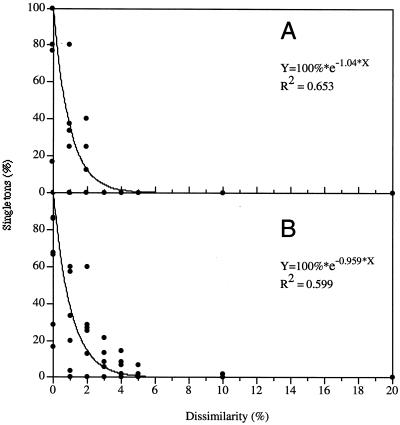
A 16S rDNA sequence similarity of >97% has been proposed as delimiter for bacterial species (16). To confirm this choice and to estimate the degree of variation in sequences from the same organism, 16S rDNAs from completely sequenced genomes were extracted and compared to each other by using SeqMan II software (Table 1). Essentially, contigs were assembled by using dissimilarity values from 0 to 20%, and the number of resulting single sequences (singletons) not compatible with the contig consensus was recorded. Percentages of singletons were plotted against dissimilarity levels (Fig. 1). The data set could be described by the first-order decay function:
 |
(1) |
where x is the dissimilarity level, a is the initial slope (at x = 0) of the curve, and y is the singleton ratio for the set of sequences. This model indicates that high similarity levels do not guarantee complete species singularity and uncertainty in sequences must be considered. The reasons for this uncertainty could be errors in sequencing and handling (26), as well as intergenomic (i.e., between two alleles in the same organism) and intraspecies (i.e., between two organisms from the same species) variation.
TABLE 1.
Similarity of ribosomal sequences retrieved from GenBank from the same organismsa
| rDNA | Organism | No. of sequences retrieved | 100% similarity
|
|
|---|---|---|---|---|
| No. of contigs | No. of singletons | |||
| Eukaryote, 18S | Arabidopsis thaliana | 6 | 3 | 1 |
| Arabidopsis thaliana mitochondrial 16S rDNA | 6 | 2 | 1 | |
| Chlorella vulgaris | 4 | 4 | 4 | |
| Chlorella vulgaris mitochondrial 16S rDNA | 12 | 9 | 8 | |
| Drosophila melanogaster | 5 | 5 | 4 | |
| Mus musculus | 8 | 7 | 6 | |
| Oryctolagus cuniculus | 4 | 4 | 4 | |
| Saccharomyces cerevisiae | 18 | 13 | 10 | |
| Prokaryote, 16S | Borrelia burgdorferi | 55 | 44 | 37 |
| Chlamydia trachomatis | 15 | 8 | 6 | |
| Haemophilus influenzae | 15 | 14 | 13 | |
| Methanococcus maripaludis | 5 | 5 | 5 | |
| Vibrio cholerae | 14 | 13 | 12 | |
| Yersinia pestis | 29 | 25 | 17 | |
Contigs were assembled, and 100% similarity results are presented as an upper limit to illustrate redundancy within the sequence information.
FIG. 1.
Uncertainty of ribosomal gene sequences retrieved from GenBank from the same organism. (A) Eukaryotic 18S rDNA; (B) prokaryotic or mitochondrial 16S rDNA. The percentages of singletons resulting from both analyses were plotted as functions of sequences dissimilarity. The curves represent the best fit according to a first-order decay function.
Figure 1 shows that above a certain level of sequence similarity no increase in the taxonomic resolution can be expected due to the inherent uncertainty of the information. Using equation 1, it can be estimated that at the level suggested for species delineation (≥97%), a set of 100 small-subunit rDNA sequences from the same organism is likely to contain 5.6 singletons (not joining the contig consensus). This result demonstrates the difficulty of using 16S rDNA sequences for taxonomic delineation at high resolution. The empirical level of 97% sequence similarity thus represents an upper limit of useful information.
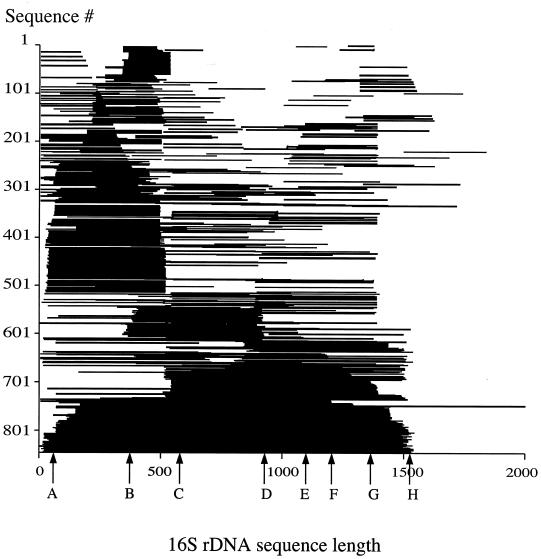
Given that 97% similarity at the 16S rDNA locus is a useful criterion for dereplicating bacterial species, we asked what the bacterioplankton species richness in GenBank is. To retrieve the sequences for marine bacterioplankton from the database, four Boolean search strings were designed (Table 2). This was done as an iterative process; that is, retrieved sequences were manually checked and the search string was modified to maximize the number of sequences with the minimum of false positives. The uncultured-bacterium search string retrieved 1,467 sequences on 1 March 2001. To determine which sequences belong to the same bacterial species, the pairwise comparison program FastGroup (22) was used to group redundant sequences (≥97% similar). Short sequences (<100 bp) were also removed. This reduced the number of sequences by 34%. Commonly used primer sites were used to order the fragments with the Escherichia coli 16S rDNA gene. The sequences were distributed all over the gene and in many cases were very short (≤200 bp) (Fig. 2). Thus, fragments entered by different authors may belong to the same species although they cover different parts of the gene.
TABLE 2.
Search strings used to assess marine bacterioplankton 16S rDNA sequences from the GenBank database (NCBI Entrez), 10 August 2001
| Object | Search stringa | No. of sequences |
|---|---|---|
| 1. Search for bacteria | bacteria[Organism] OR prokaryote[Organism] NOT archaea[Organism] | 132,797 |
| 2. Search for 16S rDNA sequences | 16S rDNA OR 16S rRNA OR 16S ribosomal RNA OR 16S ribosomal RNA gene OR 16S small subunit ribosomal RNA OR small subunit ribosomal RNA gene OR 16S rRNA gene | 63,473 |
| 3. Search for marine bacterioplankton | marine[Text Word] OR marine[Title Word] OR coastal[Text Word] OR coastal[Title Word] OR ocean[Text Word] OR ocean[Title Word] OR bacterioplankton[Text Word] OR bacterioplankton[Title Word]) NOT (soil* OR sediment* OR sand OR biofilm* OR freshwater* OR pond* OR lake* OR deep-sea OR hydrothermal OR groundwater OR borehole* OR mud* OR petroleum OR “marine snow” OR aquifer* OR halophil* OR oil OR diesel OR crust OR anaerob* OR symbiont* OR hygiene OR rhizosphere OR associated OR viable OR biofilter OR reactor OR sludge OR gland OR spleen OR ATT[Title Word] OR anoxic[Text Word]) | 15,666 |
| 4. Search for uncultured environmental clones | clone OR unknown OR uncultured OR unclassified OR unidentified OR uncultivated OR environmental[Title Word] | 11,774,806 |
| Cultured and uncultured marine bacterioplankton | X = 1 AND 2 AND 3 | 3,298 |
| Uncultured marine bacterioplankton | Y = 1 AND 2 AND 3 AND 4 | 1,645 |
| Cultured marine bacterioplankton | X − Y | 1,653 |
Boolean operators are in all capitals.
FIG. 2.
Overview of uncultured bacterioplankton 16S rDNA sequences from GenBank. Respective fragments were aligned according to the positions of commonly used primers (E. coli numbering: A, 6 to 26; B, 337 to 358; C, 515 to 530; D, 907 to 926; E, 1055 to 1074; F, 1249 to 1265; G, 1342 to 1369; H, 1492 to 1513).
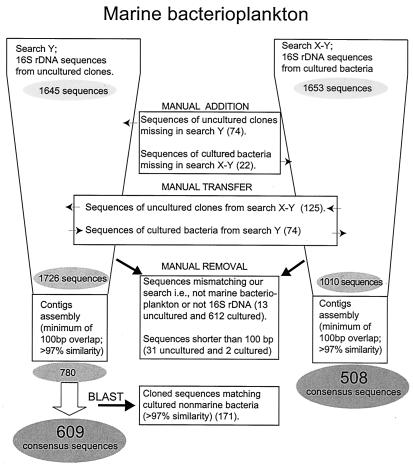
The final improved Boolean search for 16S rDNAs was performed on 10 August 2001 and resulted in 1,645 sequences from uncultured bacteria. We found that 74 of the entries actually belonged to cultured bacteria, and they were manually moved to that list (described below). Another 125 uncultured clones were identified during the searches for cultured bacteria, and these sequences were added to this data set. Together with other small transfers (Fig. 3), this raised the number of uncultured-bacterium sequences to 1,726. By using SeqMan II software, sets of overlapping DNA fragments were assembled into contigs based on a ≥100-bp overlap and ≥97% similarity within the overlapping regions. Since conserved regions in the 16S rDNA are shorter than 30 bp (25), the 100-bp overlap always includes at least one variable region. The continued distillation process reduced the number of sequences by 55% (Fig. 3). The resulting 780 uncultured-bacterium consensus sequences were subjected to a BLAST search (2) to find their closest related sequences in GenBank (4). In this step, 171 uncultured-bacterium consensus sequences were found to have ≥97% similarity to cultured bacteria and were therefore removed. Since the majority of these bacteria lack a marine label, these sequences were not included in the cultured-bacterioplankton group (Fig. 3). The final distillate thus encompasses 609 uncultured-marine-bacterium consensus sequences.
FIG. 3.
Distillation process for species delineation of marine bacterioplankton based on 16S rDNA sequences. Detailed data sets from each step of the distillation process are available at http://www.bom.hik.se/∼mme/genomics/distillationprocess.html.
Determining the number of cultured-bacterioplankton 16S rDNAs was much less straightforward because many authors have submitted sequences without referring to the origin of the isolate. An indirect search excluding the search string that specifically looked for cloned or uncultured entries (Table 2) resulted in 1,653 sequences. Our attempts to refine this search string were largely unsuccessful; thus, these entries were manually sorted, resulting in an initial data set for cultured bacteria of 1,010 sequences. By using SeqMan II software, a contig assembly, with parameters identical to those for the uncultured-bacterium sequences, was run for the cultured-bacterioplankton sequences. Based on 97% sequence similarity, 508 cultured-bacterium consensus sequences were formed, and the degree of redundancy (50%) was similar to that of the uncultured fraction (55%). It could be concluded that in both groups the amount of redundant sequences in the database was large even at the level of 100% similarity, and this condition should be addressed in order to make the database a more efficient tool.
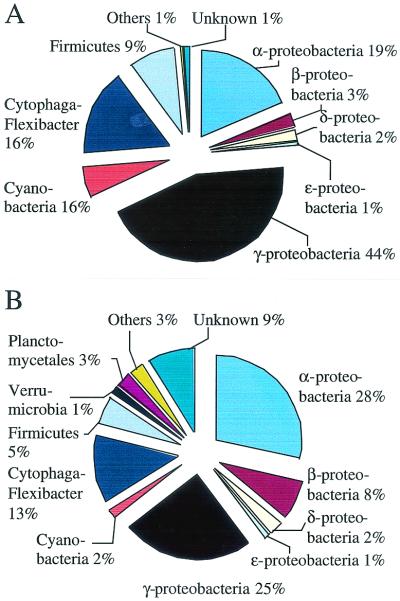
Both the cultured and uncultured groups of bacteria were assigned to major taxonomic groupings (Fig. 4) by using the submitting author's suggestion or, when this information was lacking, by a BLAST (2) search looking for sequence similarity at the genus level (93% similarity) (6, 7, 29). The majority of the sequences could be assigned by this method; the remaining unassigned sequences were usually short, and many showed low similarity to bacteria. The γ-Proteobacteria subdivision was dominant in the overall distribution of the cultured taxa, whereas the α-Proteobacteria were more prominent in the uncultured-bacterium distribution (Fig. 4). The major difference between the distributions was the presence of the bacterial groups Planctomycetales and Verrumicrobiales within the uncultured bacterioplankton. In the future, the relative importance of the different bacterioplankton taxa will be revised for a number of reasons. One important source of error may be the cloning bias, reported by Cottrell and Kirchman, which results in similar 16S sequences being retrieved from many sites while many of the other 16S rRNA genes present are missed (5). The results on bacterioplankton taxonomy presented here may, however, serve as an initial reference.
FIG. 4.
Taxonomic distribution of cultured (A) and uncultured (B) marine bacterioplankton based on 16S rDNA sequences available in GenBank.
To test the phylogenetic grouping of the contigs obtained and the accuracy of the database search, the well-established SAR11 gene cluster was given a closer look (15). The SAR11 cluster is an isolated branch of the α subdivision of the Proteobacteria. The worldwide occurrence of this 16S rDNA has been established through clones from several libraries, which makes the SAR11 gene cluster a relevant control group. Two research groups have presented phylogenetic trees for these particular sequences, resulting in five or six main phylogenetic groups (10, 13). From published data, a list of 229 sequences belonging to the SAR11 gene cluster was compiled (http://www.bom.hik.se/∼mme/genomics/distillationprocess.html). Matches to these sequences were found in 29 of the 780 uncultured-bacterium consensus sequences assembled. Of these 29 consensus sequences, 23 were singletons forming outliers that could not be assembled with other sequences. The remaining 206 sequences were found in six contigs corresponding to the SAR groups of Field et al. (10), two contigs each in A1 and B2 plus one contig each in A2 and G1. Thus, since the comparison between the SAR11 cluster and our assembled contigs conformed with the established lineages, we concluded that a reasonable degree of confidence could be put in the distillation process.
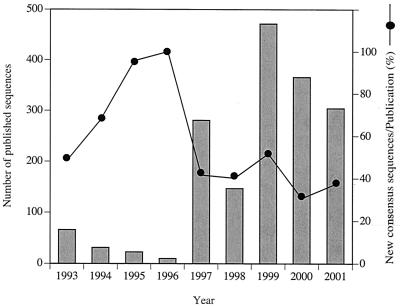
In the early 1990s, Ward et al. (27) invited marine microbiologists to work intensively on the sequencing of the 16S rDNA gene, expecting that marine bacterioplankton diversity would be great. The response during that decade was fast, and databases were rapidly extended. Based on the annual submissions, the number of uncultured-bacterioplankton sequences initially increased (Fig. 5). However, today the rate of new entries seems to have reached a plateau. Furthermore, the annual ratio of new consensus sequences per publication decreased towards the end of the investigated period. The reason for the reduction in new entries could be that interest in marine bacterioplankton diversity has diminished or that few new sequences are found, as indicated by the high degree of redundancy. The latter explanation has been pointed out by Giovannoni and Rappé, who stated that a relatively small number of marine bacterioplankton clades account for 80% of the marine bacteria 16S rDNA recovered from seawater (14). Also, based on our own experience of not finding many unknown sequences, the relatively low number of bacterial species found in the present analysis was not surprising. We concluded that the current database information may already constitute good coverage of the 16S rDNA sequences present in the pelagic marine environment.
FIG. 5.
Evolution through the last decade of the number of uncultured bacterioplankton 16S rDNA sequences published in GenBank. Contigs were assembled from the sequences added annually, and the ratio of the number of new contigs to the number of publications per year was calculated.
Does this also imply good coverage of the global bacterioplankton diversity? Estimates of the species richness for larger organisms are commonly determined by extrapolating species numbers in size categories (18). However, this method seems to be inadequate for microorganisms (9). Since barriers to migration and dispersal are ineffective, there is a strong tendency toward cosmopolitanism of microorganisms (11). Evolutionary bottlenecks (i.e., isolation of a part of a population necessary for speciation) are therefore unlikely among globally distributed organisms. Ciliates have been used to test this view, since their morphological traits can be used for identification. The almost flat species-area curve found for free-living ciliated protozoa allowed Finlay et al. to estimate the global species richness of ciliates at not more than 3,000 species (11). In a study of marine bacterioplankton diversity, Hagström et al. found several examples of identical isolates from different sea areas (16). In this study we found 1,200 bacterial species, which, if they represent the existing adaptation of bacteria to the marine pelagic environment, would allow for 50 niches in each of three geographic regions (arctic, temporal, and tropical) during each of four seasons and would be divided between nearshore and offshore waters. Typically, estimates of the number of dominant bacterioplankton species based on denaturing gradient gel electrophoresis, terminal-restriction fragment length polymorphism, and theoretical considerations amount to fewer than 50 dominant species in a random water sample (24, 19). It is therefore tempting to suggest that a global distribution of bacterioplankton species exists and that it should be possible to determine this distribution with reasonable accuracy.
Acknowledgments
This work was supported by Swedish Science Council grant NFR B 650-19981070 (Å.H.) and by NSF grant SGER OCE-0116900 (F.R.).
REFERENCES
- 1.Acinas, S. G., J. Antón, and F. Rodríguez-Valera. 1999. Diversity of free-living attached bacteria in offshore western Mediterranean waters as depicted by analysis of genes encoding 16S rRNA. Appl. Environ. Microbiol. 65:514-522. [DOI] [PMC free article] [PubMed] [Google Scholar]
- 2.Altschul, S. F., T. L. Madden, A. A. Schäffer, Z. Zhang, W. Miller, and D. J. Lipman. 1997. Gapped BLAST and PSI-BLAST: a new generation of protein database search programs. Nucleic Acids Res. 25:3389-3402. [DOI] [PMC free article] [PubMed] [Google Scholar]
- 3.Amann, R. I., C. Lin, R. Key, L. Montgomery, and D. A. Stahl. 1992. Diversity among Fibrobacter isolates: towards a phylogenetic classification. Syst. Appl. Microbiol. 15:23-31. [Google Scholar]
- 4.Benson, D. A., I. Karsch-Mizrachi, D. J. Lipman, J. Ostell, B. A. Rapp, and D. L. Wheeler. 2000. GenBank. Nucleic Acids Res. 28:15-18. [DOI] [PMC free article] [PubMed] [Google Scholar]
- 5.Cottrell, M. T., and D. L. Kirchman. 2000. Community composition of marine bacterioplankton determined by 16S rRNA gene clone libraries and fluorescence in situ hybridization. Appl. Environ. Microbiol. 66:5116-5122. [DOI] [PMC free article] [PubMed] [Google Scholar]
- 6.Devereux, R., S.-H. He, C. L. Doyle, S. Orkland, D. A. Stahl, J. LeGall, and W. B. Whitman. 1990. Diversity and origin of Desulfovibrio species: phylogenetic definition of a family. J. Bacteriol. 172:3609-3619. [DOI] [PMC free article] [PubMed] [Google Scholar]
- 7.Dobson, S. J., T. A. McMeekin, and P. D. Franzmann. 1993. Phylogenetic relationships between some members of the genera Deleya, Halomonas, and Halovibrio. Int. J. Syst. Bacteriol. 43:665-673. [DOI] [PubMed] [Google Scholar]
- 8.Ducklow, H. 2000. Bacterial production and biomass in the oceans, p. 85-120. In D. L. Kirchman (ed.), Microbial ecology of the oceans. Wiley, New York, N.Y.
- 9.Fenchel, T. 1993. There are more small than large species? Oikos 68:375-378. [Google Scholar]
- 10.Field, K. G., D. Gordon, T. Wright, M. S. Rappé, E. Urbach, K. Vergin, and S. J. Giovannoni. 1997. Diversity depth-specific distribution of SAR11 cluster rRNA genes from marine planktonic bacteria. Appl. Environ. Microbiol. 63:63-70. [DOI] [PMC free article] [PubMed] [Google Scholar]
- 11.Finlay, B. J., G. F. Esteban, and T. Fenchel. 1998. Protozoan diversity: converging estimates of the global number of free-living ciliate species. Protist 149:29-37. [DOI] [PubMed] [Google Scholar]
- 12.Fuhrman, J. 1992. Bacterioplankton roles in cycling of organic matter: the microbial food web, p. 361-383. In P. G. Falkowski and A. D. Woodhead (ed.), Primary productivity biogeochemical cycles in the sea. Plenum Press, New York, N.Y.
- 13.García-Martinez, J., and F. Rodríguez-Valera. 2000. Microdiversity of uncultured marine procaryotes: the SAR11 cluster and the marine archaea of group I. Mol. Ecol. 9:935-948. [DOI] [PubMed] [Google Scholar]
- 14.Giovannoni, S., and M. Rappé. 2000. Evolution, diversity and molecular ecology of marine prokaryotes, p. 47-84. In D. L. Kirchman (ed.), Microbial ecology of the oceans. Wiley-Liss, New York, N.Y.
- 15.Giovannoni, S. J., T. B. Britschgi, L. M. Craig, and K. G. Field. 1990. Genetic diversity in Sargasso Sea bacterioplankton. Nature 345:60-63. [DOI] [PubMed] [Google Scholar]
- 16.Hagström, Å., J. Pinhassi, and U. L. Zweifel. 2000. Biogeographical diversity among marine bacterioplankton. Aquat. Microb. Ecol. 21:231-244. [Google Scholar]
- 17.Madigan, M. T., J. M. Martinko, and J. Parker. 2000. Biology of microorganisms, 9th ed. Prentice Hall International Editions, Englewood Cliffs, N.J.
- 18.May, R. H. 1988. How many species are there on Earth? Science 241:1441-1449. [DOI] [PubMed] [Google Scholar]
- 19.Moeseneder, M. M., J. M. Arriete, G. Muyzer, C. Winter, and G. J. Herndl. 1999. Optimization of terminal-restriction fragment length polymorphism analysis for complex marine bacterioplankton communities and comparison with denaturing gradient gel electrophoresis. Appl. Environ. Microbiol. 65:3518-3525. [DOI] [PMC free article] [PubMed] [Google Scholar]
- 20.Mullins, T. D., T. B. Britschgi, R. L. Krest, and S. J. Giovannoni. 1995. Genetic comparisons reveal the same unknown bacterial lineages in Atlantic Pacific bacterioplankton communities. Limnol. Oceanogr. 40:148-158. [Google Scholar]
- 21.Nübel, U., B. Engelen, A. Felske, J. Snaidr, A. Wieshuber, R. I. Amann, W. Ludwig, and H. Backhaus. 1996. Sequence heterogeneities of genes encoding 16S rRNAs in Paenibacillus polymyxa detected by temperature gradient gel electrophoresis. J. Bacteriol. 178:5636-5643. [DOI] [PMC free article] [PubMed] [Google Scholar]
- 22.Seguritan, V., and F. Rohwer. 2001. FastGroup: a program to dereplicate libraries of 16S rDNA sequences. BMC Bioinformatics 2:9.. [DOI] [PMC free article] [PubMed] [Google Scholar]
- 23.Stackebrandt, E., and B. M. Göbel. 1994. Taxonomic note: a place for DNA-DNA reassociation and t65 rRNA sequence analysis in the present species definition in bacteriology. Int. J. Syst. Bacteriol. 44:846-849. [Google Scholar]
- 24.Thingstad, T. F., and R. Lignell. 1997. Theoretical models for the control of bacterial growth rate, abundance, diversity and carbon demand. Aquat. Microb. Ecol. 13:19-27. [Google Scholar]
- 25.Van de Peer, Y., S. Chapelle, and R. De Watcher. 1996. A quantitative map of nucleotide substitution rates in bacterial rRNA. Nucleic Acids Res. 24:3381-3391. [DOI] [PMC free article] [PubMed] [Google Scholar]
- 26.von Wintzingerode, F., U. B. Göbel, and E. Stackebrandt. 1997. Determination of microbial diversity in environmental samples: pitfalls of PCR-based rRNA analysis. FEMS Microbiol. Rev. 21:213-229. [DOI] [PubMed] [Google Scholar]
- 27.Ward, D. M., R. Weller, and M. M. Bateson. 1990. 16S rRNA sequences reveal numerous uncultured microorganisms in a natural community. Nature 345:63-65. [DOI] [PubMed] [Google Scholar]
- 28.Wayne, L. G., D. J. Brenner, R. R. Colwell, P. A. D. Grimont, O. Kandler, M. I. Krichevsky, L. H. Moore, W. E. C. Moore, R. G. E. Murray, E. Stackebrandt, M. P. Starr, and H. G. Trüper. 1987. Report of the Ad Hoc Committee on Reconciliation of Approaches to Bacterial Systematics. Int. J. Syst. Bacteriol. 37:463-464. [Google Scholar]
- 29.Wiik, R., E. Stackebrandt, O. Valle, F. L. Daae, O. M. Rödseth, and K. Andersen. 1995. Classification of fish-pathogenic vibrios based on comparative 16S rRNA analysis. Int. J. Syst. Bacteriol. 45:421-428. [DOI] [PubMed] [Google Scholar]
- 30.Yap, W. H., Z. Zhang, and Y. Wang. 1999. Distinct types of rRNA operons exist in the genome of the actinomycete Thermomonospora chromogena and evidence for horizontal transfer of entire rRNA operon. J. Bacteriol. 181:5201-5209. [DOI] [PMC free article] [PubMed] [Google Scholar]


