

Abstract
Gene targeting was used to characterize the physiological role of growth factor receptor-bound (Grb)14, an adapter-type signalling protein that associates with the insulin receptor (IR). Adult male Grb14−/− mice displayed improved glucose tolerance, lower circulating insulin levels, and increased incorporation of glucose into glycogen in the liver and skeletal muscle. In ex vivo studies, insulin-induced 2-deoxyglucose uptake was enhanced in soleus muscle, but not in epididymal adipose tissue. These metabolic effects correlated with tissue-specific alterations in insulin signalling. In the liver, despite lower IR autophosphorylation, enhanced insulin-induced tyrosine phosphorylation of insulin receptor substrate (IRS)-1 and activation of protein kinase B (PKB) was observed. In skeletal muscle, IR tyrosine phosphorylation was normal, but signalling via IRS-1 and PKB was increased. Finally, no effect of Grb14 ablation was observed on insulin signalling in white adipose tissue. These findings demonstrate that Grb14 functions in vivo as a tissue-specific modulator of insulin action, most likely via repression of IR-mediated IRS-1 tyrosine phosphorylation, and highlight this protein as a potential target for therapeutic intervention.
Keywords: Grb7 family, insulin receptor, metabolism, PKB, signal transduction
Introduction
Insulin, secreted by the β cells of the pancreatic islets of Langerhans in response to increases in blood glucose levels, mediates its cellular responses in target tissues (liver, muscle and adipose) by binding to the insulin receptor (IR), a member of the receptor tyrosine kinase superfamily (Saltiel and Kahn, 2001). Responses to IR activation include an increase in glucose uptake in adipose and muscle, together with increased glycogen synthesis and decreased gluconeogenesis in the liver. Critical targets for tyrosine phosphorylation by the IR are members of the docking protein class of signal transducing proteins, which once tyrosine phosphorylated recruit specific src homology (SH)2 domain-containing enzymes and adapters. IR targets include Shc, which binds growth factor receptor-bound (Grb)2 and activates the Ras/MAP kinase pathway, and insulin receptor substrates (IRS)-1-4, which recruit Grb2, Nck, Shp-2 and the p85 subunit of phosphatidylinositol (PI)3-kinase (Saltiel and Kahn, 2001).
The activation of PI3-kinase in response to IRS binding plays a pivotal role in mediating metabolic responses to insulin, including increased glucose uptake due to translocation of GLUT4 transporters to the plasma membrane and increased glycogen synthesis. Two key effectors of PI3-kinase implicated in the regulation of GLUT4 trafficking are protein kinase B (PKB) and the atypical PKC isoform PKCζ (Bryant et al, 2002). PKB also contributes to the regulation of glycogen synthesis through phosphorylation and inhibition of glycogen synthase kinase-3 (Saltiel and Kahn, 2001). More recently, a PI3-kinase-independent pathway for insulin regulation of GLUT4 translocation has been identified, involving regulation of the low-molecular-weight G protein TC10 by a c-Cbl/Cbl-associated protein (CAP) complex (Saltiel and Kahn, 2001).
Grb14 is a multidomain protein consisting of an N-terminal region harbouring a conserved proline-rich motif, a central region containing a pleckstrin homology (PH) domain and a C-terminal SH2 domain. It belongs to a family of related proteins, the Grb7 family, which also contains Grb7 and Grb10 (Han et al, 2001). More recently, a novel receptor-interacting domain was identified in these proteins, the Between PH and SH2 (BPS) domain (He et al, 1998; Kasus-Jacobi et al, 1998). This region is sufficient to mediate binding to the activated IR, and both Grb10 and Grb14 exhibit ligand-dependent association with this receptor in vivo (Han et al, 2001). Overexpression of Grb10 or Grb14 in CHO-IR cells inhibits insulin-induced tyrosine phosphorylation of IRS-1, Shc and Dok (Liu and Roth, 1995; Kasus-Jacobi et al, 1998; Hemming et al, 2001), and reduces insulin-stimulated mitogenesis and glycogen synthesis (Kasus-Jacobi et al, 1998). This repression is thought to be mediated via BPS-IR binding, since addition of recombinant fusion proteins containing the Grb10 or Grb14 BPS domains to in vitro kinase assays reduces the activity of the IR towards exogenous substrates, with the Grb14 BPS functioning as an uncompetitive inhibitor (Stein et al, 2001; Bereziat et al, 2002). The repressor role of the BPS region is further supported by the inhibition of insulin-induced Xenopus oocyte maturation observed upon microinjection of Grb14 or its BPS domain alone (Cariou et al, 2002). Recently, loss of Grb10 function in the mouse was shown to result in overgrowth of the embryo and placenta, although the underlying alterations in cellular signalling remain to be defined (Charalambous et al, 2003).
To address the physiological role of Grb14, we have generated mice in which expression of this protein is ablated via gene targeting. These mice exhibit improved glucose homeostasis and enhanced insulin signalling in the liver and muscle, identifying Grb14 as a tissue-specific regulator of IR signal transmission in vivo.
Results
Disruption of the murine Grb14 gene by homologous recombination
The targeting strategy abolished the production of Grb14 and replaced it with a β-galactosidase/green fluorescent protein (βGal/GFP) fusion. The 5′ arm spanned 8 kb down to the ATG initiation codon, and the 3′ arm 2 kb, starting within the second coding exon. Figure 1A illustrates the targeting strategy. The 3′ screening strategy depended upon the introduction of an additional EcoRV site, so that the 6 kb EcoRV band detected upon Southerns of wild-type genomic DNA was replaced by a 3 kb band upon homologous recombination. Figures 1B and C show correct targeting of the Grb14 locus in the genetically manipulated animals, as determined by Southern blotting and polymerase chain reaction (PCR), respectively. Correct integration of the 5′ end of the targeting vector was confirmed based on the introduction of an additional BamHI site upon homologous recombination (data not shown).
Figure 1.

Gene targeting of the Grb14 locus. (A) Maps of the Grb14 genomic locus (top), targeting vector (middle) and targeted locus after homologous recombination (bottom). Grb14 exons are indicated by black boxes. B, BamHI; E, EcoRV; K, KpnI; S, Stu I. Arrowheads indicate the location and direction of PCR primers used in genotyping. (B) Southern blot analysis of genomic DNA isolated from wild-type, Grb14−/− and Grb14+/− mice, digested with EcoRV, using the probe indicated in Figure 1A. (C) PCR genotyping of DNA distinguishing wild-type, Grb14−/− and Grb14+/− mice. (D) Northern blot analysis of tissues from Grb14+/+ and Grb14−/− mice utilizing 32P-labelled mouse Grb14 cDNA as a probe. Small int., small intestine; WAT, white adipose tissue. (E) Western blot analysis of Grb14 protein expression in different tissues. SM, skeletal muscle.
In order to confirm that we had abolished expression of Grb14 encoding mRNA transcripts, Northern blots were performed using full-length mouse Grb14 cDNA as a probe. In wild-type animals, expression of Grb14 mRNA was high in the heart, moderate in the liver, white adipose tissue and lung, and low in the kidney, testis, skeletal muscle and brain. However, Grb14 mRNA transcripts could not be detected in Grb14−/− animals (Figure 1D and data not shown). Consistent with the mRNA expression profile, Western blot analysis of tissue lysates derived from wild-type animals revealed high expression of Grb14 in the liver and heart, moderate levels in white adipose tissue and low expression in skeletal muscle, while Grb14 protein could not be detected in Grb14−/− animals (Figure 1E and data not shown). The expression of βGal/GFP from the Grb14 gene locus was confirmed by anti-βGal staining of E10.5 mouse embryos, which revealed strong staining in the heart of Grb14−/−, but not Grb14+/+, embryos (data not shown).
Phenotypic characterization of Grb14−/− mice
Following crosses between mice heterozygous for the Grb14 gene knockout, wild-type, Grb14+/− and Grb14−/− mice were born at normal Mendelian ratio (58:100:51), indicating that loss of the Grb14 gene is not essential for embryonic development. Mating of Grb14−/− animals demonstrated that there was no obvious effect of Grb14 ablation on fertility. The tissues used for Northern analysis (Figure 1), together with ovary, were also subjected to routine histological examination. This did not reveal any obvious differences between wild-type and knockout adult animals.
The weight of animals of both homozygotic genotypes was measured weekly. These data revealed a small but significant reduction in body weight for both male and female Grb14−/− animals. From weaning to 16 weeks of age, female Grb14−/− animals weighed approximately 5% less than wild-type controls. Male knockouts were weighed from weaning to 28 weeks of age, and a 5–10% reduction in body weight was detected. These differences were not due to a proportional decrease in weight of all organs and tissues. For example, at 28 weeks of age, male Grb14−/− animals exhibited a significant weight reduction in the liver (16%, P<0.001) and spleen (29%, P<0.01), an increase in the heart (18%, P<0.05) and no significant change in the kidney or white adipose tissue. No difference in daily food intake was detected between the two genotypes.
Grb14−/− mice exhibit improved insulin regulation of glucose homeostasis
As it has been proposed that Grb14 plays a role in negatively modulating the insulin signalling pathway, the glucose tolerance of age- and weight-matched wild-type and Grb14-deficient mice was assessed. At 8–9 weeks of age, there was no significant difference in the glucose tolerance of male or female animals, although there was an indication of better glucose tolerance in male knockout mice (data not shown). At 16 weeks of age, there was significantly better glucose tolerance in male Grb14−/− mice (Figure 2A), indicating an increased ability of these mice to clear a glucose load compared to wild-type mice. Similar results were obtained for multiple batches of male Grb14−/− animals between 16 and 24 weeks of age. However, there was no significant difference in the glucose tolerance of female Grb14−/− and wild-type mice at these ages (data not shown). The reason for the difference between the male and female Grb14−/− mice is not clear, although it may reflect differences in body composition between males and females, or hormonal effects, as oestrogen regulates Grb14 expression (R Kairouz and RJ Daly, unpublished data). Owing to the lack of an obvious phenotype in Grb14−/− females, subsequent investigations were limited to a comparison of male wild-type and Grb14−/− mice.
Figure 2.
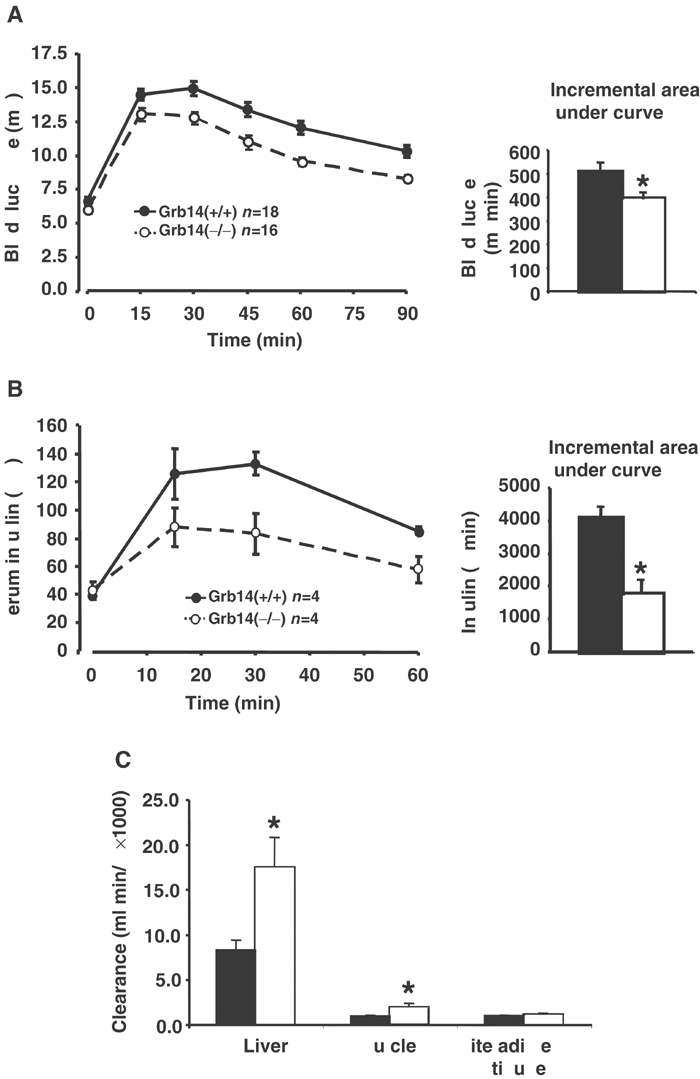
Glucose tolerance in wild-type and Grb14−/− mice. (A) Intraperitoneal glucose tolerance tests in male mice. The histogram represents the incremental area under the glucose curve. (B) Serum insulin levels during a glucose tolerance test in male mice. The histogram represents the incremental area under the insulin curve. (C) Clearance of U-14C glucose into glycogen in muscle and liver and into lipid in white adipose tissue. For (A–C) black shading: wild-type animals; white: Grb14−/− animals. *P<0.05, indicating a significant difference between genotypes. Results for (A–C) were obtained using male mice at 16–24 weeks of age.
To investigate the mechanism for the increased ability of Grb14−/− animals to clear glucose, the circulating insulin concentration in wild-type and Grb14-deficient mice during a glucose tolerance test was measured. Figure 2B shows that the circulating level of insulin was significantly lower in response to the same glucose load in Grb14−/− mice compared to wild-type mice, demonstrating that the improved tolerance was not due to increased insulin release in response to the glucose challenge, and indicating that insulin action is enhanced in Grb14-deficient animals. To determine the role of particular insulin target tissues in the improved whole-body glucose tolerance, we performed a glucose tolerance test where the glucose load was labelled with a tracer amount of U-14C-glucose and examined the incorporation of labelled glucose into glycogen (liver and muscle) and lipids (white adipose tissue). There was a significant increase in the amount of labelled glucose incorporated into glycogen in both liver and muscle of the gene knockout mice, which is consistent with an improved insulin action in these tissues. However, there was no difference in the amount of labelled glucose incorporated into lipid in white adipose tissue (Figure 2C). Increased glucose incorporation into tissue glycogen in association with lower insulin levels during the glucose tolerance test strongly suggests that the signalling pathways involved in the insulin regulation of glycogen deposition in the liver and muscle are enhanced in Grb14−/− mice, while the results from white adipose tissue indicate that the effects of Grb14 ablation may be tissue specific.
In order to investigate whether the male Grb14−/− animals were more sensitive to insulin with regard to whole-body glucose clearance, intraperitoneal insulin tolerance tests were performed in mice at 16–18 weeks of age. At a dose of 1 U/kg, there was no significant difference in the ability of insulin to lower blood glucose in Grb14-deficient and wild-type mice (data not shown). However, at a lower dose of insulin (0.5 U/kg), a clear difference in the cumulative decrease in glucose between Grb14-deficient and wild-type mice was observed (Figure 3A). Also, fasting plasma insulin levels in male Grb14−/− mice were significantly lower at 28–30 and 54–56 weeks of age compared with wild-type animals (Figure 3B), providing another indication of increased whole-body insulin sensitivity in Grb14-deficient male mice.
Figure 3.

Measures of insulin action in wild-type and Grb14−/− mice. (A) Intraperitoneal insulin tolerance tests on male mice at 18–20 weeks of age. The histogram represents the cumulative decrease in blood glucose from basal levels after the injection of insulin (0.5 U/kg). (B) Fasting serum insulin levels in male wild-type and Grb14-deficient mice. For (A) and (B) black shading: wild-type animals; white: Grb14−/− animals. *P<0.05, indicating a significant difference between genotypes.
Grb14-deficient skeletal muscle exhibits enhanced insulin-induced glucose uptake
Skeletal muscle is the major tissue that contributes to insulin-stimulated glucose uptake after a glucose load (DeFronzo et al, 1981). Therefore, to further explore the mechanism underlying increased insulin sensitivity in Grb14-deficient animals, we measured glucose uptake in isolated soleus muscle from wild-type and Grb14−/− mice. At the physiologically relevant, submaximal, concentration of 1.8 nM (300 μU/ml), there was a 1.7-fold greater uptake of 2-deoxyglucose (2-DG) in isolated soleus from Grb14−/− mice compared with wild-type mice (P=0.001), but at maximal insulin concentrations this difference was not evident (Figure 4A). Interestingly, fat explants from wild-type and Grb14-deficient mice exhibited no difference in 2-DG uptake across a range of insulin concentrations (Figure 4B and data not shown). These observations (in combination with the data on glucose disposal in vivo, Figure 2C) indicate that Grb14 ablation differentially affects particular insulin target tissues.
Figure 4.

Insulin regulation of glucose uptake in tissues isolated from wild-type and Grb14-deficient mice. (A) 2DG uptake in isolated soleus muscle. (B) 2DG uptake in epididymal adipose tissue explants. White: wild-type or Grb14−/− animals in the basal state. Shaded bars represent the effect of insulin stimulation. **P<0.01, indicating a significant difference between insulin-stimulated Grb14−/− soleus muscle and wild-type muscle. Results were obtained using male mice at 19–22 weeks of age.
Grb14 ablation reduces IR tyrosine phosphorylation in the liver
In order to investigate IR signalling in insulin target tissues, tissue extracts were prepared from control or insulin-stimulated Grb14+/+ or Grb14−/− mice. Western blot analysis revealed that expression of the IR was not altered in the liver, skeletal muscle or white adipose tissue of the mutant mice (Figures 5A, B and data not shown). To determine whether removal of Grb14 altered tyrosine phosphorylation of the IR, the receptor was immunoprecipitated and then Western blotted with an anti-phosphotyrosine antibody. Insulin-stimulated IR autophosphorylation was significantly reduced in the liver of Grb14−/− animals (Figure 5C, P=0.03), but not in skeletal muscle (Figure 5D) or white adipose tissue (data not shown).
Figure 5.
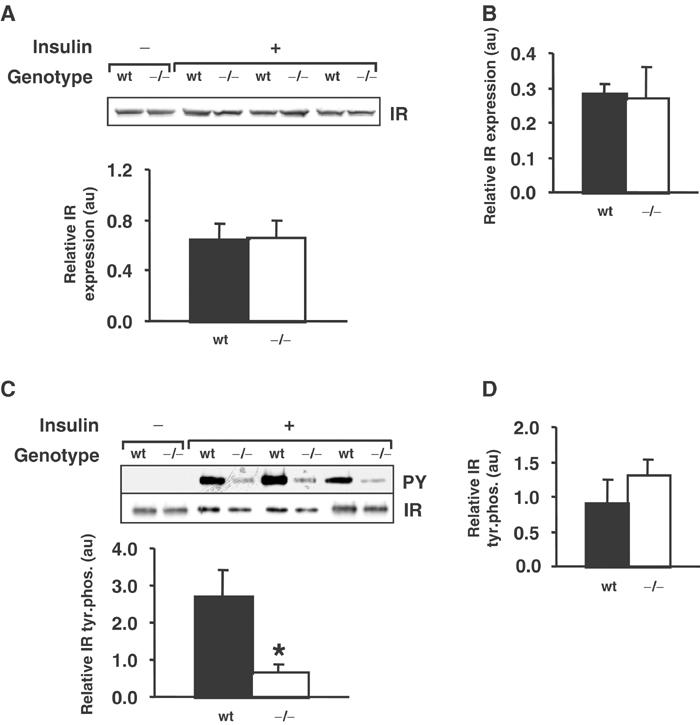
IR expression and tyrosine phosphorylation in liver and skeletal muscle from wild-type and Grb14−/− mice. (A) IR expression in liver, as determined by Western blot analysis of tissue from control (−) or insulin-stimulated (+) animals. The histogram shows IR levels derived from densitometric analysis of the blots for insulin-stimulated animals (au, arbitrary units). (B) IR expression in skeletal muscle. The histogram was derived as for liver. (C) Tyrosine phosphorylation of the IR in liver. Receptor immunoprecipitates were Western blotted for phosphotyrosine (upper panel, PY) and IR (lower panel). The histogram shows IR tyrosine phosphorylation for insulin-stimulated animals, normalized for IR levels. *P<0.05, indicating a significant difference between genotypes. (D) Tyrosine phosphorylation of the IR in skeletal muscle. The histogram was derived as for liver. Results were obtained using male mice at 16–23 weeks of age.
In order to investigate the mechanism underlying the reduced IR tyrosine phosphorylation in liver, primary hepatocyte cultures were established from the mice, as these were more amenable to experimental manipulation. Receptor phosphorylation was determined by Western blotting using a phosphospecific antibody directed against the autophosphorylated IR, but comparable results were obtained when IR immunoprecipitates were analysed using an anti-phosphotyrosine antibody, and immunodepletion experiments confirmed that the receptor detected by the phosphospecific antibody was the IR, not the closely related IGF-1R. First, we investigated the kinetics of insulin-induced IR tyrosine phosphorylation. Immunoblotting of cell lysates revealed that receptor tyrosine phosphorylation was increased approximately 10-fold in both wild-type and Grb14−/− cells following 30 s of insulin treatment. However, unlike the wild-type cells, receptor phosphorylation in the Grb14−/− cells did not continue to increase further with time, resulting in an approximately three-fold difference between the two cell types at 2 and 5 min (Figure 6A). Consequently, the isolated hepatocytes reproduced the decreased insulin-induced IR tyrosine phosphorylation observed in the liver in vivo (Figure 5), and provided a useful model system to investigate the underlying mechanism.
Figure 6.

Role of PTP activity in regulating IR tyrosine phosphorylation. (A) Primary hepatocytes from wild-type or Grb14−/− mice (approximately 20 weeks of age) were stimulated with insulin for 0–300 s, as indicated. IR tyrosine phosphorylation was determined by Western blotting cell lysates with a phosphospecific antibody (pIR, upper panel) and an IR-specific antibody (lower panel). The histogram shows IR tyrosine phosphorylation normalized for IR levels. Values represent the mean of duplicate experiments. (B) Hepatocytes were pretreated with pervanadate and stimulated with insulin for 5 min as indicated. IR tyrosine phosphorylation was determined by Western blotting (upper and lower panels). The histogram shows IR tyrosine phosphorylation for insulin-stimulated cells, normalized for IR levels. Values represent the mean of triplicate experiments. **P<0.01, indicating a significant difference between genotypes. NS: not significant. (C) Expression of PTP1b in liver and skeletal muscle (SM) from wild-type or Grb14−/− mice (19–23 weeks of age). Tissue lysates were subjected to Western blot analysis. Shading of the histogram is as for Figure 6A.
Estimation of surface IR by biotin labelling did not reveal a significant difference between wild-type and Grb14−/− hepatocytes (data not shown). Also, pretreatment of the cells with H7, a broad-spectrum serine/threonine kinase inhibitor, did not increase IR tyrosine phosphorylation in Grb14-deficient cells (data not shown), although recovery of IR tyrosine phosphorylation in insulin-resistant cells following treatment with this compound has been described (Li et al, 2002). Since it was recently demonstrated that Grb14 protects the IR from protein tyrosine phosphatase (PTP)1b (Bereziat et al, 2002), Grb14 ablation may lead to enhanced sensitivity of the IR to PTPs. To test this hypothesis, we pretreated hepatocytes with a concentration of the PTP inhibitor pervanadate sufficient to inhibit PTP activity towards the IR, while maintaining ligand dependence of IR tyrosine phosphorylation. This increased insulin-induced IR tyrosine phosphorylation in both wild-type and Grb14−/− cells, and importantly, normalized receptor phosphorylation between cells of these two genotypes (Figure 6B), indicating that the reduced IR tyrosine phosphorylation in Grb14−/− hepatocytes is due to PTP-mediated dephosphorylation.
To investigate the tissue specificity of this effect, we examined the expression levels of PTP1b, which regulates IR tyrosine phosphorylation in the liver and skeletal muscle, but not white adipose tissue, in vivo (Elchebly et al, 1999). Expression of this enzyme was similar in wild-type and Grb14−/− liver (Figure 6C), indicating that the enhanced IR dephosphorylation in the latter is not due to an increase in PTP1b levels. Interestingly, PTP1b levels in liver tissue from the gene knockout mice were approximately seven-fold higher than those in skeletal muscle (Figure 6C). Following correction for the specific activity of the enzyme, which was slightly higher in Grb14-deficient muscle versus liver (data not shown), the total PTP1b activity in Grb14-deficient liver was approximately four-fold higher. Consequently, a plausible explanation is that in the absence of Grb14, PTP1b has enhanced access to the tyrosine-phosphorylated IR, and that this effect is greater in liver versus muscle due to the higher PTP1b activity present.
Grb14 represses signalling through the IRS-1/PKB pathway in the liver and muscle
Tyrosine phosphorylation of IRS-1 and the subsequent activation of PI3-kinase and its downstream effector PKB represent critical events in insulin-induced metabolic signalling. To investigate this pathway, we first Western blotted liver extracts with a phosphospecific antibody against IRS-1 tyrosine 612, which once phosphorylated, binds the p85 subunit of PI3-kinase. Although total IRS-1 levels were similar, a significant increase in insulin-stimulated IRS-1 tyrosine phosphorylation at this site was observed in Grb14-deficient animals compared to wild-type controls (Figure 7A, P=0.02). Consistent with this observation, coimmunoprecipitation of p85 with IRS-1 was significantly enhanced in gene knockout animals (Figure 7B, P=0.01), although p85 levels were similar between mice of the two genotypes. A marked enhancement of insulin-induced IRS-1 tyrosine phosphorylation was also observed in the skeletal muscle of Grb14−/− mice (Figure 7C, P=0.02), whereas in white adipose tissue it was unaltered (data not shown). Finally, although the total PKB levels remained unchanged, PKB activation, as determined by serine 473 phosphorylation, was significantly increased in the liver and skeletal muscle of Grb14-deficient animals (Figures 8A and B, P=0.05 and 0.01, respectively). In contrast, PKB activation was similar in white adipose tissue from gene knockout and wild-type mice (Figure 8C). This selective enhancement of signalling via IRS-1/PKB in the liver and skeletal muscle, but not in white adipose tissue, is consistent with the tissue-specific metabolic effects observed (Figures 2C, 4).
Figure 7.

Insulin-induced signalling via IRS-1 in liver and skeletal muscle. (A) IRS-1 tyrosine phosphorylation in liver. Tissue lysates were Western blotted for tyrosine-phosphorylated IRS-1 using a phosphospecific antibody (pY612, upper panel) and for total IRS-1 (lower panel). The histogram shows normalized IRS-1 tyrosine phosphorylation for insulin-stimulated animals. (B) Association of IRS-1 with the p85 subunit of PI3-kinase in liver. IRS-1 immunoprecipitates were Western blotted for p85 (upper panel) and IRS-1 (lower panel). Tissue lysate was also Western blotted to determine p85 expression. The histogram shows the amount of p85 present in immunoprecipitates from insulin-stimulated animals, normalized for the amount of IRS-1 present. (C) IRS-1 tyrosine phosphorylation in skeletal muscle. The histogram was derived as for liver. *P<0.05, indicating a significant difference between genotypes. Results for (A–C) were obtained using male mice at 16–23 weeks of age.
Figure 8.

Insulin-induced activation of PKB in different tissues. (A) PKB activation in liver. Tissue lysates were Western blotted for serine 473-phosphorylated PKB (upper panel) and total PKB (lower panel). The histogram shows normalized active PKB for insulin-stimulated animals. (B, C) PKB activation in skeletal muscle and white adipose tissue, respectively. The histograms were derived as for liver. For (A) and (B), *P<0.05, indicating a significant difference between genotypes. Results for (A–C) were obtained using male mice at 16–23 weeks of age.
Discussion
Although Grb14 exhibits ligand-inducible association with the IR in vivo, the physiological role of this protein has remained unclear. Therefore, we have used gene targeting in mice to define the role of Grb14 in the context of the whole organism. Significantly, loss of Grb14 in mice results in improved whole-body glucose tolerance despite less insulin release, correlating with enhanced insulin action in the liver and skeletal muscle. This identifies Grb14 as a tissue-specific modulator of insulin signalling.
Analysis of IR signalling in the major insulin-responsive tissues of liver and skeletal muscle revealed that both IRS-1/PI3-kinase signalling and PKB activation were enhanced in Grb14-deficient animals (Figures 7 and 8). Since Grb14 is a direct target of the IR (Kasus-Jacobi et al, 1998), but IR tyrosine phosphorylation was not increased upon Grb14 ablation, these findings are consistent with a model in which BPS domain-mediated receptor recruitment of Grb14 inhibits receptor catalytic activity towards IRS-1 and other specific substrates (Bereziat et al, 2002). The similar total protein levels for the IR and IRS-1 in wild-type and Grb14-deficient cells also indicate that Grb14 does not normally target either protein for degradation. This is in contrast to the SOCS-1 and SOCS-3 SH2 domain containing adaptors, which bind IRS-1 and IRS-2 and link them to the elongin BC ubiquitin ligase, resulting in their ubiquitylation and proteasomal degradation (Rui et al, 2002).
Signalling via IRS-1 and PI3-kinase to the downstream effector PKB plays a major role in mediating the metabolic effects of insulin, including stimulation of glucose transport and glycogen synthesis (Saltiel and Kahn, 2001; Bryant et al, 2002). Consistent with this, isolated soleus muscle from Grb14-deficient mice exhibited increased insulin-stimulated glucose uptake (Figure 4), and there was enhanced incorporation of glucose into skeletal muscle glycogen in Grb14−/− animals in vivo (Figure 2). Intriguingly, the effect on glucose transport was only observed at a submaximal dose of insulin, which is in line with the observation that the maximal insulin response for glucose transport occurs when only 30% of PKB is activated (Guilherme and Czech, 1998). Thus, increased PKB activation in Grb14−/− mice could conceivably cause a leftward shift in the insulin dose response curve for glucose transport without altering the maximal response. Since skeletal muscle is the major site for insulin-stimulated glucose uptake after a glucose load (DeFronzo et al, 1981), the enhancement of insulin-induced metabolic signalling in this tissue is likely to make a significant contribution to the improved glucose tolerance observed in Grb14−/− animals. However, since enhanced insulin-induced signalling and glucose incorporation into glycogen was also observed in the liver of Grb14-deficient animals, this tissue may also contribute to the improved glucose homeostasis. In support of this, a failure to suppress hepatic glucose production results in severe glucose intolerance in liver-specific IR knockout mice (Michael et al, 2000).
Despite the fact that Grb14 is widely expressed, we observed several tissue-specific effects in the Grb14−/− mice. First, there were small, but significant, alterations in the weights of specific organs and tissues. As there is no obvious link between these effects and IR signalling, they may reflect, directly or indirectly, an involvement of Grb14 in signalling downstream of receptor tyrosine kinases other than the IR, for example FGFR1 (Reilly et al, 2000). Notably, the mice do not exhibit the embryonic overgrowth phenotype of Grb10-deficient mice (Charalambous et al, 2003), highlighting a major difference in the physiological role of these two Grb7 family members. Also of interest is that the Grb14-deficient animals do not exhibit the decrease in white adipose tissue observed in male PTP1b−/− mice (Klaman et al, 2000), which may reflect the additional roles for PTP1b in regulating leptin signalling or fat metabolism in adipocytes (Asante-Appiah and Kennedy, 2003).
Second, there was a marked reduction in insulin-stimulated IR tyrosine phosphorylation in the liver, but not in skeletal muscle or white adipose tissue, of Grb14-deficient mice. Since this effect was reversed in primary hepatocytes by pretreatment with pervanadate (Figure 6B), this strongly implicates PTP-mediated dephosphorylation as the underlying mechanism. PTP1b is a strong candidate, since this enzyme regulates liver IR tyrosine phosphorylation in vivo (Elchebly et al, 1999), and Bereziat et al (2002) reported that Grb14 overexpression reduces association of the IR and PTP1b in vivo and that addition of recombinant Grb14 reduces dephosphorylation of the IR by this enzyme in vitro. The kinetics of IR tyrosine phosphorylation in wild-type and Grb14−/− hepatocytes, where an effect of PTP activity was first observed following 30 s of insulin stimulation (Figure 6A), is also consistent with a role for this enzyme. Dephosphorylation of the IR by PTP1b is thought to occur following receptor internalization into endosomes, which occurs 30 s to 1 min following insulin treatment (Burgess et al, 1992; Asante-Appiah and Kennedy, 2003). The high expression of PTP1b in the liver compared with skeletal muscle (Figure 6C), and the absence of an effect of PTP1b ablation on IR phosphorylation in white adipose tissue (Elchebly et al, 1999), may explain why this effect is specific to liver. However, since PTP1b acts postreceptor internalization, tissue-specific differences in IR trafficking could enhance exposure of the receptor to this enzyme in the liver. Also, since other PTPs also demonstrate activity towards the IR (Asante-Appiah and Kennedy, 2003; Galic et al, 2003), we cannot rule out contributions from other enzymes towards this tissue-specific effect.
Interestingly, despite a decrease in IR tyrosine phosphorylation in the liver, enhanced signalling via IRS-1/PKB was observed (Figures 7 and 8). It is noteworthy that upon overexpression of Grb14 in CHO-IR cells, the converse is observed in that IRS-1 phosphorylation is reduced despite enhanced and more sustained IR tyrosine phosphorylation (Kasus-Jacobi et al, 1998; Bereziat et al, 2002). A likely explanation is that since Grb14 acts as an uncompetitive inhibitor of IR activity, the remaining population of phosphorylated receptors, which is still relatively large given the high expression of the IR in the liver, has a higher catalytic activity towards substrates such as IRS-1. However, it is also possible that the absence of Grb14 reduces the activity of pathways that normally act to attenuate signalling via IRS-1, for example, via tyrosine dephosphorylation or serine/threonine phosphorylation of this docking protein (Saltiel and Kahn, 2001). With regard to the latter possibility, Grb14 binds to the adapter ZIP leading to the formation of a trimeric Grb14/ZIP/PKCζ complex (Cariou et al, 2002), and negative regulation of IRS-1 by PKCζ has been documented (Liu et al, 2001). Feedback regulation of IRS-1 in Grb14−/− cells is currently under investigation.
A further tissue-specific aspect of the Grb14−/− phenotype was the enhanced activation of IRS-1/PKB signalling in liver and skeletal muscle but not in white adipose tissue. This is consistent with the in vivo data on glucose incorporation into glycogen or lipid (Figure 2C) and the ex vivo data on 2-DG uptake (Figure 4), where effects were observed in the liver and/or muscle, but not in white adipose tissue. This is not due to compensation by the related family member Grb10, which also inhibits IR signalling, at least in vitro (Liu and Roth, 1995), or PTP-1b, as the expression levels of both proteins are similar in white adipose tissue from wild-type and Grb14−/− animals (data not shown). Consequently, the absence of an effect in adipose may indicate that other regulatory mechanisms are rate limiting for IR signalling via IRS-1 in this tissue. A difference in the regulation of IR signalling between the liver and muscle on the one hand, and adipose on the other, was also revealed upon analysis of PTP1b-deficient animals, where a role for this enzyme was only detected in the former tissues (Elchebly et al, 1999). Whether these observations relate to the role of the APS/Cbl/CAP pathway (Saltiel and Kahn, 2001) in insulin regulation of glucose transport in adipocytes awaits further investigation.
Characterization of the Grb14−/− metabolic phenotype emphasizes how glucose homeostasis is achieved by balancing the insulin sensitivity of peripheral tissues with an appropriate level of insulin secretion. Thus, insulin levels during glucose tolerance tests were markedly reduced in Grb14-deficient animals, as were fasting insulin levels in ageing mice. However, islets isolated from wild-type and Grb14-deficient animals exhibited no difference in glucose-stimulated insulin secretion. Potentiation of glucose-stimulated insulin secretion by the muscarinic receptor agonist carbachol was also unaffected (data not shown). Therefore, the lower circulating insulin levels after a glucose load were not the result of a reduction in the ability of β-cells to respond to this stimulus. Interestingly, heterozygous knockout mice for a different repressor of insulin-induced metabolic signalling, SHIP-2, display a similar phenotype in terms of glucose-induced insulin secretion in vivo and by isolated islets in vitro (Clement et al, 2001). In the absence of obvious β-cell defects in Grb14−/− and SHIP-2+/− mice, this suggests that islets somehow ‘sense' the insulin responsiveness of other tissues in vivo. This is supported by the restoration of glucose-induced acute insulin release that occurs when β-cell-specific IR gene knockout mice are crossed with the corresponding muscle-specific knockout (Mauvais-Jarvis et al, 2000).
This study substantiates the emerging concept that insulin action in vivo is regulated by the opposing action of positive-acting signal transducers (e.g. IR, IRS-1 and PKB) and negative regulatory factors that target different steps in the signalling cascade (e.g. PTP1b, Grb14 and SHIP2). Perturbation of the expression or activity of either type of protein can enhance or inhibit insulin action, as demonstrated by this and other studies using genetically modified mice (Baudry et al, 2002). Furthermore, enhanced expression of particular negative regulators has been correlated with the development of insulin resistance in animal and human studies. For example, increased expression of PTP1b and SOCS-3 has been reported in obesity-associated insulin-resistant states (Ahmad and Goldstein, 1995; Emanuelli et al, 2001). Consequently, blocking the activity of such negative regulators may ameliorate insulin-resistant states by enhancing signal flux through the IR pathway. This is supported by the enhanced insulin signalling observed in ob/ob mice upon treatment with antisense oligonucleotides designed to inhibit PTP1b expression (Gum et al, 2003). Our definition of the physiological role of Grb14 now highlights this protein and its BPS-domain-mediated interaction with the IR as additional targets for therapies aimed at improving insulin action in vivo.
Materials and methods
Generation of Grb14-deficient mice
A lambda FIX II 129/SvJ mouse genomic library (Stratagene) was screened with a mouse Grb14 cDNA probe (murine EST clone AA221592, Genome Systems). A 10 kb KpnI/BamHI fragment and a 2 kb StuI/BamHI fragment were subcloned into the pBGal GFPpAlox neo targeting vector (a kind gift from D Hilton, WEHI) (Figure 1A). A 1 kb Grb14 probe and a probe specific for the neo gene were used to screen for positively targeted ES cell lines. Two of these clones were injected into C57BL/6 blastocysts and implanted into pseudopregnant females. Highly chimeric males were bred with C57BL/6 females, and offspring that were heterozygous for the Grb14 null allele were used to derive the Grb14(Neo) line. Subsequently, these animals were bred with C57BL/6 transgenic animals containing the Cre-recombinase gene. The progeny of these animals had the neo cassette removed, but carried the CRE recombinase transgene. This transgene was removed by mating heterozygous animals and then pairing the male progeny that did not carry the transgene with C57/BL6 females to create the Grb14 knockout line. The genotype of the mice was determined by Southern blot analysis as described in the Results section (Figure 1B), and by PCR using oligonucleotides X-Z (Figure 1C). Experiments were performed on mice maintained on the hybrid 129/SvJ × C57BL/6 background.
Northern and Southern blots
Total RNA was isolated from frozen tissues by homogenization in TRIzol (Invitrogen) and further purified using Qiagen RNeasy Mini Kit (Qiagen). Blots were hybridized to [32P]dCTP-labelled Grb14 or glyceraldehyde-3-phosphate dehydrogenase cDNA probes. Northern and Southern blotting were performed as described elsewhere (Hui et al, 1998).
Antibodies
The commercial antibodies used were Grb14 (Chemicon International), Grb10, p85 subunit of PI3-kinase and PTP-1b (all Upstate Biotechnology), IRS-1 (Santa Cruz Biotechnology), PKB and phospho-PKB (pS473) (both Cell Signalling Technology), HRP-RC20 and IR β (both Transduction Laboratories), IR Ab-3 (Oncogene Research Products), phospho-IR (pY1162, pY1163) and phospho-IRS-1 (pY612) (both Biosource).
Analysis of IR signalling in mouse tissues
Mice (3–8/phenotype) were fasted overnight and anaesthetized by injection of 30 mg/kg of pentabarbitone. The peritoneal cavity was opened and insulin (1 U/kg) was injected into the hepatic portal vein. After 2 min, the liver, epididymal white adipose tissue and quadriceps muscle were rapidly excised and immediately frozen in liquid nitrogen. Lysates from the liver and white adipose tissue were prepared by homogenizing the tissue in modified RIPA buffer (0.5% deoxycholate, 150 mM NaCl, 1% NP40, 50 mM Tris–Cl pH 8.0, 0.1% SDS, 10% glycerol, 5 mM EDTA, 20 mM NaF) containing 1 mM phenylmethylsulphonyl fluoride, 1 mM sodium orthovanadate, 10 μg/ml aprotinin and 10 μg/ml leupeptin. Debris was removed by centrifugation at 17 500 g for 10 min at 4°C. For muscle lysates, the tissues were treated identically, except that the frozen muscle was pulverized in a micro-dismembrinator and the resulting powder was resuspended in RIPA buffer. Immunoprecipitations and Western blots were performed essentially as previously described (Janes et al, 1994).
PTP1b activity assay
This was performed on immunoprecipitated enzyme using a c-Src-derived phosphopeptide substrate, as previously described (Taghibiglou et al, 2002).
Metabolic assays
Serum glucose concentrations were determined by an enzymic method using glucose oxidase/peroxidase and the dye 4-aminoantipyrine. Serum insulin levels were measured using a commercial radioimmunoassay kit (Linco). For glucose tolerance tests, age- and weight-matched mice were fasted overnight and then injected intraperitoneally with glucose (2 g/kg). Blood samples were obtained from the tail tip at the times indicated. Insulin concentrations during these tests were assayed using an ultrasensitive mouse ELISA (Mercodia AB). The change in blood glucose in response to exogenously administered insulin was used to assess whole-body insulin action. Actrapid insulin (NovoNordisk Pty Ltd) was injected intraperitoneally (0.5 U/kg) into overnight fasted mice and blood samples were collected from the tail for glucose determination.
Assessment of insulin action in vivo
A tracer amount of U-14C-glucose was mixed with 50% glucose in normal saline and injected intraperitoneally into overnight fasted, wild-type and Grb14 gene-deleted mice (2 g/kg body weight, 10 μCi per mouse). During this radiolabelled glucose tolerance test, blood was collected from the tip of the tail at 15, 30, 45, 60 and 90 min. Blood glucose and blood radioactivity were determined at each time point and the area under the curve was calculated for both these parameters. For the determination of incorporation of radiolabelled glucose into glycogen, tissue samples of the liver and muscle (50–100 mg) were digested in 300 μl of 1 M KOH at 70°C for 20 min. After the addition of 75 μl of saturated NaSO4, glycogen was precipitated by the addition of 1.7 ml of 95% ethanol. The pellets were washed with 95% ethanol and re-dissolved in 1 ml of water. The clearance of radioactive glucose into glycogen was assessed by liquid scintillation counting of a sample of the glycogen solution and correction for the area under the curve for radioactive glucose during the glucose tolerance test and for the weight of the tissue sample used. Incorporation of U-14C glucose into lipid in white adipose tissue was determined after homogenizing samples of tissue in 2 ml of chloroform/methanol (2:1) followed by the addition of 1 ml of 0.6% saline to facilitate separation of the organic and aqueous phases. The lower chloroform phase (which contained extractable, neutral lipids) was collected and evaporated to dryness before liquid scintillation counting to determine the amount of 14C glucose incorporated into the lipid fraction. The clearance of radioactive glucose into lipid was calculated by correcting for the area under the curve for radioactive glucose during the glucose tolerance test and for the weight of the tissue sample used.
Analysis of glucose uptake by isolated muscle strips and adipocyte explants
Overnight fasted mice were killed by cervical dislocation and soleus muscles were removed immediately. Muscles were preincubated in the presence or absence of insulin and glucose transport activity was assayed as described previously (Hansen et al, 1995). Epididymal fat pads were removed and cut into 1–2-mm-sized explants. Explants were placed in 12-well plates (10–50 mg per well) in 0.5 ml of Krebs–Ringer buffer (pH 7.4) supplemented with 2% BSA and 2 mM sodium pyruvate. Explants were incubated at 37°C for 30 min to establish basal conditions. Where required, explants were treated with insulin (0.05–100 nM) for 15 min. Glucose uptake was assayed as described previously (Molero et al, 2001).
Isolation and analysis of primary hepatocytes
Mice were anaesthetized by injection of 30 mg/kg of pentabarbitone. The liver was infused via the vena cava with collagenase (Gibco) and then placed in RPMI 1640 medium (Gibco) containing 10% FCS (Trace Biosciences) and 50 μM 2-mercaptoethanol. Following dissociation of hepatocytes into the medium, the cells were collected by centrifugation and washed in PBS. Following purification on a Percoll gradient (Amersham Pharmacia Biotech), the cells were seeded in growth medium at 3 × 10⁵ cells/well of a six-well tissue culture plate (Corning Inc.). Following culture for 16–24 h, the cells were serum-starved for 6 h and then stimulated with insulin (10 μg/ml). Cells were lysed as previously described (Janes et al, 1994). To analyse surface IR in hepatocytes, cell surface proteins were labelled at 4°C with sulpho-NHS-biotin (Pierce) by standard procedures. Cell lysates were then prepared and biotin-labelled proteins were isolated using streptavidin–sepharose beads (Amersham Pharmacia Biotech.). The amount of IR in this fraction was assayed by Western blotting. Pretreatment of cells with pervanadate (1 μM) or the serine/threonine kinase inhibitor H7 (Calbiochem) (2 μM) was performed for 15 and 20 min, respectively, prior to insulin stimulation.
Statistical analysis
All results were analysed by ANOVA with appropriate post hoc tests performed using Statview 4.5 for Macintosh (Abacus Concepts). Results are expressed±standard error, and differences were considered to be statistically significant at P<0.05.
Acknowledgments
This research was supported by the National Health and Medical Research Council of Australia and The Cancer Council New South Wales. We thank Dr Tony Tiganis (Monash University) for helpful discussion.
References
- Ahmad F, Goldstein BJ (1995) Increased abundance of specific skeletal muscle protein-tyrosine phosphatases in a genetic model of insulin-resistant obesity and diabetes mellitus. Metabolism 44: 1175–1184 [DOI] [PubMed] [Google Scholar]
- Asante-Appiah E, Kennedy BP (2003) Protein tyrosine phosphatases: the quest for negative regulators of insulin action. Am J Physiol Endo Metab 284: E663–E670 [DOI] [PubMed] [Google Scholar]
- Baudry A, Leroux L, Jackerott M, Joshi RL (2002) Genetic manipulation of insulin signaling, action and secretion in mice. EMBO Rep 3: 323–328 [DOI] [PMC free article] [PubMed] [Google Scholar]
- Bereziat V, Kasus-Jacobi A, Perdereau D, Cariou B, Girard J, Burnol A-F (2002) Inhibition of insulin receptor catalytic activity by the molecular adapter Grb14. J Biol Chem 277: 4845–4852 [DOI] [PubMed] [Google Scholar]
- Bryant NJ, Govers R, James DE (2002) Regulated transport of the glucose transporter Glut4. Nat Rev Mol Cell Biol 3: 267–277 [DOI] [PubMed] [Google Scholar]
- Burgess JW, Wada I, Ling N, Khan MN, Bergeron JJ, Posner BI (1992) Decrease in beta-subunit phosphotyrosine correlates with internalization and activation of the endosomal insulin receptor kinase. J Biol Chem 267: 10077–10086 [PubMed] [Google Scholar]
- Cariou B, Perdereau D, Cailliau K, Browaeys-Poly E, Bereziat V, Vasseur-Cognet M, Girard J, Burnol A-F (2002) The adapter protein ZIP binds Grb14 and regulates its inhibitory action on insulin signaling by recruiting protein kinase Cζ. Mol Cell Biol 22: 6959–6970 [DOI] [PMC free article] [PubMed] [Google Scholar]
- Charalambous M, Smith FM, Bennett WR, Crew TE, MacKenzie F, Ward A (2003) Disruption of the imprinted Grb10 gene leads to disproportionate overgrowth by an igf2-independent mechanism. Proc Natl Acad Sci USA 100: 8292–8297 [DOI] [PMC free article] [PubMed] [Google Scholar]
- Clement S, Krause U, Desmedt F, Tanti J-F, Behrends J, Pesesse X, Sasaki T, Penninger J, Doherty M, Malaisse W, Dumont JE, Le Marchand-Brustel Y, Erneux C, Hue L, Schurmans S (2001) The lipid phosphatase SHIP2 controls insulin sensitivity. Nature 409: 92–97 [DOI] [PubMed] [Google Scholar]
- DeFronzo RA, Jacot E, Jequier E, Maeder E, Wahren J, Felber JP (1981) The effect of insulin on the disposal of intravenous glucose. Results from indirect calorimetry and hepatic and femoral venous catheterization. Diabetes 30: 1000–1007 [DOI] [PubMed] [Google Scholar]
- Elchebly M, Payetta P, Michaliszyn E, Cromlish W, Collins S, Loy AL, Normandin D, Cheng A, Himms-Hagen J, Chan C-C, Ramachandran C, Gresser MJ, Tremblay ML, Kennedy BP (1999) Increased insulin sensitivity and obesity resistance in mice lacking the protein tyrosine phosphatase-1B gene. Science 283: 1544–1548 [DOI] [PubMed] [Google Scholar]
- Emanuelli B, Peraldi P, Filloux C, Chavey C, Freidinger K, Hilton DJ, Hotamisligil GS, Van Obberghen E (2001) SOCS-3 inhibits insulin signaling and is up-regulated in response to tumor necrosis factor-alpha in the adipose tissue of obese mice. J Biol Chem 276: 47944–47949 [DOI] [PubMed] [Google Scholar]
- Galic S, Klingler-Hoffmann M, Fodero-Tavoletti MT, Puryer MA, Meng T-C, Tonks NK, Tiganis T (2003) Regulation of insulin receptor signaling by the protein tyrosine phosphatase TCPTP. Mol Cell Biol 23: 2096–2108 [DOI] [PMC free article] [PubMed] [Google Scholar]
- Guilherme A, Czech MP (1998) Stimulation of IRS-1-associated phosphatidylinositol 3-kinase and Akt/protein kinase B but not glucose transport by β1-integrin signaling in rat adipocytes. J Biol Chem 273: 33119–33122 [DOI] [PubMed] [Google Scholar]
- Gum RJ, Gaede LL, Koterski SL, Heindel M, Clampit JE, Zinker BA, Trevillyan JM, Ulrich RG, Jirousek MR, Rondinone CM (2003) Reduction of protein tyrosine phosphatase 1B increases insulin-dependent signaling in ob/ob mice. Diabetes 52: 21–28 [DOI] [PubMed] [Google Scholar]
- Han DC, Shen T-L, Guan J-L (2001) The Grb7 family proteins: structure, interactions with other signaling molecules and potential cellular functions. Oncogene 20: 6315–6321 [DOI] [PubMed] [Google Scholar]
- Hansen P, Gulve E, Gao J, Schluter J, Mueckler M, Holloszy JO (1995) Kinetics of 2-deoxyglucose transport in skeletal muscle: effects of insulin and contractions. Am J Physiol 268: C30–C35 [DOI] [PubMed] [Google Scholar]
- He W, Rose DW, Olefsky JM, Gustafson TA (1998) Grb10 interacts differentially with the insulin receptor, insulin-like growth factor I receptor, and epidermal growth factor receptor via the Grb10 src homology 2 (SH2) domain and a second novel domain located between the pleckstrin homology and SH2 domains. J Biol Chem 273: 6860–6867 [DOI] [PubMed] [Google Scholar]
- Hemming R, Agatep R, Badiani K, Wyant K, Arthur G, Gietz R, Triggs-Raine B (2001) Human growth factor receptor bound 14 binds the activated insulin receptor and alters the insulin-stimulated tyrosine phosphorylation levels of multiple proteins. Biochem Cell Biol 79: 21–32 [PubMed] [Google Scholar]
- Hui R, Ball JR, Macmillan RD, Kenny FS, Prall OWJ, Campbell DH, Cornish AL, McClelland RA, Daly RJ, Forbes JF, Blamey RW, Musgrove EA, Robertson JFR, Nicholson RI, Sutherland RL (1998) EMS1 gene expression in primary breast cancer: relationship to cyclin D1 and oestrogen receptor expression and patient survival. Oncogene 17: 1053–1059 [DOI] [PubMed] [Google Scholar]
- Janes PW, Daly RJ, deFazio A, Sutherland RL (1994) Activation of the Ras signalling pathway in human breast cancer cell lines overexpressing erbB-2. Oncogene 9: 3601–3608 [PubMed] [Google Scholar]
- Kasus-Jacobi A, Perdereau D, Auzan C, Clauser E, Van Obberghen E, Mauvais-Jarvis F, Girard J, Burnol A (1998) Identification of the rat adapter Grb14 as an inhibitor of insulin actions. J Biol Chem 273: 26026–26035 [DOI] [PubMed] [Google Scholar]
- Klaman LD, Boss O, Peroni OD, Kim JK, Martino JL, Zabolotny JM, Moghal N, Lubkin M, Kim YB, Sharpe AH, Stricker-Krongrad A, Shulman GI, Neel BG, Kahn BB (2000) Increased energy expenditure, decreased adiposity, and tissue-specific insulin sensitivity in protein tyrosine phosphatase 1B-deficient mice. Mol Cell Biol 20: 5479–5489 [DOI] [PMC free article] [PubMed] [Google Scholar]
- Li M, Youngren JF, Dunaif A, Goldfine ID, Maddux BA, Zhang BB, Evans JL (2002) Decreased insulin receptor (IR) autophosphorylation in fibroblasts from patients with PCOS: effects of serine kinase inhibitors and IR activators. J Clin Endo Metab 87: 4088–4093 [DOI] [PubMed] [Google Scholar]
- Liu F, Roth RA (1995) Grb-IR: a SH2-domain-containing protein that binds to the insulin receptor and inhibits its function. Proc Natl Acad Sci (USA) 92: 10287–10291 [DOI] [PMC free article] [PubMed] [Google Scholar]
- Liu Y-F, Paz K, Herschkovitz A, Alt A, Tennenbaum T, Sampson SR, Ohba M, Kuroki T, LeRoith D, Zick Y (2001) Insulin stimulates PKCζ-mediated phosphorylation of insulin receptor substrate-1 (IRS-1). J Biol Chem 276: 14459–14465 [DOI] [PubMed] [Google Scholar]
- Mauvais-Jarvis F, Virkamaki A, Dodson Michael M, Winnay JN, Zisman A, Kulkarni RN, Kahn CR (2000) A model to explore the interaction between muscle insulin resistance and β-cell dysfunction in the development of Type 2 diabetes. Diabetes 49: 2126–2134 [DOI] [PubMed] [Google Scholar]
- Michael MD, Kulkarni RN, Postic C, Previs SF, Shulman GI, Magnuson MA, Kahn CR (2000) Loss of insulin signaling in hepatocytes leads to severe insulin resistance and progressive hepatic dysfunction. Mol Cell 6: 87–97 [PubMed] [Google Scholar]
- Molero J, Whitehead J, Meerloo T, James D (2001) Nocodazole inhibits insulin-stimulated glucose transport in 3T3-L1 adipocytes via a microtubule-independent mechanism. J Biol Chem 276: 43829–43835 [DOI] [PubMed] [Google Scholar]
- Reilly JF, Mickey G, Maher PA (2000) Association of fibroblast growth factor receptor 1 with the adaptor protein Grb14. J Biol Chem 275: 7771–7778 [DOI] [PubMed] [Google Scholar]
- Rui L, Yuan M, Frantz D, Shoelson S, White MF (2002) SOCS-1 and SOCS-3 block insulin signaling by ubiquitin-mediated degradation of IRS1 and IRS2. J Biol Chem 277: 42394–42398 [DOI] [PubMed] [Google Scholar]
- Saltiel AR, Kahn CR (2001) Insulin signalling and the regulation of glucose and lipid metabolism. Nature 414: 799–806 [DOI] [PubMed] [Google Scholar]
- Stein EG, Gustafson TA, Hubbard SR (2001) The BPS domain of Grb10 inhibits the catalytic activity of the insulin and IGF1 receptors. FEBS Lett 493: 106–111 [DOI] [PubMed] [Google Scholar]
- Taghibiglou C, Rashid-Kolvear F, Van Iderstine SC, Le-Tien H, Fantus IG, Lewis GF, Adeli K (2002) Hepatic very low density lipoprotein-ApoB overproduction is associated with attenuated hepatic insulin signaling and overexpression of protein-tyrosine phosphatase 1B in a fructose-fed hamster model of insulin resistance. J Biol Chem 277: 793–803 [DOI] [PubMed] [Google Scholar]