Abstract
A multicenter, open-label study was performed to evaluate the safety, anti-hepatitis B virus (anti-HBV) activity, and pharmacokinetics of emtricitabine therapy administered once daily for 8 weeks to patients infected with HBV. Clinical and virologic evaluations were completed at the baseline; at 7, 14, 28, 42, and 56 days during treatment; and at 24, 48, and 28 days posttreatment. Forty-nine patients were enrolled in five dose cohorts (doses of 25, 50, 100, 200, and 300 mg, all of which were administered once daily [q.d.]). Peak plasma emtricitabine concentrations occurred within 1.5 h following dosing. Plasma emtricitabine concentrations (maximum concentrations of drug in plasma and areas under the concentration-time curves) increased nearly dose proportionally over the 25- to 300-mg dose range, with relatively small intersubject variabilities. The plasma half-life of emtricitabine ranged from 6 to 9 h. HBV DNA levels were measured by the Digene HBV Hybrid Capture II assay. Viral suppression (reduction in log10 serum HBV DNA levels) occurred in all dose cohorts. All doses demonstrated potent and rapid antiviral activities, with a trend toward a greater suppression with daily doses of 100 mg or greater. At 2 months, the median change in the serum HBV DNA level from the baseline level ranged from −1.7 log10 for the 25-mg dose administered q.d. to −3.3 log10 for the 300 mg dose administered q.d. Emtricitabine was well tolerated over the 2-month dosing period. These results support further clinical development of emtricitabine for the treatment of chronic hepatitis B infection.
Chronic hepatitis B virus (HBV) infection is a common and often severe form of liver disease that affects approximately 1 million Americans and 350 million people worldwide (4, 8, 14). In addition to treatment with alpha interferon, major therapeutic advances have occurred with the discovery of new antiviral compounds that inhibit the reverse transcriptase activity of HBV DNA polymerase. Recently, lamivudine (3TC) has been approved for use in the treatment of chronic HBV infection. However, prolonged monotherapy with 3TC selects for resistance mutations at rates varying from 16 to 32% at 1 year in immune competent patients (4, 5, 7, 12, 13). Therefore, there is a need to develop additional anti-HBV drugs that may be used alone or in combination to alleviate the problem of resistance.
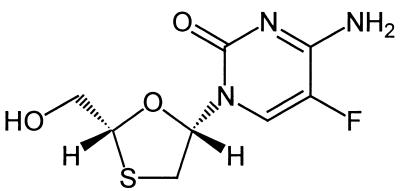
Emtricitabine (FTC) is a deoxycytidine analog reverse transcriptase inhibitor that has been demonstrated to have potent and selective inhibitory activities against HBV and human immunodeficiency virus (HIV) (the structure of FTC is illustrated in Fig. 1). FTC is readily anabolized by cellular enzymes stepwise to form its monophosphate, diphosphate, and finally, triphosphate forms. The triphosphate form is the active intracellular moiety that completely inhibits HBV DNA polymerase. The anti-HBV activity of FTC has been demonstrated in a chimeric mouse model and against woodchuck hepatitis virus in naturally infected woodchucks (1, 2).
FIG. 1.
FTC [(−)-2′,3′-dideoxy-5-fluoro-3′-thiacytidine].
In in vitro assays with HIV, FTC is more potent than 3TC and selects the M184V mutation less often and less rapidly during serial passage experiments in human peripheral blood mononuclear cells (11). In a recently completed phase III study with HIV-infected patients, virus in a statistically significantly lower percentage of FTC-treated patients with virologic failure developed the M184V mutation (21 and 48% at 1 year for the FTC and 3TC groups, respectively [P < 0.05]) (C. Van der Horst, C., I. Sanne, C. Wakeford, J. Quinn, and F. Rousseau, 8th Conf. Retrovir. Opportunistic Infect., abstr. 18, 2001). Although it is not guaranteed that the lower rate of mutation induced by FTC in HIV can be extrapolated to HBV, it is certainly encouraging since the YMDD mutation selected by 3TC in HBV is analogous to the M184V mutation in HIV. In HBV, the most common mutation conferring 3TC resistance affects the YMDD motif in the catalytic domain of the HBV reverse transcriptase-DNA polymerase (P gene), resulting in a methionine-to-valine or a methionine-to-isoleucine substitution at codon 550 (M550V or M550I) (9).
This paper describes a phase I-II, open-label dose range study of FTC in patients with HBV infection receiving FTC monotherapy at one of five doses ranging from 25 to 300 mg once daily (q.d.) for 8 weeks (protocol FTCB-101).
MATERIALS AND METHODS
Patients.
Eligible patients included men and women (ages, 18 to 55 years, inclusive) in whom hepatitis B surface antigen (HBsAg) was detectable in serum for at least 3 months or who were positive for HBsAg and negative for immunoglobulin M antibody to hepatitis B core antigen. In addition, detectable HBV DNA (determined by the Quantiplex HBV DNA assay [Chiron, Emeryville, Calif.]) and aspartate aminotransferase or alanine aminotransferase (ALT) levels no more than 2.5 times the upper limit of normal (ULN) were required for inclusion in the study. Patients were not eligible for the study if they had hepatitis C or D or HIV type 1 infection or decompensated liver disease (defined as a bilirubin level more than 1.5 times the ULN, a prothrombin time less than 60% of that for the control or more than 1.25 times the ULN, or a history of ascites, variceal hemorrhage, or hepatic encephalopathy). Patients were also excluded if they had received interferon within the past 3 months or nucleoside analogues or other antivirals for a duration of more than 3 months or within 60 days of screening or were receiving antiviral, immunomodulatory, or corticosteroid therapy.
The study was approved by the institutional review board or independent ethics committee at the participating centers, and all the patients gave written informed consent before enrollment in the study.
Study design.
The study described here was a phase I-II dose escalation cohort study. Following a 30-day screening period, the patients were sequentially enrolled into five cohorts (each cohort contained a minimum of eight patients) for q.d. dosing for 8 weeks, with a follow-up period extending 28 days after the treatment period concluded. Patients returned at the baseline and treatment days 7, 14, 28, 42, and 56. Serum was assayed for HBV DNA level and hepatitis B e antigen (HBeAg) at the time of screening, at the baseline, and at each on-treatment visit. During the follow-up period, HBV DNA levels were measured 24 and 48 h after the administration of the last dose and again after 28 days of follow-up. Physical examination, evaluation of vital signs, and laboratory hematology, biochemistry, and urinalysis studies for the assessment of safety were performed at all visits except for the follow-up visits 24 and 48 h after administration of the final FTC dose.
Initiation of treatment in subsequent dose cohorts occurred after the preceding cohort was filled and after it was determined that the FTC safety profile was acceptable for the previous cohort. A cohort size of 8 to 12 patients was allowed per protocol. The dose levels evaluated were 25, 50, 100, 200, and 300 mg (all doses were given q.d.).
Drug assay and pharmacokinetic evaluations.
The pharmacokinetics of FTC were evaluated following the administration of a single dose (the first dose) and at steady state. On day 1 and on day 28, patients took FTC following an overnight fast and did not eat until 3 h after they had ingested that dose. Blood or plasma samples were collected prior to administration of the dose and at 0.5, 1, 1.5, 2, 3, 4, 6, 8, 12, and 24 h after administration. Samples for determination of trough concentrations were obtained just prior to dosing on the morning of days 7, 14, 42, and 56.
Samples of blood (7 ml) were collected in tubes with potassium EDTA and were processed to provide plasma for FTC assays. The samples were analyzed by a validated liquid chromatography-mass spectrometry-mass spectrometry methodology with a quantitation range of 10 to 2,500 ng/ml. FTC was resolved with an aqueous-organic mobile phase on a reversed-phase column and was detected by mass spectrometry-mass spectrometry with atmospheric pressure chemical ionization. The interassay variability ranged from 3.7 to 9.2%, and the intraday assay variability ranged from 4.1 to 7.1%. The assay method was accurate, with the difference from the nominal value ranging from −1.3 to 8.1%.
Pharmacokinetic parameters were derived by noncompartmental methods. The principal parameters of interest were the maximum drug concentration in plasma (Cmax), the time to Cmax, the minimum drug concentration, the area under the concentration-time curve (AUC), and the apparent total body clearance.
Virology.
The samples were assayed for HBV DNA at Triangle Pharmaceuticals, Inc., by use of the Digene HBV Hybrid Capture II assay. This is a signal amplification hybridization microplate assay that uses chemiluminescence for the detection and quantitation of HBV DNA in human serum and that has a limit of detection (LOD) of 4,700 copies/ml (0.017 pg/ml). The acceptability criterion for interassay and intra-assay variability was 20%. No genotypic analysis was performed.
Statistical analysis.
All analyses of data related to the HBV DNA level were conducted with log10 transformed data, with comparisons made to the baseline levels.
The log10 HBV DNA levels and the change in log10 HBV DNA levels from the baseline levels for each patient were summarized by cohort for each on-treatment visit and were plotted over time.
The average area under the curve minus baseline (AAUCMB) for HBV DNA obtained by the Digene assay was calculated, tabulated, and plotted for all patients. The AAUCMB was derived from the area under the response-time curve (AUC) by the trapezoid method divided by the time from the baseline to the last available on-treatment value minus the baseline value, i.e.,
 |
where C0,i is the measurement for patient i at the baseline, Cj,i is the measurement for patient i at week tj, tn is the last time point for which data on the HBV DNA level were available, tj is the actual day of the jth visit, and t0 is time zero. Data for patients for whom at least one evaluation was conducted after the baseline were included in the AAUCMB analysis.
The dose-response relationship of the anti-HBV activity of FTC was also evaluated by use of a pharmacological (Emax) model, as described by the following equation: antiviral activity = (Emax × dose)/(ED50 + dose), where Emax is the maximal anti-HBV activity, and EC50 is the dose required to produce 50% of the maximal anti-HBV activity. This equation contains two unknown parameters, Emax and ED50. The known parameters, dose and antiviral activity at each dose, are plotted, and the curve with the best fit is applied by use of this model. In the equation, antiviral activity was assessed by using two parameters, AAUCMB for the HBV DNA level and the level of suppression of the viral load from that at the baseline to that on day 56. The parameter that provided the best overall correlation with anti-HBV activity was AAUCMB because of the averaging effect over the entire dosing period versus a single measure of viral load suppression on the last day of dosing (the last on-treatment measurement).
RESULTS
Study population.
The study was conducted between 16 June 1998 and 2 June 1999 at four sites in the United States and one site in Hong Kong. A total of 92 patients were screened, and 49 patients were enrolled in the study: 11, 8, 11, 9, and 10 patients were in the cohorts receiving doses of 25, 50, 100, 200, and 300 mg q.d., respectively. All patients except three of the patients in the 25-mg q.d. dose group completed the entire treatment. One patient had low HBV DNA levels and was withdrawn from the study, another patient discontinued the study due to seroconversion (details of the serologic profile are not available), and a third patient was terminated from the study due to adverse experiences (AEs). A fourth patient in the 25-mg dose group completed the dosing period but was lost to follow-up; therefore, data for this patient are included in all analyses conducted for times up to the time of loss to follow-up.
The population for safety evaluation included all 49 patients, and the population for analysis of antiviral activity consisted of 45 patients whose HBV DNA levels were analyzed by use of the Digene HBV Hybrid Capture II assay through the end of treatment (day 56). The excluded patients were the three patients who were discontinued from the study during the treatment period (viral load data were not available beyond day 14 for any of these patients), and an additional patient whose serum was not measured by the Digene HBV Hybrid Capture II assay but who had a viral load ≤400 copies/ml by a Roche quantitative PCR assay. The baseline characteristics of the patients are summarized in Table 1.
TABLE 1.
Baseline characteristics of the study population
| Characteristic | Cohort (FTC q.d. dose)
|
All patients (n = 49) | ||||
|---|---|---|---|---|---|---|
| 25 mg (n = 11) | 50 mg (n = 8) | 100 mg (n = 11) | 200 mg (n = 9) | 300 mg (n = 10) | ||
| Sex (no. [%] of patients) | ||||||
| Male | 8 (73) | 5 (63) | 10 (91) | 6 (67) | 9 (90) | 38 (78) |
| Female | 3 (27) | 3 (38) | 1 (9) | 3 (33) | 1 (10) | 11 (22) |
| Ethnic origin (no. [%] of patients) | ||||||
| Caucasian | 2 (18) | 1 (9) | 1 (10) | 4 (8) | ||
| Black | 1 (9) | 1 (2) | ||||
| Asian | 8 (73) | 8 (100) | 10 (91) | 8 (89) | 9 (90) | 43 (88) |
| Hispanic | 1 (11) | 1 (2) | ||||
| Age (yr) | ||||||
| Mean (SD) | 34 (11.0) | 31 (7.9) | 37 (9.8) | 30 (8.2) | 36 (7.8) | 34 (9.2) |
| Median | 34 | 30 | 34 | 31 | 34 | 32 |
| Minimum-maximum | 19-52 | 20-47 | 26-55 | 19-45 | 25-51 | 19-55 |
| No. [%] of patients who were HBeAg positive | 7 (64) | 6 (75) | 11 (100) | 9 (100) | 8 (80) | 41 (84) |
| Mean (SD) ALT level (U/liter) | 80 (43) | 101 (45) | 83 (66) | 107 (78) | 114 (122) | 96 (75) |
| Baseline log10 HBV DNA level (no. of copies/ml)a | ||||||
| Median | 8.6 | 7.4 | 7.06 | 8.5 | 7.5 | 7.9 |
| Minimum-maximum | 6.2-9.3 | 7.3-9.1 | 5.8-9.3 | 4.8-10.4 | 6.4-8.7 | 4.8-10.4 |
| No. (%) of evaluable patients | 7 (64) | 8 (100) | 11 (100) | 9 (100) | 10 (100) | 45 (92) |
Log10 HBV DNA levels were determined by the Digene assay.
Pharmacokinetics.
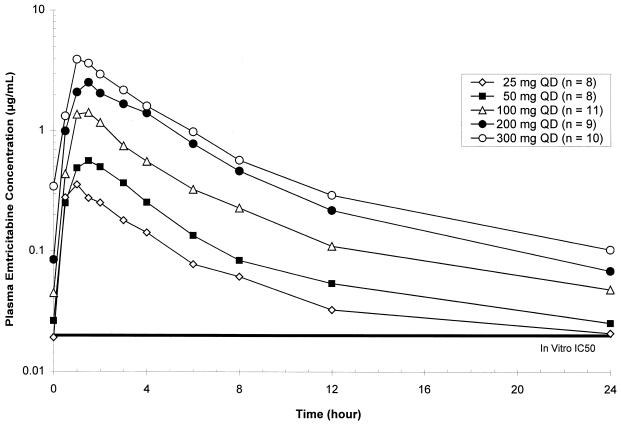
Mean plasma FTC concentration-versus-time profiles at steady state (day 28) for all dose cohorts studied in protocol FTCB-101 are shown in Fig. 2 (semilogarithmic plots).
FIG. 2.
Mean steady-state plasma FTC concentration-versus-time curves. QD, once daily; IC50, 50% inhibitory concentration.
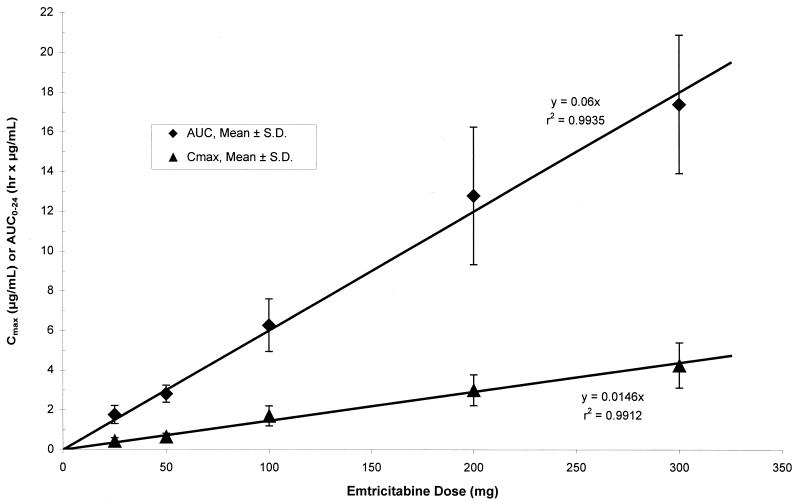
FTC was rapidly and well absorbed following oral administration in HBV-infected subjects, with Cmaxs reached within 1.5 h following dosing. Steady-state plasma FTC concentrations reached levels well above the mean in vitro 50% inhibitory concentrations for inhibition of intracellular HBV DNA synthesis (0.05 μM, equivalent to 0.012 μg/ml) and production of extracellular virus (0.01 ± 0.005 μM) for all q.d. dose levels evaluated in this study. Plasma FTC concentrations (Cmaxs and AUCs) increased nearly dose proportionally over the 25- to 300-mg dose range, with relatively small intersubject variabilities (Table 2). Thus, the level of plasma exposure to FTC (i.e., AUC and Cmax) is directly correlated with the dose in a linear relationship, as illustrated in Fig. 3. The other pharmacokinetic parameters were independent of the dose.
TABLE 2.
Steady-state pharmacokinetic parameter estimates for FTCa
| Cohort (FTC q.d. dose [mg]) | Cmax (μg/ml) | Tmax (h) | AUC0-24 (μg · h/ml) | t1/2 (h) | CL/F (ml/min) |
|---|---|---|---|---|---|
| 25 (n = 9) | 0.43 (0.17) | 1.14 (0.58) | 1.76 (0.45) | 9.32 (2.66) | 250 (57) |
| 50 (n = 8) | 0.65 (0.17) | 1.20 (0.39) | 2.81 (0.43) | 9.05 (1.66) | 303 (48) |
| 100 (n = 11) | 1.70 (0.50) | 1.48 (0.60) | 6.27 (1.33) | 6.81 (1.35) | 279 (67) |
| 200 (n = 9) | 3.00 (0.78) | 1.50 (1.03) | 12.79 (3.46) | 6.68 (1.36) | 277 (70) |
| 300 (n = 10) | 4.25 (1.14) | 1.29 (0.33) | 17.39 (3.49) | 5.86 (1.47) | 297 (56) |
The values are means (standard deviations). Tmax, time to Cmax; AUC0-24, AUC from 0 to 24 h; t1/2, half-life; CL/F, apparent total body clearance.
FIG. 3.
Mean ± standard deviation steady-state plasma FTC Cmax and AUC from 0 to 24 h (AUC0-24) versus dose.
Antiviral effect.
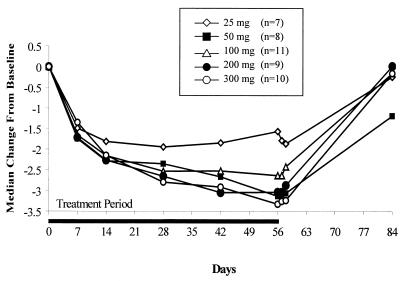
A decrease in the HBV load was seen for all dose levels during treatment, with a maximum median decline in the serum HBV DNA level of −3.3 log10 copies/ml compared to that at the baseline detected in the 300-mg cohort. The decrease was maintained for 48 h following administration of the last dose, but the levels approached pretreatment levels at the 4-week posttreatment follow-up time point. The median change in the log10 HBV DNA level from the baseline level is illustrated in Fig. 4.
FIG. 4.
Change in median HBV DNA (log10) level from the baseline level over time.
Table 3 summarizes the antiviral activity of FTC at day 56 (the last day of dosing) by dose cohort in terms of the proportion of patients with serum HBV DNA levels below the LOD (4,700 copies/ml), the proportion of patients with a ≥2 log10 decrease in HBV DNA level, the median change in the HBV DNA level from the baseline level, and the median percent measurable change in the HBV DNA level. The percent measurable change is calculated as the change from the baseline HBV DNA level divided by the maximum measurable difference (baseline level minus the LOD).
TABLE 3.
Summary of antiviral activity of FTC
| Cohort (FTC q.d. dose [mg]) | No. (%) of patients with:
|
Median change in log10 HBV DNA level between baseline and day 56 (minimum to maximum) | Median % measurable change at day 56a | |
|---|---|---|---|---|
| Serum HBV DNA level less than or equal to LOD | ≥2 log10 decrease in serum HBV DNA level | |||
| 25 (n = 7) | 0 (0) | 3 (42.9) | −1.68 (−4.11 to −0.48) | 44.8 |
| 50 (n = 8) | 3 (37.5) | 7 (87.5) | −3.15 (−4.24 to −1.57) | 83.7 |
| 100 (n = 11) | 3 (27.3) | 8 (72.7) | −2.65 (−3.97 to −1.47) | 71.1 |
| 200 (n = 9) | 3 (33.3) | 8 (88.9) | −3.04 (−4.47 to −1.09) | 83.1 |
| 300 (n = 10) | 3 (30.0) | 9 (90) | −3.33 (−4.61 to −1.58) | 89.8 |
| All patients (n = 45) | 12 (26.7) | 35 (77.8) | −3.0 (−4.61 to −0.48) | 71.8 |
Calculated as the change from the baseline divided by the difference between the LOD (4,700 copies/ml) and the baseline value. Specifically, for each patient the ratio of the observed decrease versus the maximum theoretically measurable decrease was calculated as a percentage, and the median percentage is presented for each dose group.
The LOD (3.7 log10) is close to the value of 104 copies/ml suggested by Gauthier and coworkers (6) as a threshold beneath which patients are more likely to seroconvert to positivity for anti-HBe antibodies than patients who do not achieve this level of HBV clearance. About a third of patients in all dose groups except the lowest one had undetectable serum HBV DNA levels on day 56, but none of the patients given 25 mg q.d. had this level of HBV suppression, again suggesting a diminished response with the 25-mg q.d. dose. The HBV DNA levels decreased at least 1 log10 at the end of treatment (day 56) in all patients given FTC at doses of 50 mg q.d. or higher. The higher doses, 200 and 300 mg q.d., resulted in 2 log10 decreases in HBV DNA levels for 90% or more of the patients. However, the median percent measurable change did not appreciably differ among the groups receiving the 50-, 100-, 200-, and 300-mg doses. Overall, among the patients in all dose groups, 96% (n = 43) had a 1 log10 decrease in the HBV DNA level from the baseline level, 78% (n = 35) had a ≥2 log10 decrease, and 53% (n = 24) had a ≥3 log10 decrease. For three patients it was not possible to assess whether a 2 or 3 log10 decrease occurred because their baseline HBV DNA levels were within 2 or 3 log10 above the LOD.
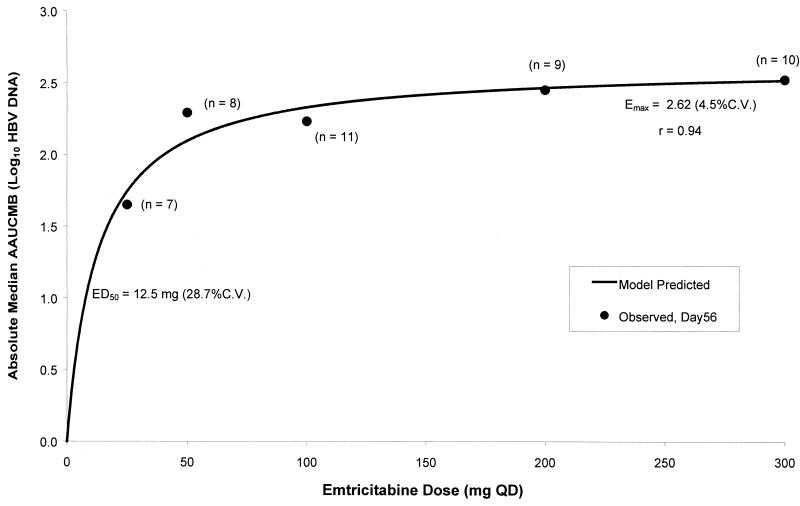
The comparison of the differences in the AAUCMBs across the dose levels indicated a trend toward a dose-response that approached statistical significance (P = 0.0864). However, this trend is nearly entirely driven by the diminished response for the 25-mg q.d. dose compared to those for all other doses. The median AAUCMBs were −1.65, −2.29, −2.23, −2.45, and −2.50 log10 for the 25-, 50-, 100-, 200-, and 300-mg dose groups, respectively.
Pharmacological modeling of antiviral activity.
The Emax model showed that 94% of the maximal activity was reached with the 200-mg q.d. dose. The 100-mg q.d. dose produced anti-HBV activity less than 90% of the maximal activity. As the dose increased by one-third (from 200 to 300 mg), there was a minimal (∼2%) increase in anti-HBV activity. Figure 5 shows the dose-response relationship of the anti-HBV activity of FTC obtained by using the median AAUCMB (expressed as the absolute value of the log10 number of HBV DNA copies per milliliter) as the antiviral response parameter.
FIG. 5.
Dose-response relationship of FTC anti-HBV activity. QD, once daily; C.V., coefficient of variation.
Serology and liver function tests.
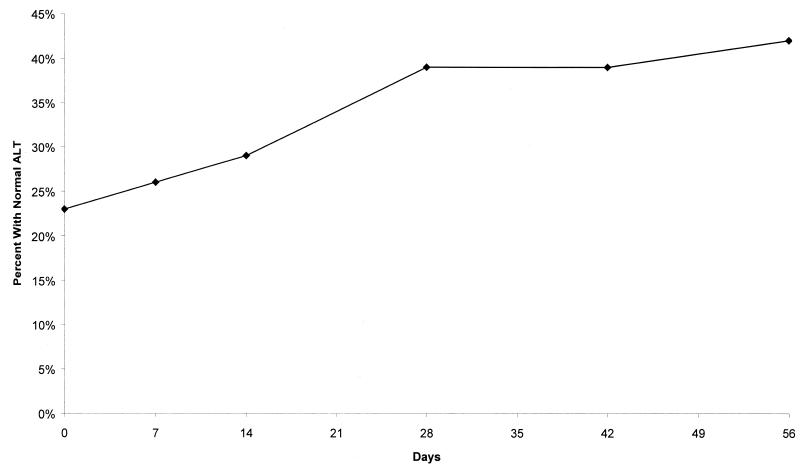
Among the 40 HBeAg-positive patients, three patients lost HBeAg during the posttreatment follow-up period and one of these patients developed anti-HBe antibodies. The number of patients with increased ALT levels in each dose group was too small for reliable inferences to be drawn. However, overall, across all dose groups, the percentage of patients with normal ALT levels increased during the 8-week treatment period, as illustrated in Fig. 6. No dose-response in terms of ALT levels was observed.
FIG. 6.
Percentage of patients with normal ALT levels over time (all doses).
Safety.
Overall, all doses of FTC were well tolerated, with only one patient in the 25-mg q.d. dose group discontinued from the study due to mild vertigo and severe headache that developed after 17 days of dosing. There were no serious AEs and no consistent dose-response relationships for AEs. The most frequently occurring AEs are summarized in Table 4.
TABLE 4.
Frequency of AEs
| AE | No. (%) of patients in the following cohort (FTC q.d. dose [mg])
|
Total (n = 49) | ||||
|---|---|---|---|---|---|---|
| 25 (n = 11) | 50 (n = 8) | 100 (n = 11) | 200 (n = 9) | 300 (n = 10) | ||
| Any | 7 (64) | 7 (88) | 9 (82) | 7 (78) | 8 (80) | 38 (78) |
| Headache | 3 (27) | 0 (0) | 2 (18) | 4 (44) | 3 (30) | 12 (25) |
| Flu syndrome | 0 (0) | 3 (38) | 2 (18) | 1 (11) | 1 (10) | 7 (14) |
| Asthenia | 2 (18) | 0 (0) | 2 (18) | 0 (0) | 2 (20) | 6 (12) |
| Abdominal pain | 0 (0) | 1 (13) | 1 (9) | 2 (22) | 0 (0) | 4 (8) |
| Infection | 0 (0) | 0 (0) | 1 (9) | 1 (11) | 2 (20) | 4 (8) |
| Malaise | 0 (0) | 1 (13) | 3 (27) | 0 (0) | 0 (0) | 4 (8) |
DISCUSSION
Overall, FTC was well tolerated, and all dose levels produced a significant decrease in serum HBV DNA levels when the levels were evaluated over a 2-month dosing period. At least 30% of patients in each dose group receiving FTC doses 50 mg q.d. or higher achieved a reduction in HBV DNA levels below the LOD of the Digene HBV Hybrid Capture II assay (4,700 copies/ml). At 2 months, the median change in the serum HBV DNA level from the baseline level ranged from −1.7 log10 for the 25-mg q.d. dose to −3.3 log10 for the 300-mg q.d. dose.
There was a trend toward increasing antiviral activity in a dose-dependent manner, with activity reaching a plateau at doses ≥100 mg q.d., as determined by use of the Emax model, but there was little ability to discern incremental changes in activity for doses at or above 50 mg q.d. However, since this study was not randomized, the baseline viral load was not evenly distributed among the dose groups. In particular, the baseline viral load was high in the 25- and 200-mg groups and low in the 100-mg group, potentially confounding the measure of activity and complicating selection of the most efficacious dose. These data suggest, however, that the dose does not need to be higher than 200 mg q.d. Emax modeling supports the selection of the 200-mg q.d. dose of FTC because greater than 90% of the maximal activity was achieved with this dose. The 50-mg q.d. dose also performed well in terms of antiviral activity, underlining the inherent problem and difficulty with definitive dose selection on the basis of nonrandomized studies of efficacious therapies. Tolerability and efficacy are being evaluated further in patients with chronic HBV infection to confirm the optimal dose. These data have provided support for the selection of the doses to be compared in a subsequent randomized, double-blind, phase II study of FTC (protocol FTCB-102) with HBV-infected patients.
In patients with HIV infection, analysis of intracellular phosphorylation of FTC to the triphosphate (the active inhibitor of HIV reverse transcriptase and HBV DNA polymerase) showed that there was no increase in the intracellular level of the triphosphate after the administration of doses of 200 mg q.d. or more (3, 10). Therefore, the results of Emax modeling of the antiviral activities of the 100- to 200-mg q.d. doses agree with the intracellular findings for peripheral blood mononuclear cells infected with HIV (10). It is unknown whether the intracellular anabolism of FTC is the same between peripheral blood mononuclear cells and hepatocytes. However, it is noteworthy that the optimal FTC dose for the treatment of HIV infection is the same as the optimal dose for the treatment of HBV infection.
These results support further clinical development of FTC for the treatment of chronic active hepatitis B.
Acknowledgments
We thank all of the study participants, as well as Donna Staton for assistance with preparation of the manuscript.
Study FTCB-101 was sponsored by Triangle Pharmaceuticals, Inc.
REFERENCES
- 1.Condreay, L. D., R. W. Jansen, T. F. Powdrill, L. C. Johnson, D. W. Selleseth, M. T. Paff, S. M. Daluge, G. R. Painter, P. A. Furman, M. N. Ellis, and D. R. Averett. 1994. Evaluation of the potent antihepatitis B virus agent (−)-cis-5-fluoro-1-[2-(hydroxymethyl)-1,3-oxathiolan-5-yl]cytosine in a novel in vivo model. Antimicrob. Agents Chemother. 38:616-619. [DOI] [PMC free article] [PubMed] [Google Scholar]
- 2.Cullen, J. M., S. L. Smith, M. G. Davis, S. E. Dunn, C. Botteron, A. Cecchi, D. Lindsey, L. Frick, M. T. Paff, A. Goudling, and K. Biron. 1997. In vivo antiviral activity and pharmacokinetics of (−)-cis-5-fluoro-1-[2-(hydroxymethyl)-1,3-oxathiolan-5-yl]cytosine in woodchuck hepatitis virus-infected woodchucks. Antimicrob. Agents Chemother. 41:2076-2082. [DOI] [PMC free article] [PubMed] [Google Scholar]
- 3.Darque, A., G. Valette, F. Rousseau, L. H. Wang, J.-P. Sommadossi, and X.-J. Zho. 1999. Quantitation of intracellular triphosphate of emtricitabine in peripheral blood mononuclear cells from human immunodeficiency virus-infected patients. Antimicrob. Agents Chemother. 43:2245-2250. [DOI] [PMC free article] [PubMed] [Google Scholar]
- 4.Dienstag, J. L., E. R. Schiff, T. L. Wright, R. P. Perrillo, H.-W. L. Hann, Z. Goodman, L. Crowther, L. D. Condreay, M. Woessner, M. Rubin, and N. A. Brown. 1999. Lamivudine as initial treatment for chronic hepatitis B in the United States. N. Engl. J. Med. 341:1256-1263. [DOI] [PubMed] [Google Scholar]
- 5.Dienstag, J. L., E. R. Schiff, M. Mitchell, D. E. Casey, Jr., N. Gitlin, T. Lissoos, L. D. Gelb, et al. 1999. Extended lamivudine retreatment for chronic hepatitis B: maintenance of viral suppression after discontinuation of therapy. Hepatology 30:1082-1087. [DOI] [PubMed] [Google Scholar]
- 6.Gauthier, J., E. J. Bourne, M. W. Lutz, L. M. Crowther, J. L. Dienstag, N. A. Brown, and L. D. Condreay. 1999. Quantitation of hepatitis B viremia and emergence of YMDD variants in patients with chronic hepatitis B treated with lamivudine. J. Infect. Dis. 180:1757-1762. [DOI] [PubMed] [Google Scholar]
- 7.Lai, C. L., R. W. Chine, N. W. Y. Leung, T. T. Chang, R. Guan, D. I. Tai, K. Y. Ng, et al. 1998. A one year trial of lamivudine for chronic hepatitis B. N. Engl. J. Med. 339:61-68. [DOI] [PubMed] [Google Scholar]
- 8.Lau, D. T.-Y., M. F. Khokhar, E. Doo, M. G. Ghany, D. Herion, Y. Park, D. E. Kleiner, P. Schmid, L. D. Condreay, J. Gauthier, M. C. Kuhns, T. J. Liang, and J. H. Hoofnagle. 2000. Long-term therapy of chronic hepatitis B with lamivudine. Hepatology 32:828-834. [DOI] [PubMed] [Google Scholar]
- 9.Lok, A. S.-F., M. Hussain, C. Cursano, M. Margotti, A. Gramenzi, G. L. Grazi, E. Jovine, M. Benardi, and P. Andreone. 2000. Evolution of hepatitis B virus polymerase gene mutations in hepatitis B e antigen-negative patients receiving lamivudine therapy. Hepatology 32:1145-1153. [DOI] [PubMed] [Google Scholar]
- 10.Rousseau, F. S., J. O. Kahn, M. Thompson, D. Mildvan, D. Shepp, J.-P. Sommadossi, J. Delehanty, J. N. Simpson, L. H. Wang, J. B. Quinn, C. Wakeford, and C. van der Horst. 2001. Prototype trial design for rapid dose selection of antiretroviral drugs: an example using emtricitabine (Coviracil®). J. Antimicrob. Chemother. 48:507-513. [DOI] [PubMed] [Google Scholar]
- 11.Schinazi, R. F., R. M. Lloyd, Jr., M.-H. Nguyen, D. L. Cannon, A. McMillan, N. Ilksoy, C. K. Chu, D. C. Liotta, H. Z. Bazmi, and J. W. Mellors. 1993. Characterization of human immunodeficiency viruses resistant to oxathiolane-cytosine nucleosides. Antimicrob. Agents Chemother. 37:875-881. [DOI] [PMC free article] [PubMed] [Google Scholar]
- 12.Si Ahmed, S. N., D. Tavan, C. Pichoud, F. Berby, L. Stuyver, M. Johnson, P. Merle, H. Abidi, C. Trepo, and F. Zoulim. 2000. Early detection of viral resistance by determination of hepatitis B virus polymerase mutations in patients treated by lamivudine for chronic hepatitis B. Hepatology 32:1078-1088. [DOI] [PubMed] [Google Scholar]
- 13.Tassopoulos, N. C., R. Volpes, G. Pastore, J. Heathcote, M. Buti, R. D. Goldin, S. Hawley, et al. 1999. Efficacy of lamivudine in patients with hepatitis B e antigen-negative/hepatitis B virus DNA-positive (precore mutant) chronic hepatitis B. Hepatology 29:889-896. [DOI] [PubMed] [Google Scholar]
- 14.Walsh, K., and G. J. M. Alexander. 2001. Update on chronic viral hepatitis. Postgrad. Med. J. 77:498-505. [DOI] [PMC free article] [PubMed] [Google Scholar]


