

To the Editor:
Recently, we proposed the pedigree disequilibrium test (PDT) as a test for allelic association and linkage (linkage disequilibrium) in general pedigrees (Martin et al. 2000). We have discovered that, in certain cases in extended pedigrees, the PDT can be biased under the null hypothesis. In this letter we describe the nature of the bias and illustrate a model in which the bias arises. We offer two alternative modifications to the PDT statistic, both of which result in valid tests of linkage disequilibrium over all genetic models and family structures.
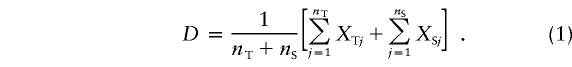
In constructing the PDT statistic, we considered two types of families within a pedigree. Informative nuclear families are those in which there is at least one affected individual, with both parents genotyped at the marker and at least one parent heterozygous. Informative discordant sibships have at least one affected and one unaffected sibling with different marker genotypes. For a marker locus with two alleles, M1 and M2, we defined the random variables XTj, for the jth triad (affected individual and both parents) in the pedigree, and XSj, for the jth discordant sib pair (DSP) in the pedigree: XTj = (no. of M1 transmitted) − (no. of M1 not transmitted) and XSj = (no. of M1 in affected sib) − (no. of M1 in unaffected sib), respectively. In our previous study (Martin et al. 2000), we defined a measure of association (D) for a pedigree containing nT triads from informative nuclear families and nS DSPs from informative discordant sibships:
 |
Let Di be the measure of association in the ith pedigree in a sample of N independent pedigrees. The PDT statistic is given by  . The critical assumption is that the T is asymptotically normal, with mean 0 and variance 1, under the null hypothesis of no linkage disequilibrium.
The difficulty that can be encountered is that, for some cases under the null hypothesis, the expected value of T may actually be different from 0, a situation that results in an inflated type I error. This is best illustrated by an example. Consider a fully penetrant dominant disease locus (with alleles d1 and d2) with no phenocopies, so that there is probability 1 that an individual with at least one copy of the disease allele is affected. Furthermore, assume that the disease allele (d1) is rare so that in any pedigree there is, at most, one segregating copy of the disease allele. Suppose that we have sampled extended three-generation pedigrees with the structure shown in figure 1. Only families in which the grandparent (GP2), parent (P2), and offspring (O) are all affected can lead to bias. Otherwise there will be, at most, one informative triad. Disease-locus genotypes are fully specified, given the affection status (see fig. 1).
Figure 1.

Pedigrees illustrating PDT bias. Black circles denote affected individuals and white squares denote unaffected individuals. Disease- and marker-locus genotypes are shown for each individual. Values of quantities from equation (1) are given for each pedigree.
Suppose that there is a marker locus fully linked to the disease locus (i.e., there is no recombination) but that there is no allelic association between the alleles at the two loci. This is the null hypothesis for the PDT. Furthermore, suppose that the marker locus has two alleles, with one allele—say, M1—being rare so that only one founder is heterozygous at the marker (families with no heterozygotes are not informative and therefore are not considered) and all three of the founders (GP1, GP2, and P1) are equally likely to be the heterozygote. The possible transmission patterns and the calculation of relevant quantities are shown in figure 1. For each pedigree we give the value of D, XT, and nT. Each of the six pedigrees in figure 1 is equally likely under the null hypothesis for the model given. Taking the expectation of D over these pedigrees yields E(D)=- 1/6. Therefore, in this example, it is not the case that E(T)=0.
From this example we can see that the problem arises when a grandparent is heterozygous: even though heterozygous grandparents are equally likely to transmit M1 or M2, the weights in the average (eq. [1]) differ depending on which allele is transmitted. If M1 is transmitted, then the average is over nT=2. If M2 is transmitted, then the average is over nT=1. Thus, there is a bias toward concluding that the more common allele is transmitted more often, even under the null hypothesis of equal transmission.
One can construct an unbiased test by requiring that the weights used in the average be independent of marker genotype. One alternative, hereafter referred to as the “PDT-avg,” is to average over all phenotypically informative units. Specifically, let nT be the number of fully genotyped family triads, irrespective of heterozygosity, and let nS be the number of DSPs, without requiring that they come from an informative sibship. For the example in figure 1, the PDT-avg is calculated by setting all nT=2, and this gives E(D)=0. A second alternative, hereafter referred to as the “PDT-sum,” is to use the sum from equation (1) and not use averages at all. This also gives E(D)=0 for the example in figure 1, since all nT=1 for the PDT-sum. (Software for the calculation of the PDT-avg and the PDT-sum statistics can be obtained from the Duke Center for Human Genetics Web site.) Approaches based on sums of random variables within pedigrees have also been proposed elsewhere (Martin et al. 1997; Teng and Risch 1999; Abecasis et al. 2000; Rabinowitz and Laird 2000). Intuitively, basing a statistic on the sum gives more weight to families with a greater number of phenotypically informative units, whereas averaging gives all families equal weight.
To compare these alternative tests to the original form of the PDT (“PDT-old”), we estimated type I error and power for the tests, using simulations (table 1). The same genetic models (i.e., 1–6) used by Martin et al. (2000) were used in these simulations, and marker- and disease-allele frequencies were set at .3. To simulate the null hypothesis, we simulated a lack of allelic association between the marker and disease loci but did not allow recombination. For each estimate, 5,000 replicate samples of 250 extended pedigrees of the structure used by Martin et al. (2000) were simulated. These simulations differ from those of Martin et al. (2000). In that study, ascertainment was assumed to be random with respect to affection status. In an attempt to simulate the ascertainment of extended pedigrees more realistically, the simulations in the present study produce pedigrees that are conditional on having at least one affected cousin pair.
Table 1.
Estimates of Type 1 Error and Power for PDTs for Various Genetic Models, Based on 5,000 Replicate Simulations[Note]
|
Type 1 Error |
Power |
|||||
| Modela | PDT-old | PDT-avg | PDT-sum | PDT-old | PDT-avg | PDT-sum |
| 1 | .052 | .048 | .046 | .956 | .978 | .982 |
| 2 | .052 | .052 | .052 | .780 | .847 | .856 |
| 3 | .046 | .043 | .044 | .483 | .548 | .563 |
| 4 | .050 | .047 | .045 | .982 | .993 | .995 |
| 5 | .050 | .045 | .049 | .824 | .876 | .897 |
| 6 | .052 | .046 | .048 | .247 | .276 | .289 |
Note.— Nominal significance level is .05.
Summary of models (fij is penetrance for genotype ij)—1: f11=.39, f12=.33, f22=.26; 2: f11=.37, f12=.32, f22=.27; 3: f11=.35, f12=.15, f22=.28; 4: f11=.22, f12=.17, f22=.12; 5: f11=.20, f12=.165, f22=.13; and 6: f11=.17, f12=.155, f22=.14.
The results show that, for the cases examined, all tests have type I error levels close to the nominal level of .05 and thus are valid for these models. As we reported in our previous article (Martin et al. 2000), there is little bias reflected in the test when the original form of the statistic is used, although the estimates of type I error are larger than those for the PDT-avg and the PDT-sum, for each model. Part of the reason that there is little bias in these simulations is our choice of allele frequency for the marker. It can be shown that there is no bias when the frequencies of the marker alleles are .5. In these simulations, we used frequencies of .3 and .7, so there was less bias than expected for cases with more-extreme allele frequencies. An additional reason that little bias was seen is that we did not use grandparental genotypes in the calculation of the test statistic. It is possible to show that, when there are only two generations in the pedigree, there will be little bias as long as the genetic effect is not large. In these simulations, the genetic effect was low (i.e., the penetrances are all similar) for each of the models considered. It is noteworthy that, if grandparental genotypes were used, there could be bias even if there were no genetic effect due to this locus (i.e., even if penetrances were equal).
The results in table 1 demonstrate that the new tests can be more powerful than the original test. For these simulations we found that power is similar for the PDT-avg and the PDT-sum, but this will not always be the case. The PDT-sum gives more weight to families of larger size, whereas the PDT-avg gives all families equal weight. Thus, if pedigrees contain a similar number of phenotypically informative family units, then the values of the statistics will be similar. Differences will be most apparent when families are of different sizes. Exploratory simulations (not shown) have demonstrated that, in many cases, the PDT-sum can be more powerful than the PDT-avg; however, neither test is uniformly more powerful over all genetic models.
In summary, we have identified examples in which the original form of the PDT can be biased. There is no bias when the original form of the statistic is used in nuclear families (with or without parents) or when the marker-allele frequencies are .5. The bias is evident only when there are multiple generations contributing to the statistic, when the genetic effect due to the locus is strong, and when marker-allele frequencies are extreme. We have proposed two alternative statistics that not only remove the bias but also result in tests that can be more powerful than the original test. These tests provide valid alternatives for assessment of linkage disequilibrium in general pedigrees.
Acknowledgments
This work was supported, in part, by the following grants from the National Institutes of Health: NIH R01 grant MH-98-017 and program project grant NS-99-004.
Electronic-Database Information
The URL for data in this article is as follows:
- Duke Center for Human Genetics, The, http://wwwchg.mc.duke.edu/ (software for conducting PDT-avg and PDT-sum analyses)
References
- Abecasis GR, Cookson WOC, Cardon LR (2000) Pedigree tests of transmission disequilibrium. Eur J Hum Genet 8:545–551 [DOI] [PubMed] [Google Scholar]
- Martin ER, Kaplan NL, Weir BS (1997) Tests for linkage and association in nuclear families. Am J Hum Genet 61:439–448 [DOI] [PMC free article] [PubMed] [Google Scholar]
- Martin ER, Monks SA, Warren LL, Kaplan NL (2000) A test for linkage and association in general pedigrees: the pedigree disequilibrium test. Am J Hum Genet 67:146–154 [DOI] [PMC free article] [PubMed] [Google Scholar]
- Rabinowitz D, Laird N (2000) A unified approach to adjusting association tests for population admixture with arbitrary pedigree structure and arbitrary missing marker information. Hum Hered 50:211–223 [DOI] [PubMed] [Google Scholar]
- Teng J, Risch N (1999) The relative power of family-based and case-control designs for linkage disequilibrium studies of complex human diseases. II. Individual genotyping. Genome Res 9:234–241 [PubMed] [Google Scholar]