

Abstract
In the present study we propose a multipoint approach, for the mapping of genes, that is based on the case-parent trio design. We first derive an expression for the expected preferential–allele-transmission statistics for transmission, from either parent to an affected child, for an arbitrary location within a chromosomal region demarcated by several genetic markers. No assumption about genetic mechanism is needed in this derivation, beyond the assumption that no more than one disease gene lies in the region framed by the markers. When one builds on this representation, the way in which one may maximize the genetic information from multiple markers becomes obvious. This proposed method differs from the popular transmission/disequilibrium test (TDT) approach for fine mapping, in the following ways: First, in contrast with the TDT approach, all markers contribute information, regardless of whether the parents are heterozygous at any one marker, and incomplete trio data can be utilized in our approach. Second, rather than performing the TDT at each marker separately, we propose a single test statistic that follows a χ2 distribution with 1 df, under the null hypothesis of no linkage or linkage disequilibrium to the region. Third, in the presence of linkage evidence, we offer a means to estimate the location of the disease locus along with its sampling uncertainty. We illustrate the proposed method with data from a family study of asthma, conducted in Barbados.
Introduction
Association studies of candidate genes are commonly conducted in the field of genetic epidemiology, using both case-control and case-parent trio designs. Association studies have also been promoted for fine mapping after chromosomal regions for a disease gene have been identified by linkage analysis (Ott and Hoh 2000). Although either population-based or family-based association studies can be adopted, the latter has the advantage of avoiding the potential problem of population stratification, which can lead to spurious results (e.g., see Falk and Rubinstein 1987; Ott 1989; Spielman et al. 1993; Thomson 1995). More recently, Risch and Merikangas (1996) advocated the use of family-based association studies along with the transmission/disequilibrium test (TDT) (Spielman et al. 1993), for genomewide scans. Under the assumptions of (1) multiplicative models for penetrances of genotypes at a disease locus and (2) that the actual variant of this disease locus is being considered, Risch and Merikangas (1996) showed that this association study/TDT method has more statistical power to detect genes of modest effect than does the conventional affected-sib-pair (ASP) design based on identical by descent (IBD) allele sharing. Comparison between the TDT and ASP test statistics was subsequently extended to more-general situations (e.g., see Camp 1997; McGinnis 1998). Meanwhile, it has been pointed out that the statistical power for genomewide association studies using the TDT depends strongly on the magnitude of the recombination fraction and linkage disequilibrium (LD), the age of the mutant disease allele (e.g., see Xiong and Guo 1998; Tu and Whittemore 1999), parental affected status (Whittaker and Lewis 1998), and evidence of allelic heterogeneity of the disease (Slager et al. 2000).
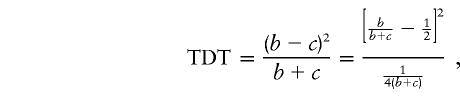
As pointed out by Schaid (1998), many recent publications have been devoted to extending the use of this popular method to more-complex situations. These include the use of the TDT for (1) multiallele markers (e.g., see Sham and Curtis 1995; Terwilliger 1995; Schaid 1996; Spielman and Ewens 1996; Cleves et al. 1997; Kaplan et al. 1997; Lazzeroni and Lange 1998), (2) multiple markers (e.g., see Terwilliger 1995; Lazzeroni and Lange 1998; Clayton and Jones 1999; Zhao et al. 2000), and (3) situations in which parental-genotype information may be absent (e.g., see Boehnke and Langefeld 1998; Horvath and Laird 1998; Schaid and Rowland 1998; Spielman and Ewens 1998; Knapp 1999). It is worth noting that the TDT method and its recent extension are driven by hypothesis testing, since significant TDT results imply both linkage and allelic association (or LD) between the observed marker and the postulated disease gene. In fine-mapping applications, however, a larger TDT result should not be directly interpreted as being indicative of tighter linkage, as is done in some studies (e.g., Whittaker et al. 2000). Rather, a marker with higher heterozygosity for the target allele and, therefore, a larger number of informative parental genotypes (i.e., the number of “discordant” pairs, or b+c in the 2×2 table of Spielman et al. [1993]) may result in a larger TDT value even though it is farther away from the disease locus than is a less informative marker.
In this regard, two parallel approaches for the fine mapping of disease genes, both of which are based on the notion of LD, have been developed recently. One is a likelihood-based approach in which the likelihood function is indexed by LD parameters for a pair of markers (e.g., see Hastbacka et al. 1992; Hill and Weir 1994; Kaplan et al. 1995; Terwilliger 1995; Xiong and Guo 1997; Graham and Thompson 1998; Rannala and Slatkin 1998; Zheng and Elston 1999). The second is a semiparametric approach in which pairwise estimates of LD are regressed on distances between the markers (e.g., see Lazzeroni 1998; Cordell and Elston 1999).
In the present study we propose a new multipoint method for estimating the location of an observed disease gene, τ, when the case-parent trio design (a specific form of family-based association) is adopted. Here “trio design” refers to the situation in which an affected offspring, along with his or her parents, are genotyped for multiple markers. This proposed method is robust in that no assumption about the mode of inheritance is required, other than the assumption that there is no more than one disease gene in the chromosomal region framed by the markers; rather, it builds on a representation of the expectation of a statistic reflecting preferential transmission at arbitrary marker loci in the region. This approach provides a point estimate  and the variance around it, through use of the generalized estimating equation (GEE) method (Liang and Zeger 1986), so that a 95% confidence interval for the location of a disease gene may be calculated.
For illustration, this proposed method is applied to a family study of asthma (Barnes et al. 1996, 1999). Two-point and multipoint linkage analyses of 528 individuals in 33 families have provided evidence of linkage between markers in the chromosome 12q15-q24.1 region and a susceptibility locus for asthma. As is true for many linkage results for complex diseases, however, the region of interest is quite broad (spanning 30–40 cM), and the addition of more markers failed to resolve the location of any single locus controlling risk of asthma, although several candidate genes have been mapped to this region (Barnes et al. 1999).
Preferential-Transmission Statistics
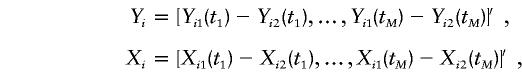
Consider a case-parent trio recruited for an association study in which a chromosomal region, R, is framed by M genotyped markers at 0<t1<t2<,…,<tM<T cM. For simplicity, we assume two alleles per locus. We define the preferential-transmission statistic Y(t), for any arbitrary location t in this region R, as Y(t)=Y1(t)-Y2(t). Here
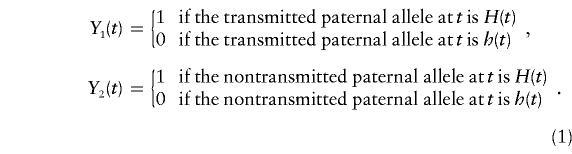 |
In equation (1), H(t) is the target allele at marker t, and h(t) is the nontarget allele. Likewise, one can define the maternal version of this statistic as X(t)=X1(t)-X2(t), accordingly. For simplicity, we shall focus attention on Y(t), but all of the following developments apply completely to X(t). Note that Y(t) takes three possible values: 1, 0, and −1. If the father is heterozygous at marker t—that is, Hh at position t—then Y(T) would be 1 or −1, depending on whether the transmitted allele is H(t) or h(t), respectively; on the other hand, Y(t) is equal to 0 if the father is homozygous—that is, HH or hh—at position t. It is intuitively clear that, when marker t is either unlinked to or in linkage equilibrium with the disease gene located at position τ, Y(t) is, on average, equal to 0, since the observable alleles H(t) and h(t) from the parents have an equal chance of being transmitted to the offspring. It is also interesting to point out that the sum of Y(t)+X(t) across trios simplifies to b-c, the numerator of the original TDT statistic (Spielman et al. 1993). The next representation of Y(t)—and, hence, of X(t)—is critical for the subsequent development. Let Φ denote the event that the sampled offspring is affected; then one has
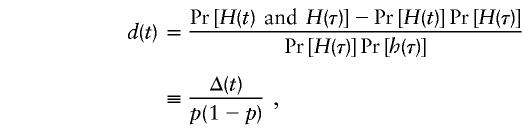
where θt,τ is the recombination fraction between marker locus t and the location (τ) of the postulated disease gene in the region, and
serves as a measure of LD between t and τ. The proof of equation (2) is given in Appendix A, in which the key assumption—that is, that there is no more than one susceptibility gene in region R—is made. As defined earlier, H(τ) and h(τ) represent the high-risk allele and normal allele, respectively, for the disease gene at location τ. Note that d(τ)=1 and that d(t) in equation (3) corresponds to one of the five measures of LD discussed by Devlin and Risch (1995); that is,
 |
which is the difference in probabilities that H(t) will be observed at marker t for those carrying the high-risk allele and normal allele at the disease locus τ. This preferential-transmission statistic, Y(t), is, on average, equal to 0 if marker t is either unlinked to the disease locus (i.e., θt,τ= 1/2) or is in linkage equilibrium with the disease locus (i.e., Δ(t)=0). Furthermore, under the assumptions of initial complete LD, random mating, and constant Pr[H(τ)] over time, d(t) can also be expressed, as has been done elsewhere (Devlin and Risch 1995), as
which has been regarded as a reasonable model with a long history. Here N is the number of generations since the introduction, into the population, of a disease-causing mutation at location τ. Thus, one can express E[Y(t)|Φ] from equation (2) as
 |
Another implicit assumption that must be made for the aforementioned equality to hold is that the population is large and stable in size (e.g., see Hill and Weir 1994; Kaplan et al. 1997; Rannala and Slatkin 1998; Sham 1998). We will discuss the impact of evolutionary variability on equation (4), as well as the proposed method for making inferences about τ, in the Discussion section.
It is clear from equations (3) and (4) that the statistical power of the TDT depends strongly on (1) how tight the linkage between loci t and τ is, θt,τ; (2) the magnitude of LD, Δ(t); (3) the age of the mutant allele—that is, N; (4) the allele frequency of the nontarget allele at locus t—that is, Pr[h(t)|h(τ)]; and (5) the true genetic mechanism, through E[Y(τ)|Φ]. For this last component, table 1 gives, under the conventional Hardy-Weinberg assumption, expressions for C≡E[Y(τ)|Φ], for a variety of single-locus and two-locus models (Risch 1990; Neuman and Rice 1992). In particular, assuming a single-locus model with arbitrary penetrances f0, f1, and f2, for genotypes HH, Hh, and hh at the trait locus, respectively, one has
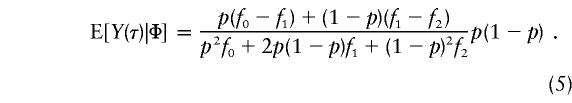 |
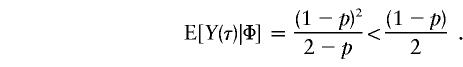
Substitution of equation (5) for E[Y(τ)|Φ] in equation (2) leads to an expression for E[Y(t)|Φ] that can be reproduced from table 3 of Knapp et al. (1993). In the special case of recessive models with complete penetrances—that is, when f0=1 and f1=f2=0 (Ott 1989)—E[Y(τ)|Φ] will reduce to 1-p and
 |
which can also be derived from table II of Ott (1989). On the basis of equation (6), it appears that the statistical power of the TDT is inversely proportional to the difference in that equation, at least for single-locus recessive models. Furthermore, the statistical power for detection of linkage or LD diminishes considerably if this single disease locus is dominant—that is, if f0=f1=1 and f2=0, as in this case:
 |
As shown in table 1, with a few exceptions the statistical power of this approach is reduced for the two-locus models introduced by Risch (1990) and Neuman and Rice (1992), since E[Y(τ)|Φ] is generally smaller for the two-locus models than it is for the single-locus models.
Table 1.
E[Y(τ)|Φ], Derived from Appendix B, for Some Selected Two-Locus Models from Neuman and Rice (1992) and Risch (1990)
| Model | E[Y(τ)|Φ]a |
| Neuman and Rice (1992): | |
| Ep-1 |  |
| E-p-2 | 1-p1 |
| E-p-3 | 1-p1 |
| Ep-4 |  |
| Ep-5 |  |
| Ep-6 |  |
| Het-1 |  |
| Het-2 |  |
| Het-3 |  |
| Risch (1990): | |
| Multiplicative |  |
| Additive |  |
| Heterogeneity |  |
p1=Pr(H1) and p2=Pr(H2); H1and H2 are the disease alleles from loci 1 and 2, respectively.
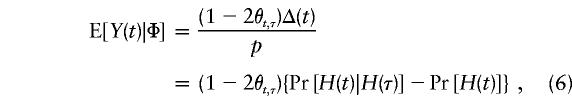
If we return to equation (4), it becomes clear that E[Y(t)|Φ], when considered as a function of t, reaches its peak at E[Y(τ)|Φ]—that is, when t=τ. Thus, when multiple-marker information is available for calculation of these Y values, one is able to estimate the location of τ at the peak value of E[Y(t)|Φ]. This is the main subject of the next section. When the marker is away from the disease locus—that is, when t≠τ—the average of this preferential-transmission statistic, Y(t), diminishes rather quickly. As an illustration, consider, for t≠τ,
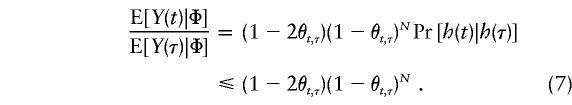 |
Therefore, for θt,τ=.01—that is, when marker t is 1 cM away from τ—E[Y(t)|Φ] is <59% of E[Y(τ)|Φ] if the mutation occurred N≈50 generations ago. This ratio in equation (7) drops to <7.0% if marker t is 5 cM away from τ—that is, if θt,τ=.05. Two implications of this observation are worth noting. First, from the hypothesis-testing viewpoint, the statistical power of the TDT will be severely compromised when marker t is well away from disease locus τ (e.g., see Terwilliger and Ott 1992; Xiong and Guo 1998; Tu and Whittemore 1999); on the other hand, from the viewpoint of estimation of τ, such a sharp drop in E[Y(t)|Φ] relative to E[Y(τ)|Φ] provides an excellent opportunity to differentiate τ from nearby markers. Our proposed method, presented in the next section, capitalizes on this sharp decline in E[Y(t)|Φ] from t=τ, since our focus is on estimating the location of the postulated disease locus τ. However, one complication associated with the use of equation (4) is that E[Y(t)|Φ] is not necessarily a decreasing function in |t-τ|, since Pr[h(t)|h(τ)] may not be monotonic. Figures 1 and 2 show plots of E[Y(t)|Φ] versus t, for some selected values of N and C≡E[Y(τ)|Φ]. In figure 1, we assume that Pr[h(t)|h(τ)]=1.0-.01×|t-τ|, the value of which is decreasing in |t-τ|. In this case, E[Y(t)|Φ] decreases with |t-τ|, and the magnitude of N appears to have a stronger impact, compared with C, on how sharply E[Y(t)|Φ] declines. In figure 2, we assume, instead, that Pr[h(t)|h(τ)] is random and that it follows a uniform distribution over (.5, 1). In this more realistic case, the predicted curves are not as smooth, and they fluctuate wildly before eventually approaching 0 as t moves away from τ. Nevertheless, it is important to reiterate that the peak of E[Y(t)|Φ] is always attained at t=τ. Furthermore, when equation (4) is divided by Pr[h(t)|h(τ)], we see that E[Y(t)|Φ]/ Pr[h(t)|h(τ) ] = (1-2θt,τ)(1-θt,τ)NC, which does decrease with |t-τ|, and both quantities in this ratio can be estimated consistently as long as sufficient trios are available.
Figure 1.

Plots of E[Y(t)|Φ] versus t, for 0⩽t⩽80 cM, where τ=45 cM and Pr[h(t)|h(τ)] is assumed to be equal to 1.0-.01 × |t-τ|. a, N=10 with different values of C=E[Y(τ)|Φ]; b, C=.5 with different values of N.
Figure 2.

Plots of E[Y(t)|Φ] versus t, for 0⩽t⩽80 cM, where τ=45 cM and Pr[h(t)|h(τ)] is generated from a uniform distribution over (.5, 1.0). a, N=10 with different values of C; b, C=.5 with different values of N.
The Proposed Method
Consider a situation in which n independent case-parent trios are sampled and the paternal and maternal preferential-transmission statistics—Yi(tj) and Xi(tj), respectively—are computed at each of M markers located at t1<t2<,…,<tM, i=1,…,n. Recall from equation (4) that
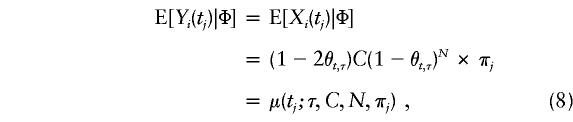 |
where C=E[Y(τ)|Φ]=E[X(τ)|Φ] and πj = Pr[h(tj)|h(τ)], j=1,…,M. Therefore, the averaged preferential-transmission statistics at location tj are indexed by δ=(τ, C, N) and by πj, which is the probability that the nontarget allele will be carried at marker tj, given the normal allele at the disease locus. One can replace πj in equation (8) with  , based either on current knowledge derived from previous work or on the data at hand; for instance,
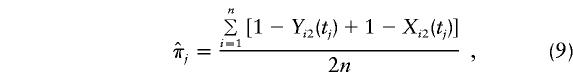 |
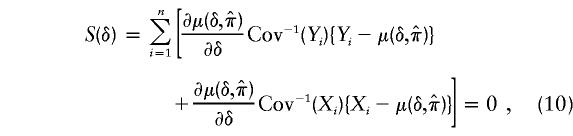
which is the proportion of nontransmitted parental alleles that carry h(tj). This estimator, which is similar to that proposed by Lazzeroni (1998), is valid for an autosomal dominant mechanism when the disease is rare. The remaining question is how to estimate δ=(τ, C, N)—in particular, τ—given that one observes, for each trio, paternal and maternal preferential-transmission statistics at each of the M locations in chromosomal region R. One approach is to estimate δ by solving
 |
where
 |
and
This generalized–estimating-equation (GEE) approach was originally proposed by Liang and Zeger (1986) for the analysis of longitudinal data in which repeated observations of primary-response variables are measured over time for each subject. This approach recently has been applied to multipoint linkage analysis of sib pairs, for qualitative traits (Liang et al. 2001) and for quantitative traits (Liang et al. 2000). This GEE method may be viewed as an extension of the conventional method of moments, since it incorporates the empirical and theoretical first moments of primary statistics (Yi and Xi, in this case). It has the desired property that the derived estimates of δ and their estimated standard errors (SEs) remain valid as long as equation (8) holds up. One minor modification is needed, since μ(tj) in equation (8) is not differentiable with respect to τ, since it involves |tj-τ|, the absolute value (for detailed discussion on how this modification takes place, see the study by Liang et al. [2001]).
One interesting feature of this approach is that one can test the null hypothesis—of no linkage or LD to the region framed by the observed M markers—by testing C≡0. In contrast to the situation when the TDT is performed separately for each marker, the statistical power for detection of linkage or LD should be enhanced when all marker information from the framed region is used simultaneously, through modeling, in equation (4). In addition, instead of assuming that E[Y(τ)|Φ]=E[X(τ)|Φ]≡C, one could test the hypothesis of, for example, equal parental transmission, by allowing these two quantities to be different and to be compared empirically.
This proposed approach is flexible in that it accommodates situations in which genetic information is available from only one parent or in which more than one affected offspring are recruited from the same family. For the latter case, each affected offspring contributes separately to equation (10). The GEE method provides valid standard-error estimates of  , the value of which is estimated in equation (10), while acknowledging that contributions from both parents and from affected siblings are not statistically independent of each other. These standard-error estimates of
  are, however, subject to modification because of the complication that the πj values, for j=1,…,M in equation (8) are unknown and need to be estimated by, for example,
  in equation (9). Without proper modification, this would lead to underestimation of the SE in
  . Such a modification, which is given in Appendix B, has been implemented in our statistical software, which, when it is complete, will be available from the author.
Finally, we note that use of the TDT may be invalid if more than one case-parent trio from a family contributes to the computation of these TDT statistics. This, however, can be modified by considering, for each marker (e.g., see Martin et al. 2000),
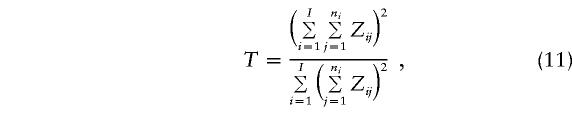 |
where I is the number of families ascertained, ni is the number of observed allele transmissions, Z=Y(X) for paternal (or maternal) transmission, and i=1,…,I. One can refer T to a χ2 distribution with 1 df, when I is sufficiently large.
An Illustrative Example
To illustrate how this proposed method may be applied to multipoint family-based association studies, we have applied it to a family study of asthma in Barbados (Barnes et al. 1999). In this study, 507 subjects (8 nuclear and 25 extended pedigrees) were recruited in Barbados (the study was originally described by Barnes et al. [1996]). Nuclear families were selected through an asthmatic proband. Patients with asthma were selected systematically, from either the Accident and Emergency Department at the Queen Elizabeth Hospital or from private-practice clinics, on the basis of the following inclusion criteria: (1) patient age >6 years, (2) diagnosis, by a physician, of current asthma, and (3) availability of both parents or, in the case of a missing parent, siblings (to infer the genotype of a missing parent). Every effort was made to include all nuclear-family members, and pedigrees were extended beyond the nuclear family whenever possible and included all extended relatives who were willing to participate over a recruitment period of 3 years (1993–96). Twenty-two polymorphic microsatellite markers spanning a region of ∼80 cM on 12q13.12-q.23.3 (D12S390–D12S360) were typed for all subjects with available DNA, as described elsewhere (Barnes et al. 1996). All participants gave their informed consent as approved by the Johns Hopkins University institutional review board. This study population provided 131 case-parent trios from 33 families; 45 of the trios are missing either paternal or maternal genotypic information; for details on these trios, see table 2.
Table 2.
Frequencies of Trios per Family in the Family Study of Asthma (Barnes et al. 1996), Stratified by Availability of Parental Marker Information
|
Parental Marker Information |
||||
| No. of Triosper Family | No. of Families | BothAvailable | MaternalOnly | PaternalOnly |
| 1 | 2 | 0 | 2 | 0 |
| 2 | 7 | 11 | 3 | 0 |
| 3 | 9 | 21 | 6 | 0 |
| 4 | 3 | 7 | 5 | 0 |
| 5 | 4 | 13 | 6 | 1 |
| 6 | 3 | 12 | 5 | 1 |
| 7 | 2 | 9 | 5 | 0 |
| 8 | 3 | 13 | 11 | 0 |
| Total | 33 | 86 | 43 | 2 |
Figure 3 shows the TDT values for each of 22 markers spanning 80 cM along this region of chromosome 12. For markers with more than two alleles and without a targeted allele specified a priori, we report the maximum TDT values when other alleles are combined. We note that such an approach to the identification of the target alleles does not compensate for the multiple comparisons. This TDT curve, shown in figure 3, appears bimodal, with local peaks at markers 8 (D12S1598) and 19 (PAH). A tempting question is whether such local peaks would necessarily lead to a consistent estimate of the location of the unobserved disease locus τ. Recall that
 |
where b+c is the number of heterozygous parental genotypes that vary across markers (because of varying allele frequencies). Figure 4 shows that (b+c) values vary vastly, in a range of 20–100, for these 22 markers on chromosome 12. Thus, one should use caution when interpreting, from the fine-mapping perspective, the TDT curve shown in figure 3. The dotted line in figure 3 gives the T curve calculated by equation (11). There is a substantial drop in test-statistic values (especially for markers 8 and 19), reflecting the nontrivial effect due to the lack of statistical independence among affected siblings from a single mating.
Figure 3.

TDT values for the 22 markers on chromosome 12 from the family study of asthma (Barnes et al. 1996). The solid line (—) denotes the conventional TDT; the dashed line (- - -) denotes the modified TDT.
Figure 4.

Number of allele transmissions from heterozygous parents, for the 22 markers on chromosome 12 from the family study of asthma (Barnes et al. 1996).
To avoid the concern of varying (b+c) values across markers, figure 5 shows the empirical version of μ(tj)=E[Y(tj)|Φ],j=1,…,M; that is,
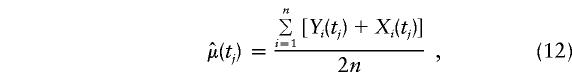 |
and of the ratio  , where
  is defined in equation (9) and given in figure 6. Note that, unlike conventional TDT statistics, equation (12) uses all available marker data, regardless of whether the parental genotypes are heterozygous. Furthermore, this empirical version of μ(tj)/πj—that is, μ(tj)/πj=(1-2θt,τ)C×(1-θt,τ)N—suggests that it does decrease with |t-τ| through the subregions framed by markers 6–12 and 18–22. Taking into account the previous evidence for linkage in the neighborhood of marker 7, we applied the GEE method by fitting the model in equation (4) to the preferential-transmission statistics for markers 6–12. The results in table 3 suggest strong evidence of linkage and LD in this 18-cM subregion (
 with P=.005). This is to be contrasted with the peak individual TDT value of 5.24 (P=.022) at marker 9 (D12S1667) in this subregion. Furthermore, the postulated disease locus for asthma is estimated to be located at
  , with a 95% confidence interval of 35.93–41.49 (see fitted curve in fig. 5). It is worth noting that, in general, more-dense maps (with markers <3–4 cM apart) may be needed for LD mapping.
Figure 5.

Empirical and fitted values for the expected preferential-transmission statistics for the 22 markers on chromosome 12 from the family study of asthma (Barnes et al. 1996). The solid line (—) denotes the empirical E(Y(t)|Φ); the dashed line (- - -) denotes the empirical E[Y(t)|Φ]/Pr[h(t)|h(τ)]; the dotted line (⋅⋅⋅) denotes the fitted E[Y(t)|Φ]/Pr[h(t)|h(τ)].
Figure 6.

Estimated Pr[h(t)|h(τ)] for the 22 markers on chromosome 12 from the family study of asthma (Barnes et al. 1996)
Table 3.
Estimates and SEs of τ, C, and N, for the Family Study of Asthma (Barnes et al. 1996)
| Parameter | Estimate ± SE |
| Location of disease locus (τ) | 38.71 ± 1.417 |
| Averaged preferential transmission at τ (C) | .221 ± .078 |
| Number of generations since mutation (N) | 14.16 ± 8.673 |
Discussion
Family-based association studies using the TDT to test for linkage and LD have drawn a great deal of attention lately. This approach recently has been advocated for genomewide searches (Risch and Merikangas 1996), rather than simply as a tool for detection of associations with candidate genes. Recent work by many researchers has extended this approach to more-general settings for practical usage. The rapid development of molecular technology for single-nucleotide polymorphisms (SNP) should further encourage adoption of this design for future genetic studies of complex diseases, because dense maps should become more easily available.
In the present study, we propose a multipoint fine-mapping approach that is suitable for the case-parent trio design. Through modeling, as presented in equations (2) and (4), this approach provides a method that, for the testing of linkage and LD, is potentially more powerful than what is available with individual TDT using one marker at a time. In addition, it provides an estimate of the location of the postulated disease gene,  , along with its SE. Another feature of the proposed method is that it utilizes the marker data from all trios, regardless of whether the parental genotypes are heterozygous. This is in contrast to the conventional TDT approach, in which only trios with heterozygous parents are informative for testing the null hypothesis of no linkage or no LD. In addition, it accommodates practical situations in which there may be more than one affected offspring observed from a single mating or in which some parental genetic information is unavailable.
An important assumption required if equation (4) is to be valid is that the population is large and stable in size, so that no evolutionary variability exists. Several authors (e.g., Hill and Weir 1994; Kaplan et al. 1997; Rannala and Slatkin 1998) have argued that this variability must be taken into account. In Appendix C, we show that, in the presence of evolutionary variability, equation (4) is modified as follows: E[Y(t)|Φ] = (1-2θt,τ)E[Y(τ)|Φ]αN(1-θt,τ)Nπ(t), where αN is the proportion of H(τ), in generation N, that is descended from the founder population. Therefore, C≡E[Y(τ)|Φ] and αN are confounded with each other in such a way that only C⋆=C×αN is estimable from the data at hand. Since αN is <1 unless the population is large and stable in size, both the statistical power for detection of linkage and LD and the statistical precision for estimation of τ are compromised. Given that C⋆ appears in E[Y(t)|Φ] as a proportional factor, our method ensures that  is consistent in its estimation of τ, the location of a disease locus in the target region. However, since the proposed method is based on samples from the current population, the SE of
  and the corresponding 95% confidence interval for τ are likely to be smaller than they should be, since our method fails to take into account the variation, in population allele frequency, caused by evolution.
Previously (Barnes et al. 1999), we have observed significant evidence of linkage over a very large region (∼40 cM) of chromosome 12q. However, linkage analysis is dependent on informative matings, and it can be difficult, in any one set of families, for complex diseases such as asthma, to narrow the regions of interest. Interestingly, the best evidence for linkage in the Barbados data set (Barnes et al. 1999) is in precisely the same subregion reported for linkage and LD in the present study, confirming our prior report. Previous TDT analyses of individual markers in this data set resulted in modest P values for several of the markers, with the best evidence for linkage at D12S95 (Barnes et al. 1996), a locus some distance from the region of strongest evidence of linkage determined by other methods (Barnes et al. 1999).
Application of the proposed method to a family study of asthma illustrates how this method can be used for fine mapping after prior evidence of linkage has been seen, but the method is also applicable to general studies of candidate genes or even genomewide scans. In the context of this family study of asthma, multiplex families ascertained through affected sibs provided a number of nonindependent trios for analysis. Some trios involved double counting of both parents (e.g., two trios from an affected sib pair), some involved double counting of only one parent (e.g., two trios involving an affected half-sib pair), and some trios had one parent with no genotype data available. The weighting of trios drawn from a single nuclear family, as shown in equation (11), adjusts for the lack of independence among trios, which (as demonstrated in fig. 3) can lead to inflated TDT values when each marker is considered individually. The utility of our approach for fine mapping arises from both the estimated map location provided and its accompanying confidence intervals. This can be quite useful in the narrowing of chromosome regions where linkage has been identified in a previous analysis. For many studies of complex diseases, multipoint linkage analysis yields positive results over fairly large chromosomal regions. Frequently, addition of markers does not narrow the region of interest sufficiently to make detailed molecular studies feasible, since regions of 10–20 cM often contain too many individual genes over too great a physical distance to permit direct identification of a causal gene. This multipoint approach to mapping, based on case-parent trios drawn from multiplex families, allows a higher degree of resolution and better establishes the key region for physical mapping.
Acknowledgments
This work is supported, in part, by National Institutes of Health grant GM49909. We thank the following individuals for their contribution to the Barbados study: Raana P. Naidu, Paul N. Levett, Renate Nickel, Linda Freidhoff, Maria Stockton, Rasika Mathias, and Xielun Xue. We wish to thank the families in Barbados for their generous participation in this study. We also thank the staff of the Leptospira Laboratory, Barbados, for their technical support, and the Ministry of Health, Barbados, for permission to conduct this study in Barbados. Finally, we acknowledge the helpful comments, from the two reviewers and from Dr. M. Danielle Fallin, which improved the quality of this work.
Appendix A: Proof of Equation (2)
Let (g1, g2) denote the paternal (g1) and maternal (g2) haplotypes for the father of an affected offspring at loci t and τ. Thus, [H(t)H(τ), H(t)h(τ)], for example, represents 1 of 10 such possible combinations at loci t and τ. For the paternal preferential-transmission statistic at location t—that is, Y(t)—one has
 |
where b(g1,g2)=Pr[Y1(τ)=1|g1,g2,Φ], which is the conditional probability that the transmitted allele at disease locus τ is H(τ). With the exceptions of g⋆=[H(t)h(τ), h(t)H(τ)] and g⋆⋆=[H(t)H(τ), h(t)h(τ)], it easily can be shown that the terms within the bracket of (A1) cancel each other out. Consequently,
 |
Here, under the assumption that there is no locus other than the disease locus in the region R, we have
which leads to equation (A2). Furthermore, under the same assumption mentioned above, one has
and, hence,
 |
Consequently,
and this completes the proof.
Appendix B: Incorporation of Uncertainty in the Estimation of πj
To account for the uncertainty due to the need to estimate the πj values for j=1,…,M, one can simultaneously estimate δ=(τ,C,N) and π=(π1,…,πM) by solving
 |
where 1 is a M×1 vector of ones, and
 |
By solving S1 and S2 simultaneously, one can derive an estimate, of the SE of  , that takes into account the uncertainty in
  ; for detailed derivations, see, for example, reports by Prentice (1988) and Liang et al. (1992).
Appendix C: Impact of Evolutionary Variability on Equation (4)
Define ΔN(t)≡PN[H(t) and H(τ)]-PN[H(t)]PN[H(τ)], the basic measure of LD at generation N. Acknowledging that αN—that is, the proportion of H(τ), in generation N, that are descended from the founder disease allele—varies across generations, because of evolutionary variability (e.g., fresh mutation and change in population size), Sham (1998) showed that
One has
 |
under the assumption of constant disease-allele frequency from generation to generation. Thus, unless αN=1, which would be the case when the population size is sufficiently large, E(Y(t)|Φ) has the form of
where C⋆=E[Y(τ)|Φ]×αN. Since C⋆<C≡E[Y(τ)|Φ], both the statistical power for detection of linkage and LD and the statistical precision for estimation of τ are compromised.
References
- Barnes KC, Freidhoff LR, Nickel R, Chiu YF, Juo SH, Hizawa N, Raana P, Naidu MD, Ehrlich MS, Duffy D, Schou C, Levett PN, Marsh DG, Beaty TH (1999) Dense mapping of chromosome 12q13.12-q23.3 and linkage to asthma and atopy. J Allergy Clin Immunol 104:485–491 [DOI] [PubMed] [Google Scholar]
- Barnes KC, Neely JD, Duffy DL, Freidhoff LR, Breazeale DR, Schou C, Naidu RP, Levett PN, Renault B, Kucherlapati R, Iozzino S, Ehrlich E, Beaty TH, Marsh DG (1996) Linkage of asthma and total serum IgE concentration to markers on chromosome 12q: evidence from Afro-Caribbean and Caucasian populations. Genomics 37:41–50 [DOI] [PubMed] [Google Scholar]
- Boehnke M, Langefeld CD (1998) Genetic association mapping based on discordant sib pairs: the discordant-alleles test. Am J Hum Genet 62:950–961 [DOI] [PMC free article] [PubMed] [Google Scholar]
- Camp NJ (1997) Genomewide transmission/disequilibrium testing—consideration of the genotypic relative risks at disease loci. Am J Hum Genet 61:1424–1430 [DOI] [PMC free article] [PubMed] [Google Scholar]
- Clayton D, Jones H (1999) Transmission/disequilibrium tests for extended marker haplotypes. Am J Hum Genet 65:1161–1169 [DOI] [PMC free article] [PubMed] [Google Scholar]
- Cleves MA, Olson JM, Jacobs KB (1997) Exact transmission-disequilibrium tests with multiallelic markers. Genet Epidemiol 14:337–347 [DOI] [PubMed] [Google Scholar]
- Cordell HJ, Elston RC (1999) Fieller’s theorem and linkage disequilibrium mapping. Genet Epidemiol 17:237–252 [DOI] [PubMed] [Google Scholar]
- Devlin B, Risch N (1995) A comparison of linkage disequilibrium measures for fine-scale mapping. Genomics 29:311–322 [DOI] [PubMed] [Google Scholar]
- Falk CT, Rubinstein P (1987) Haplotype relative risks: an easy reliable way to construct a proper control sample for risk calculations. Ann Hum Genet 51:227–233 [DOI] [PubMed] [Google Scholar]
- Graham J, Thompson EA (1998) Disequilibrium likelihoods for fine-scale mapping of a rare allele. Am J Hum Genet 63:1517–1530 [DOI] [PMC free article] [PubMed] [Google Scholar]
- Hastbacka J, de la Chapelle A, Kaitila I, Sistonen P, Weaver A, Lander E (1992) Linkage disequilibrium mapping in isolated founder populations: diastrophic dysplasia in Finland. Nat Genet 2:204–211 [DOI] [PubMed] [Google Scholar]
- Hill WG, Weir BS (1994) Maximum-likelihood estimation of gene location by linkage disequilibrium. Am J Hum Genet 54:705–714 [PMC free article] [PubMed] [Google Scholar]
- Horvath S, Laird NM (1998) A discordant-sibship test for disequilibrium and linkage: no need for parental data. Am J Hum Genet 63:1886–1897 [DOI] [PMC free article] [PubMed] [Google Scholar]
- Kaplan NL, Hill WG, Weir BS (1995) Likelihood methods for locating disease genes in nonequilibrium populations. Am J Hum Genet 56:18–32 [PMC free article] [PubMed] [Google Scholar]
- Kaplan NL, Martin ER, Weir BS (1997) Power studies for the transmission/disequilibrium tests with multiple alleles. Am J Hum Genet 60:691–702 [PMC free article] [PubMed] [Google Scholar]
- Knapp M (1999) A note on power approximations for the transmission/disequilibrium test. Am J Hum Genet 64:1177–1185 [DOI] [PMC free article] [PubMed] [Google Scholar]
- Knapp M, Seuchter SA, Baur MP (1993) The haplotype-relative-risk (HRR) method for analysis of association in nuclear families. Am J Hum Genet 52:1085–1093 [PMC free article] [PubMed] [Google Scholar]
- Lazzeroni LC (1998) Linkage disequilibrium and gene mapping: an empirical least-squares approach. Am J Hum Genet 62:159–170 [DOI] [PMC free article] [PubMed] [Google Scholar]
- Lazzeroni LC, Lange K (1998) A conditional inference framework for extending the transmission/disequilibrium test. Hum Hered 48:67–81 [DOI] [PubMed] [Google Scholar]
- Liang K-Y, Chiu YF, Beaty TH (2001) A robust identity by descent procedure using affected sib pairs: multipoint mapping for complex diseases. Hum Hered 51:64–78 [DOI] [PubMed] [Google Scholar]
- Liang K-Y, Huang C-Y, Beaty TH (2000) A unified sampling approach for multipoint analysis of qualitative and quantitative traits in sib pairs. Am J Hum Genet 66:1631–1641 [DOI] [PMC free article] [PubMed] [Google Scholar]
- Liang K-Y, Zeger SL (1986) Longitudinal data analysis using generalized linear models. Biometrika 73:13–22 [Google Scholar]
- Liang K-Y, Zeger SL, Qaqish B (1992) Multivariate regression analysis for categorical data. J R Stat Soc ser B54:3–40 [Google Scholar]
- Martin ER, Monks SA, Warren LL, Kaplan NL (2000) A test for linkage and association in general pedigrees: the pedigree disequilibrium test. Am J Hum Genet 67:146–154 [DOI] [PMC free article] [PubMed] [Google Scholar]
- McGinnis RE (1998) Hidden linkage: a comparison of the affected sib pair (ASP) test and transmission/disequilibrium test (TDT). Ann Hum Genet 62:159–179 [DOI] [PubMed] [Google Scholar]
- Neuman RJ, Rice JP (1992) Two-locus models of disease. Genet Epidemiol 9:347–365 [DOI] [PubMed] [Google Scholar]
- Ott J (1989) Statistical properties of the haplotype relative risk. Genet Epidemiol 6:127–130 [DOI] [PubMed] [Google Scholar]
- Ott J, Hoh J (2000) Statistical approaches to gene mapping. Am J Hum Genet 67:289–294 [DOI] [PMC free article] [PubMed] [Google Scholar]
- Prentice RL (1988) Correlated binary regression with covariates specific to each binary observation. Biometrics 44:1033–1048 [PubMed] [Google Scholar]
- Rannala B, Slatkin M (1998) Likelihood analysis of disequilibrium mapping, and related problems. Am J Hum Genet 62:459–473 [DOI] [PMC free article] [PubMed] [Google Scholar]
- Risch N (1990) Linkage strategies for genetically complex traits. I. Multilocus models. Am J Hum Genet 46:222–228 [PMC free article] [PubMed] [Google Scholar]
- Risch N, Merikangas K (1996) The future of genetic studies of complex human diseases. Science 273:1516–1517 [DOI] [PubMed] [Google Scholar]
- Schaid DJ (1996) General score tests for associations of genetic markers with disease using cases and their parents. Genet Epidemiol 13:423–449 [DOI] [PubMed] [Google Scholar]
- ——— (1998) Transmission disequilibrium, family controls, and great expectations. Am J Hum Genet 63:935–941 [DOI] [PMC free article] [PubMed] [Google Scholar]
- Schaid DJ, Rowland C (1998) Use of parents, sibs, and unrelated controls for detection of associations between genetic markers and disease. Am J Hum Genet 63:1492–1506 [DOI] [PMC free article] [PubMed] [Google Scholar]
- Sham P (1998) Statistics in human genetics. London: Arnold [Google Scholar]
- Sham P, Curtis D (1995) An extended transmission/disequilibrium test (TDT) for multi-allele marker loci. Ann Hum Genet 59:323–336 [DOI] [PubMed] [Google Scholar]
- Slager SL, Huang J, Vieland VJ (2000) Effect of allelic heterogeneity on the power of the transmission disequilibrium test. Genet Epidemiol 18:143–156 [DOI] [PubMed] [Google Scholar]
- Spielman RS, Ewens WJ (1996) The TDT and other family-based tests for linkage disequilibrium and association. Am J Hum Genet 59:983–989 [PMC free article] [PubMed] [Google Scholar]
- ——— (1998) A sibship test for linkage in the presence of association: the sib transmission/disequilibrium test. Am J Hum Genet 62:450–458 [DOI] [PMC free article] [PubMed] [Google Scholar]
- Spielman RS, McGinnis RE, Ewens WJ (1993) Transmission test for linkage disequilibrium: the insulin gene region and insulin-dependent diabetes mellitus (IDDM). Am J Hum Genet 52:506–516 [PMC free article] [PubMed] [Google Scholar]
- Terwilliger JD (1995) A powerful likelihood method for the analysis of linkage disequilibrium between trait loci and one or more polymorphic marker loci. Am J Hum Genet 56:777–787 [PMC free article] [PubMed] [Google Scholar]
- Terwilliger JD, Ott J (1992) A haplotype-based haplotype relative risk approach to detecting allelic associations. Hum Hered 42:337–346 [DOI] [PubMed] [Google Scholar]
- Thomson G (1995) Mapping disease genes: family-based association studies. Am J Hum Genet 57:487–498 [PMC free article] [PubMed] [Google Scholar]
- Tu I-P, Whittemore AS (1999) Power of association and linkage tests when the disease alleles are unobserved. Am J Hum Genet 64:641–649 [DOI] [PMC free article] [PubMed] [Google Scholar]
- Whittaker JC, Denham MC, Morris AP (2000) The problems of using the transmission/disequilibrium test to infer tight linkage. Am J Hum Genet 67:523–526 [DOI] [PMC free article] [PubMed] [Google Scholar]
- Whittaker JC, Lewis CM (1998) The effect of family structure on linkage tests using allelic association. Am J Hum Genet 63:889–897 [DOI] [PMC free article] [PubMed] [Google Scholar]
- Xiong M, Guo S-W (1997) Fine-scale genetic mapping based on linkage disequilibrium: theory and applications. Am J Hum Genet 60:1513–1531 [DOI] [PMC free article] [PubMed] [Google Scholar]
- ——— (1998) The power of linkage detection by the transmission/disequilibrium tests. Hum Hered 48:295–312 [DOI] [PubMed] [Google Scholar]
- Zhao H, Zhang S, Merikangas KR, Trixler M, Wildenauer DB, Sun F, Kidd KK (2000) Transmission/disequilibrium tests using multiple tightly linked markers. Am J Hum Genet 67:936–946 [DOI] [PMC free article] [PubMed] [Google Scholar]
- Zheng C, Elston RC (1999) Multipoint linkage disequilibrium mapping with particular reference to the African-American population. Genet Epidemiol 17:79–101 [DOI] [PubMed] [Google Scholar]