Abstract
Infection of mice with Salmonella enterica serotype Typhimurium induces a strong Th1 cell response that is central for the control of infection. We infected mice of a resistant background with a virulent strain of S. enterica serovar Typhimurium and analyzed the kinetics and magnitude of the T-cell response. After infection, the majority of CD4+ and CD8+ splenocytes acquired an activated phenotype, as indicated by expression levels of CD44 and CD62L. In addition, after 3 to 4 weeks of infection, more than 20% of the CD4+ and more than 30% of the CD8+ T cells produced gamma interferon (IFN-γ) in response to short-term polyclonal stimulation. In contrast, we detected only a moderate (two- to threefold) expansion of both T-cell populations, and BrdU incorporation revealed that there was either no or only a limited increase in the in vivo proliferation of CD4+ and CD8+ T cells, respectively. Our results indicate that although an unexpectedly large population of both CD4+ and CD8+ T cells is activated and acquires the potential to secrete IFN-γ, this activation is not paralleled by substantial expansion of these T-cell populations.
Infection of mice with Salmonella enterica serotype Typhimurium results in murine typhoid fever. Symptoms and disease progression observed in infected mice closely resemble those observed during human typhoid fever, caused by the related S. enterica serotype Typhi (5, 10). Infection of mice with S. enterica serovar Typhimurium is therefore widely accepted as a valuable experimental model for human typhoid fever.
After oral intake, S. enterica serovar Typhimurium rapidly crosses the intestinal mucosa and penetrates into deeper tissues, mainly spleen and liver. In these organs, S. enterica serovar Typhimurium infects a variety of cells, including macrophages and hepatocytes, in which it survives and replicates (5, 10). The initial phase of systemic infection is characterized by massive bacterial replication leading to high bacterial loads in spleen and liver. After a few days, the host organism begins to restrict bacterial replication, and a plateau phase with constant high levels of bacteria follows. This phase can last from several days to a few weeks (10). Eventually, mechanisms of the acquired immune system develop which ultimately control and eradicate the bacteria and give rise to protection against reinfection (13).
CD4+ T cells are of particular importance for the acquired immune response against S. enterica serovar Typhimurium. When infected with attenuated strains of S. enterica serovar Typhimurium, mice deficient in CD4+ T cells (major histocompatibility complex class II-deficient mice) and mice in which CD4+ T cells have been depleted by antibody treatment have a reduced ability to clear bacteria. In vaccinated mice, depletion of CD4+ T cells reduces resistance against challenge infection, and transfer of CD4+ T cells from vaccinated mice results in partial protection of recipients (6, 11, 15, 17). S. enterica serovar Typhimurium induces a strong T-helper 1 (Th1) response that is responsible for the CD4+-T-cell-mediated protection (13). Th1 cell-derived cytokines, such as gamma interferon (IFN-γ) and tumor necrosis factor alpha, activate bactericidal mechanisms in macrophages and markedly improve the capacity of these cells to kill S. enterica serovar Typhimurium. Additional functions of CD4+ T cells include help for B cells to produce antibodies, help for the generation of salmonella-specific CD8+ T cells and organization of granuloma formation to restrict bacterial spreading (13).
There is also evidence suggesting that CD8+ T cells participate in immunity against S. enterica serovar Typhimurium. Although mice deficient in CD8+ T cells (β2m−/− mice) or mice in which CD8+ T cells have been antibody depleted are only marginally impaired in their response against attenuated strains of S. enterica serovar Typhimurium, vaccine-induced protection against infection with wild-type strains of S. enterica serovar Typhimurium was significantly reduced in these mice (6, 7, 11, 15). The mechanisms by which CD8+ T cells control S. enterica serovar Typhimurium infection are less well understood. Cytotoxic CD8+ T cells could lyse infected cells and thereby render S. enterica serovar Typhimurium accessible to activated phagocytes or bactericidal molecules such as granulysin (18). Similar to CD4+ T cells, CD8+ T cells can produce cytokines necessary for the recruitment and activation of phagocytes.
Here we analyzed the kinetic and magnitude of the T-cell response during S. enterica serovar Typhimurium infection. We observed that the majority of both CD4+ and CD8+ splenocytes acquired an activated phenotype and a large fraction of both T-cell populations produced IFN-γ after short-term polyclonal stimulation. In contrast to the high frequencies of activated T cells, there was only a moderate expansion of the CD4+ and CD8+ T-cell populations and we could not detect a significant increase in the in vivo proliferation of T cells during S. enterica serovar Typhimurium infection.
MATERIALS AND METHODS
Bacterial infection of mice.
(C57BL/6 × Sv129)F1 mice were bred in our facility at the Federal Institute for Health Protection of Consumers and Veterinary Medicine in Berlin, Germany, and experiments were conducted according to the German animal protection law. SL1344, a wild-type strain of S. enterica serovar Typhimurium, was grown overnight in Luria-Bertani (LB) medium, washed twice in phosphate-buffered saline (PBS), frozen, and stored at −80°C. Aliquots were thawed, and bacterial titers were determined by plating serial dilutions on LB agar plates. For infection, aliquots were thawed and appropriately diluted in PBS. Bacteria were injected in a volume of 200 μl of PBS into the lateral tail veins of 6- to 8-week-old female mice. For determination of bacterial burdens in organs, mice were killed at various time points. Livers and spleens were homogenized in PBS, serial dilutions of homogenates were plated on LB agar plates, and colonies were counted after overnight incubation at 37°C.
Antibodies.
Rat immunoglobulin G (IgG) antibodies, anti-CD16/CD32 monoclonal antibody (MAb) (clone 2.4G2), anti-IFN-γ MAb (clone R4-6A2, rat IgG1), anti-CD4 MAb (clone YTS191.1), and anti-CD8 MAb (clone YTS169) were purified from rat serum or hybridoma supernatants with protein G Sepharose and conjugated to fluorescein isothiocyanate (FITC) according to standard protocols or to Cy5 by using a commercial kit (Amersham, Freiburg, Germany). FITC-conjugated anti-CD44 MAb (clone IM7.8.1), FITC-conjugated anti-CD62L MAb (clone MEL-14), and Tri-Color (TC)-conjugated anti-CD4 MAb (clone CT-CD4) were purchased from Caltag, Burlingame, Calif., and FITC-conjugated isotype control MAb (clone R3-34, rat IgG1), FITC-conjugated antibromodeoxyuridine (anti-BrdU) MAb, and the corresponding FITC-conjugated control MAb were from Pharmingen, San Diego, Calif.
Flow-cytometric analysis of spleen cells.
Single-cell suspensions were obtained by passing spleens through stainless steel meshes followed by erythrocyte lysis. Cells (106) were incubated at room temperature with rat IgG antibodies and anti-CD16/CD32 MAb to block unspecific antibody binding. After 10 min, cells were stained with FITC-conjugated anti-CD44 MAb, FITC-conjugated anti-CD62L MAb, TC-conjugated anti-CD4 MAb, or Cy5-conjugated anti-CD8 MAb. After 30 min on ice, cells were washed and analyzed with a FACSCalibur and CellQuest software (Becton Dickinson, Mountain View, Calif.).
In vitro restimulation and intracellular cytokine staining.
Spleen cells were diluted in RPMI medium supplemented with glutamine, sodium pyruvate, β-mercaptoethanol, penicillin, streptomycin, and 10% fetal calf serum, and 3 × 10⁶ cells were cultured in a volume of 1 ml at 37°C with or without the addition of 10 ng of phorbol myristyl acetate (PMA; Sigma, St. Louis, Mo.) per ml and 500 ng of ionomycin (Sigma) per ml. After 45 min, brefeldin A (10 μg/ml; Sigma) was added. Four hours later, cells were washed with PBS and were stained and analyzed as described previously (14). Briefly, cells were incubated with anti-CD16/CD32 MAb and rat IgG antibodies to block unspecific antibody binding. After 10 min, TC-conjugated anti-CD4 MAb and Cy5-conjugated anti-CD8 MAb were added, and cells were incubated for 30 min on ice. Cells were washed with PBS and fixed for 20 min at room temperature with PBS-4% paraformaldehyde (Sigma). Cells were washed with PBS-0.1% bovine serum albumin (BSA), permeabilized with PBS-0.1% BSA-0.5% saponin (Sigma), and incubated in this buffer with rat IgG antibodies and anti-CD16/CD32 MAb. After 5 min, FITC-conjugated anti-IFN-γ MAb or FITC-conjugated isotype control MAb was added, and after another 30 min at room temperature, cells were washed with PBS and fixed with PBS-1% paraformaldehyde. Cells were analyzed with a FACSCalibur and CellQuest software (Becton Dickinson).
Measurement of T-cell turnover with BrdU.
After 3 weeks of infection, 0.8 mg of BrdU (Sigma) per ml was added to the drinking water. Water was replaced daily by a freshly prepared BrdU solution. Five days later, mice were killed, and spleen cells were stained with Cy5-conjugated anti-CD4 MAb or anti-CD8 MAb. Cells were washed, diluted in 0.5 ml of cold 0.15 M NaCl, and fixed by slowly adding 1.2 ml of cold 95% ethanol. After 30 min on ice, cells were washed with PBS, resuspended in PBS-1% paraformaldehyde-0.01% Tween 20, and incubated for 30 min at room temperature. Cells were centrifuged and dissolved in 1 ml of DNase I solution (50 U of DNase I [Sigma] per ml in 4.2 mM MgCl2-0.15 NaCl, pH 5). After 10 min at room temperature, cells were washed with PBS and incubated with FITC-conjugated anti-BrdU MAb or FITC-conjugated control MAb. After 30 min at room temperature, cells were washed with PBS, fixed with PBS-1% paraformaldehyde, and analyzed by flow cytometry.
RESULTS
Course of S. enterica serovar Typhimurium infection in (C57BL/6 × Sv129)F1 mice.
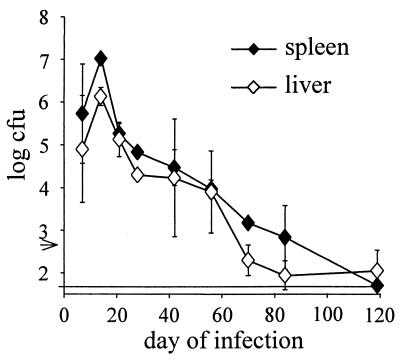
In an initial set of experiments, we infected inherently resistant (C57BL/6 × Sv129)F1 mice with 500 bacteria of the virulent strain S. enterica serovar Typhimurium SL1344 and determined the kinetics of bacterial expansion and clearance (Fig. 1). Intravenous infection resulted in massive expansion of bacteria. Two weeks postinfection, titers in spleens and livers were >106 bacteria/organ. Bacterial titers then steadily declined over a period of 2 months. After 3 to 4 months, bacteria either were completely eliminated or remained at low numbers in both spleens and livers.
FIG. 1.
Bacterial titers in spleens and livers of mice infected with S. enterica serovar Typhimurium SL1344. Mice were infected intravenously with 500 SL1344 organisms. At the indicated time points, five mice per group were killed, and the bacterial loads in spleens and livers were determined. Data are geometric means ± standard deviations. The arrow indicates the inoculum. The limit of detection was 50 bacteria. The results are from one representative experiment of three independent experiments.
Changes in number and phenotype of T cells during S. enterica serovar Typhimurium infection.
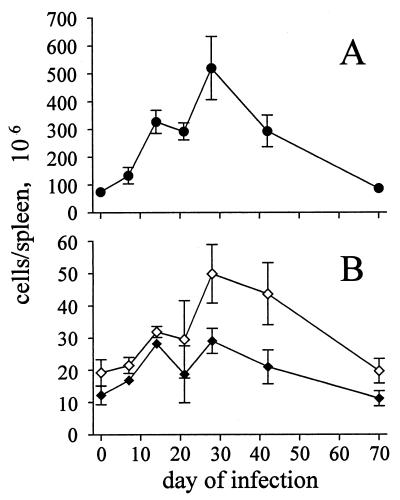
S. enterica serovar Typhimurium infection induced massive splenomegaly, which peaked after 3 to 4 weeks and was maintained for several weeks (Fig. 2A). At the peak of infection, there was almost a 10-fold increase in spleen cellularity. Spleen sizes then slowly returned to normal over several weeks. Flow-cytometric analysis revealed that the splenomegaly was only partially caused by expansion of the T-cell population, since there was only a modest (two- to threefold) increase in total CD4+- and CD8+-T-cell numbers (Fig. 2B).
FIG. 2.
Total numbers of CD4+ and CD8+ splenocytes of mice infected with S. enterica serovar Typhimurium SL1344. Mice were infected intravenously with 500 SL1344 organisms. (A) Total numbers of splenocytes; (B) total numbers of CD4+ (open symbols) and CD8+ splenocytes (closed symbols) determined by flow cytometry. Data are means ± SD from three mice per group and time point. The results are from one representative experiment of two independent experiments.
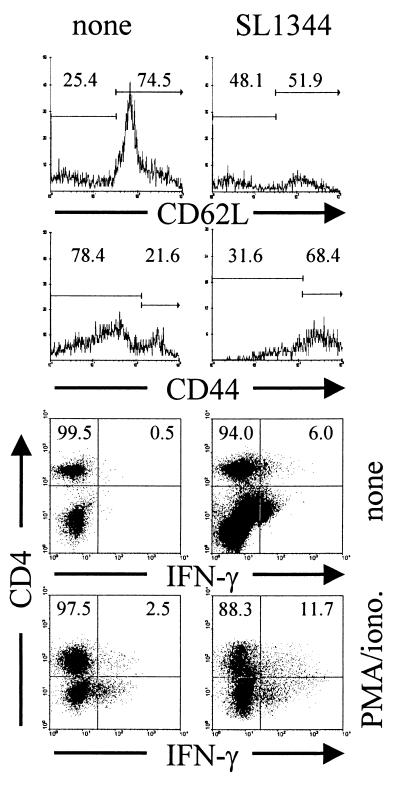
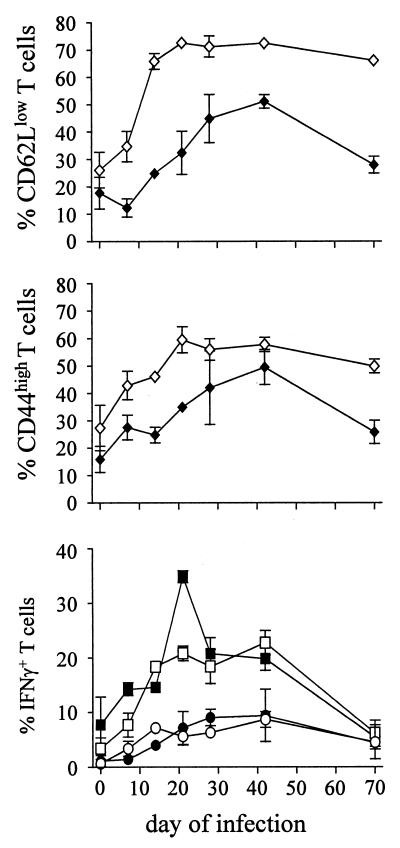
CD4+ and CD8+ T cells in spleens from infected mice were further analyzed for the expression of the activation molecules CD44 and CD62L. CD44 is expressed at low levels on naive T cells, and expression is upregulated during activation. In contrast, CD62L is expressed on naive T cells, but its expression declines upon activation (Fig. 3). Although our mice are kept under specific-pathogen-free conditions, we regularly observe that even in naive mice, 20 to 30% of splenic CD4+ T cells and 10 to 20% of splenic CD8+ T cells express high levels of CD44 and low levels of CD62L. After infection with S. enterica serovar Typhimurium SL1344, expression of CD44 and CD62L on T cells changed drastically (Fig. 4). Within 2 to 3 weeks of infection, more than 50% of CD4+ T cells acquired a CD44high and more than 70% acquired a CD62Llow phenotype, and this high level of activated CD4+ T cells was maintained for several weeks. The expansion of the CD8+ T-cell population with an activated phenotype was delayed and had reduced magnitude (Fig. 4).
FIG. 3.
Flow-cytometric analysis of T cells from S. enterica serovar Typhimurium SL1344-infected mice. Mice were infected intravenously with 500 SL1344 organisms. At different time points, we analyzed splenic T cells for the expression of the activation markers CD44 and CD62L. IFN-γ production was determined by intracellular cytokine analysis after short-term culture with or without PMA and ionomycin. A representative result for CD4+ T cells from naive mice and mice infected for 28 days is shown. Numbers are percentages of CD4+ T cells only.
FIG. 4.
Expression of the activation molecule CD44 on T cells from S. enterica serovar Typhimurium-infected mice. Mice were infected intravenously with 500 S. enterica serovar Typhimurium organisms. At the indicated time points, CD4+ (open symbols) and CD8+ (closed symbols) splenocytes were analyzed for CD44 and CD62L expression. IFN-γ production was determined by intracellular staining after short-term culture with (squares) and without (circles) PMA and ionomycin. In all samples analyzed, intracellular staining with isotype control MAb resulted in less than 1% positive cells (not shown). Data are means ± standard deviations for three mice per group and time point. The results are representative of two independent experiments.
Frequencies of IFN-γ-producing T cells during S. enterica serovar Typhimurium infection.
Since IFN-γ is the prototype Th1 cytokine and is central for the acquired T-cell response against S. enterica serovar Typhimurium, we determined frequencies of those T cells which during S. enterica serovar Typhimurium infection produced IFN-γ either spontaneously or after polyclonal short-term restimulation with phorbol ester and calcium ionophore (PMA and ionomycin).
Frequencies of CD4+ and CD8+ T cells that spontaneously produced IFN-γ were low in all naive mice analyzed. However, after short-term polyclonal stimulation we regularly observed 1 to 5% and 5 to 10% IFN-γ+ T cells within the CD4+ and CD8+ T-cell populations, respectively (Fig. 4). We assume that these cells were memory cells that rapidly responded to polyclonal stimulation. Determination of IFN-γ production without in vitro restimulation revealed that 2 to 3 weeks after infection with S. enterica serovar Typhimurium SL1344, 5 to 10% of both CD4+ and CD8+ T cells produced IFN-γ without further in vitro restimulation, and these elevated levels were maintained for more than 2 months. Short-term polyclonal restimulation drastically enhanced the frequencies of IFN-γ+ CD4+ and IFN-γ+ CD8+ T cells in infected mice. Under these conditions, we observed a rapid increase in the proportion of IFN-γ+ T cells to maximal levels of approximately 20% of CD4+ T cells and more than 30% of CD8+ T cells 3 weeks after infection, and high levels of IFN-γ+ T cells were observed over several weeks.
In vivo proliferation of T cells during S. enterica serovar Typhimurium infection.
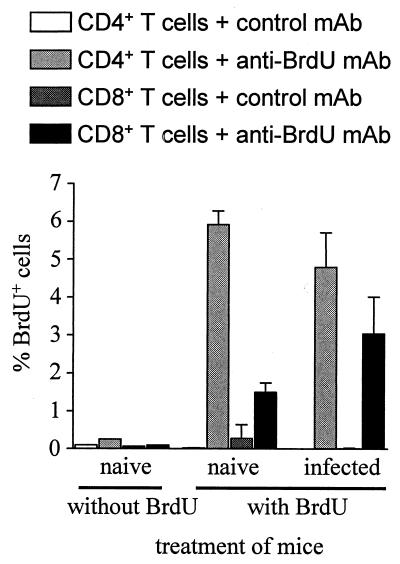
The high frequencies of CD4+ and CD8+ T cells that showed an activated phenotype and secreted IFN-γ spontaneously or upon polyclonal restimulation were in contrast to the moderate expansion of the CD4+ and CD8+ T-cell populations observed during S. enterica serovar Typhimurium infection. To directly analyze T-cell proliferation in vivo, mice were infected with S. enterica serovar Typhimurium, and after 3 weeks, mice were fed with the nucleotide analog BrdU. After 5 days, BrdU incorporation into T cells was measured (Fig. 5). In naive mice, approximately 2% of CD8+ T cells and 6% of CD4+ T cells had incorporated BrdU. Three to four weeks after infection, the frequency of BrdU+ CD8+ T cells was only modestly elevated and that of CD4+ T cells was not at all increased. Thus, S. enterica serovar Typhimurium infection results in T-cell activation and differentiation towards a Th1 phenotype in the absence of notable T-cell expansion.
FIG. 5.
In vivo proliferation of T cells during S. enterica serovar Typhimurium infection. Mice were infected intravenously with 500 S. enterica serovar Typhimurium organisms. After 3 weeks, BrdU was added to the drinking water. Five days later, CD4+ and CD8+ T cells were analyzed for BrdU incorporation by flow cytometry. Data are means plus standard deviations for three mice per group. The results are representative of two independent experiments.
DISCUSSION
Here we analyzed the activation and differentiation status of CD4+ and CD8+ T cells in inherently resistant mice during the course of infection with a virulent strain of S. enterica serovar Typhimurium. Intriguingly, after 2 to 3 weeks of infection, the majority of both CD4+ and CD8+ T cells had acquired an activated phenotype and an unexpectedly large fraction of these T-cell populations secreted IFN-γ. After bacterial clearance, an increased fraction of T cells maintained high expression of CD44 and low expression of CD62L, respectively, which is consistent with the observation that a CD44high CD62Llow phenotype is characteristic for memory T cells (1, 19). Despite the profound activation of both the CD4+ and CD8+ populations, expansion of either T-cell population was marginal. More than 50% of both the CD4+ and CD8+ T cells had acquired an activated phenotype; however, we observed only a moderate (two- to threefold) expansion of these populations over several weeks of infection. Consistent with this observation, there was only a small increase in BrdU incorporation in CD8+ T cells and no increase in BrdU incorporation in CD4+ T cells during the peak of infection.
Different explanations could account for our observations. (i) Infection with virulent S. enterica serovar Typhimurium and the accompanying strong inflammation could cause incomplete T-cell activation, leading to an activated phenotype of a large fraction of T cells but allowing only a minority of these T cells to proliferate. (ii) S. enterica serovar Typhimurium induces immunosuppression in mice and causes the production of large amounts of interleukin 10 and NO, which are both known immunosuppressive compounds (9, 16). By inducing immunosuppression, S. enterica serovar Typhimurium could hinder the proliferation of T cells and thereby block an effective immune response. (iii) Moderate T-cell expansion could be the result of an elevated turnover rate of T cells. A high level of T-cell proliferation could be opposed by a high rate of cell death, possibly due to induction of apoptosis. Current experiments in our laboratory are aimed at testing these different hypotheses.
At day 20 to 30 of S. enterica serovar Typhimurium infection, a large fraction of both CD4+ and the CD8+ T cells produced IFN-γ in response to polyclonal restimulation. Even in the absence of restimulation, significant proportions of both T-cell populations produced IFN-γ, indicating that these T cells had probably been involved in IFN-γ production in vivo. Our results are consistent with studies in which IFN-γ production after infection with attenuated strains of S. enterica serovar Typhimurium was analyzed either by reverse transcription-PCR of IFN-γ mRNA or by measurement of IFN-γ after in vitro restimulation of splenocytes with heat-killed salmonellae (6, 17). In both assays, IFN-γ production reached high levels at 2 to 3 weeks of infection and both CD4+ and CD8+ T cells were involved in IFN-γ production. In the case of infection with attenuated S. enterica serovar Typhimurium, the peak of IFN-γ production by T cells and the onset of bacterial elimination are in close correlation (6). For infection with virulent S. enterica serovar Typhimurium, the situation appears to be different. Although we observed maximal levels of IFN-γ production (and T-cell activation) after 20 to 30 days of infection, efficient reduction of bacterial titers did not occur at this time point, and bacteria were not eradicated until several weeks later, indicating that the high levels of IFN-γ production by T cells are insufficient for the control of infection.
From our experiments, the question of whether the activated and IFN-γ-secreting T cells are specific for S. enterica serovar Typhimurium arises. Currently, only limited numbers of CD4+- and CD8+-T-cell epitopes from S. enterica serovar Typhimurium are known (4, 7, 8, 12). Frequencies of T cells secreting IFN-γ in response to these epitopes were significantly lower than the frequencies we observed in our assays (8, 12). This notion suggests that the high numbers of activated and IFN-γ-secreting T cells in our experiments are mainly due to bystander activation. However, we consider it premature to extrapolate conclusions from a few epitopes to whole T-cell populations at this stage. A definite answer to the question of whether bystander activation plays a major role in T-cell activation during S. enterica serovar Typhimurium infection has to await the characterization of a sizeable number of T-cell epitopes. In this context, it is interesting that during infection with Listeria monocytogenes, the CD8+-T-cell response is to only a minor part due to bystander activation and the majority of activated T cells are indeed L. monocytogenes specific (2, 3). We therefore envisage that the antigen-specific response to S. enterica serovar Typhimurium involves a considerable fraction of the T-cell population.
Acknowledgments
We thank Manuela Stäber for the purification and conjugation of antibodies.
Editor: A. D. O’Brien
REFERENCES
- 1.Budd, R. C., J. C. Cerottini, C. Horvath, C. Bron, T. Pedrazzini, R. C. Howe, and H. R. MacDonald. 1987. Distinction of virgin and memory T lymphocytes. Stable acquisition of the Pgp-1 glycoprotein concomitant with antigenic stimulation. J. Immunol. 138: 3120–3129. [PubMed] [Google Scholar]
- 2.Busch, D. H., I. M. Pilip, S. Vijh, and E. G. Pamer. 1998. Coordinate regulation of complex T cell populations responding to bacterial infections. Immunity 8: 353–362. [DOI] [PubMed] [Google Scholar]
- 3.Butz, E. A., and M. J. Bevan. 1998. Massive expansion of antigen-specific CD8+ T cells during an acute virus infection. Immunity 8: 167–175. [DOI] [PMC free article] [PubMed] [Google Scholar]
- 4.Cookson, B. T., and M. J. Bevan. 1997. Identification of a natural T cell epitope presented by salmonella-infected macrophages and recognized by T cells from orally infected mice. J. Immunol. 158: 4310–4319. [PubMed] [Google Scholar]
- 5.Eisenstein, T. K. 1999. Mucosal immune defence: the Salmonella typhimurium model, p. 51–109. In Y. Paterson (ed.), Intracellular bacterial vaccine vectors. Wiley-Liss, Inc., New York, N.Y.
- 6.Hess, J., C. Ladel, D. Miko, and S. H. E. Kaufmann. 1996. Salmonella typhimurium aroA− infection in gene-targeted mice. J. Immunol. 156: 3321–3326. [PubMed] [Google Scholar]
- 7.Lo, W. F., H. Ong, E. S. Metcalf, and M. J. Soloski. 1999. T cell response to gram-negative intracellular bacterial pathogens: a role for CD8+ T cells in immunity to salmonella infection and the involvement of MHC class Ib molecules. J. Immunol. 162: 5398–5406. [PubMed] [Google Scholar]
- 8.Lo, W. F., A. S. Woods, A. DeCloux, R. J. Cotter, E. S. Metcalf, and M. J. Soloski. 2000. Molecular mimicry mediated by MHC class Ib molecules after infection with gram-negative pathogens. Nat. Med. 6: 215–218. [DOI] [PubMed] [Google Scholar]
- 9.MacFarlane, A. S., M. G. Schwacha, and T. K. Eisenstein. 1999. In vivo blockage of nitric oxide with aminoguanidine inhibits immunosuppression induced by an attenuated strain of Salmonella typhimurium, potentiates Salmonella infection, and inhibits macrophage and polymorphonuclear leukocyte influx into the spleen. Infect. Immun. 67: 891–898. [DOI] [PMC free article] [PubMed] [Google Scholar]
- 10.Mäkelä, P. H., and C. E. Hormaeche. 1997. Immunity to salmonella, p. 143–166. In S. H. E. Kaufmann (ed.), Host response to intracellular pathogens. R.G. Landes Company, Austin, Tex.
- 11.Mastroeni, P., B. Villarreal-Ramos, and C. E. Hormaeche. 1992. Role of T cells, TNFα and IFN-γ in recall of immunity to oral challenge with virulent salmonellae in mice vaccinated with live attenuated aro− salmonella vaccines. Microb. Pathog. 13: 477–491. [DOI] [PubMed] [Google Scholar]
- 12.McSorley, S. J., B. T. Cookson, and M. K. Jenkins. 2000. Characterization of CD4+ T cell responses during natural infection with Salmonella typhimurium. J. Immunol. 164: 986–993. [DOI] [PubMed] [Google Scholar]
- 13.Mittrücker, H.-W., and S. H. E. Kaufmann. 2000. Immune response to infection with Salmonella typhimurium in mice. J. Leukoc. Biol. 67: 457–463. [DOI] [PubMed] [Google Scholar]
- 14.Mittrücker, H.-W., A. Köhler, and S. H. E. Kaufmann. 2000. Substantial in vivo proliferation of CD4+ and CD8+ T lymphocytes during secondary Listeria monocytogenes infection. Eur. J. Immunol. 30: 1053–1059. [DOI] [PubMed] [Google Scholar]
- 15.Nauciel, C. 1990. Role of CD4+ T cells and T-independent mechanisms in acquired resistance to Salmonella typhimurium infection. J. Immunol. 145: 1265–1269. [PubMed] [Google Scholar]
- 16.Pie, S., P. Matsiota-Bernard, P. Truffa-Bachi, and C. Nauciel. 1996. Gamma interferon and interleukin-10 gene expression in innately susceptible and resistant mice during the early phase of Salmonella typhimurium infection. Infect. Immun. 64: 849–854. [DOI] [PMC free article] [PubMed] [Google Scholar]
- 17.Pie, S., P. Truffa-Bachi, M. Pla, and C. Nauciel. 1997. Th1 response in Salmonella typhimurium-infected mice with a high and low rate of bacterial clearance. Infect. Immun. 65: 4509–4514. [DOI] [PMC free article] [PubMed] [Google Scholar]
- 18.Stenger, S., D. A. Hanson, R. Teitelbaum, P. Dewan, K. R. Niazi, C. J. Froelich, T. Ganz, S. Thoma-Uszynski, A. Melian, C. Bogdan, S. A. Porcelli, B. R. Bloom, A. M. Krensky, and R. L. Modlin. 1998. An antimicrobial activity of cytolytic T cells mediated by granulysin. Science 282: 121–125. [DOI] [PubMed] [Google Scholar]
- 19.Tripp, R. A., S. Hou, and P. C. Doherty. 1995. Temporal loss of the activated L-selectin-low phenotype for virus-specific CD8+ memory T cells. J. Immunol. 154: 5870–5875. [PubMed] [Google Scholar]


