

Abstract
Tan spot of wheat (Triticum aestivum), caused by the fungus Pyrenophora tritici-repentis, has significant agricultural and economic impact. Ptr ToxA (ToxA), the first discovered proteinaceous host-selective toxin, is produced by certain P. tritici-repentis races and is necessary and sufficient to cause cell death in sensitive wheat cultivars. We present here the high-resolution crystal structure of ToxA in two different crystal forms, providing four independent views of the protein. ToxA adopts a single-domain, β-sandwich fold of novel topology. Mapping of the existing mutation data onto the structure supports the hypothesized importance of an Arg-Gly-Asp (RGD) and surrounding sequence. Its occurrence in a single, solvent-exposed loop in the protein suggests that it is directly involved in recognition events required for ToxA action. Furthermore, the ToxA structure reveals a surprising similarity with the classic mammalian RGD-containing domain, the fibronectin type III (FnIII) domain: the two topologies are related by circular permutation. The similar topologies and the positional conservation of the RGD-containing loop raises the possibility that ToxA is distantly related to mammalian FnIII proteins and that to gain entry it binds to an integrin-like receptor in the plant host.
INTRODUCTION
Pyrenophora tritici-repentis is a fungal pathogen that causes tan spot of wheat (Triticum aestivum) in sensitive cultivars. This disease is found throughout the major wheat-growing regions of the world and is characterized by either necrotic lesions, chlorosis, or both. As for a number of fungi, disease is associated with the production of host-selective toxins (HSTs; reviewed in Walton, 1996; Wolpert et al., 2002). P. tritici-repentis produces various HSTs, each of which uniquely leads to progression of disease on wheat cultivars that are sensitive to that particular toxin (reviewed in De Wolf et al., 1998; Ciuffetti and Tuori, 1999; Strelkov and Lamari, 2003). Of the three HSTs thus far characterized from P. tritici-repentis, two—Ptr ToxA (Ballance et al., 1989; Tomas et al., 1990; Tuori et al., 1995; Zhang et al., 1997) and Ptr ToxB (Strelkov et al., 1998)—have been shown to be proteins, whereas Ptr ToxC is a low molecular weight compound (Effertz et al., 2002). For Ptr ToxA (hereafter called ToxA), the first protein HST to be isolated (Ballance et al., 1989; Tomas et al., 1990; Tuori et al., 1995; Zhang et al., 1997), sensitivity is conditioned by the presence of a single host locus, Tsn1, on the 5BL chromosome (Faris et al., 1996; Stock et al., 1996; Gamba et al., 1998; Anderson et al., 1999) and the ToxA gene in the fungus (Ballance et al., 1996; Ciuffetti et al., 1997); disease occurs only when both the genes are present.
As an HST, not only is ToxA required for toxicity but infiltrating leaves of sensitive wheat cultivars with ToxA alone results in symptom development (Ballance et al., 1989; Tomas et al., 1990; Tuori et al., 1995). As shown in the accompanying article (Manning and Ciuffetti, 2005), green fluorescent protein tagged ToxA exerts its toxic effect via internalization into sensitive wheat mesophyll cells. After internalization, it appears to localize to chloroplasts, but the mechanisms involved in cell death remain unknown. Because ToxA itself plays a pivotal role in toxicity, its structure is of great interest.
The ToxA gene encodes a pre-pro-protein (Ballance et al., 1996; Ciuffetti et al., 1997; Figure 1). The pre-region (i.e., the signal peptide; residues 1 to 22) targets the protein to the secretory pathway. The pro-region (also known as the N-domain; residues 23 to 60) is cleaved prior to secretion of the mature, 13.2-kD ToxA (i.e., the C-domain; residues 61 to 178) (Tuori et al., 1995; Ciuffetti et al., 1997). Evidence suggests that the N-domain, much like the pro-peptide of insulin, is required during folding for the proper formation of the disulfide in the C-domain that stabilizes the active, native conformation of ToxA (Tuori et al., 2000).
Figure 1.

The Functional Domain Structure of Nascent ToxA.
The pre-domain or the signal sequence (S), the pro-region (N-domain), and the mature toxin (C-domain) are labeled. The N and C termini are labeled and so are the first residues of the N- and C-domains. The position of the disulfide formed in mature ToxA is also indicated. The complete sequence of the mature toxin is shown in Figure 3B.
A database search for proteins similar to ToxA did not yield any potential homologs. In the absence of structural or sequence conservation information to guide mutagenesis experiments, sequence motif searches were performed to find potential functional sites. The searches revealed putative sites of phosphorylation (Thr residues 115, 123, 126, 132, 139, and 167) (Ciuffetti et al., 1997; Zhang et al., 1997), of myristoylation (Gly residues 62 and 93) (Ciuffetti et al., 1997), and of cell attachment (an Arg-Gly-Asp [RGD]-containing motif; residues Asn136 through Phe147) (Ciuffetti et al., 1997; Zhang et al., 1997; Meinhardt et al., 2002). Mutagenesis studies have identified a number of residues, including the RGD motif, that may be important for function (Tuori et al., 2000; Meinhardt et al., 2002; Manning et al., 2004), but without structural information it was not possible to conclusively deduce which residues were important for structural reasons and which might be directly involved in recognition events. Here, we present the high-resolution, crystal structure of natural, mature ToxA and correlate the structure with biochemical results.
RESULTS AND DISCUSSION
Structure Solution
The structure of mature ToxA was solved in two different crystal forms. The structure in form-I crystals (with one molecule in the asymmetric unit) was determined at 3.0-Å resolution using in-house sulfur single-wavelength anomalous dispersion (SAD) data collected to 1.9-Å resolution. Refinement against 1.65-Å resolution data collected at a synchrotron (see Methods) led to a model with a final Rfree of 18.3% and good geometry (Table 1). The form-II crystal structure (with three molecules in the asymmetric unit) was determined by molecular replacement using the form-I structure as the search model. The structure was refined at 1.9-Å resolution to a final Rfree of 22.6%. In both form-I and -II crystals, ToxA is present as a trimer (the trimer in form-I is generated by the crystallographic threefold axis). Having four independently refined molecules provides insight into the variability of structures. Based on analysis of Luzzati (Luzzati, 1952; Kleywegt and Brunger, 1996), the estimated coordinate accuracies of the well-ordered parts of the models are 0.2 and 0.3 Å for the form-I and form-II structures, respectively. The root mean square deviation (RMSD) between the Cα atoms of the three chains of form-II is ∼0.3 Å and is thus consistent with the estimated coordinate accuracy. The RMSDs between the form-I structure and the three monomers of form-II are ∼0.6 Å, indicating that small differences exist. Even though crystal form-I is at a higher resolution, we have prepared figures using the form-II structure because the structures are very similar and the form-II structure has a better ordered RGD-containing loop.
Table 1.
Data Collection and Refinement Statisticsa
| Data Collection and Phasing | Sulfur SAD, Form-I (in House) | Native, Form-I (Synchrotron) | Native, Form-II (Synchrotron) | Native, Form-II (in House) |
|---|---|---|---|---|
| Resolution | 100–1.90 (1.97–1.90) | 100–1.65 (1.71–1.65) | 100–1.90 (1.97–1.90) | 100–3.00 (3.11–3.00) |
| Reflections (total/unique) | 808,412/12,883 | 147,079/19,469 | 191,032/31,109 | 60,556/8,241 |
| Completeness | 99.9 (100.0) | 99.9 (99.8) | 99.4 (100.0) | 99.9 (99.9) |
| Rmeasb | 8.2 (50.7) | 8.0 (50.2) | 6.8 (56.8) | 10.3 (39.5) |
| Rmrgd-Fb | 2.8 (12.5) | 7.9 (40.9) | 7.2 (43.2) | 8.9 (27.5) |
| I/σ | 62.9 (56.0) | 13.9 (2.6) | 11.3 (2.2) | 19.0 (5.4) |
| FOM/Δϕ(°)–Mlpharec | 0.2/66 | |||
| FOM/Δϕ (°)–DMc | 0.7/51 | |||
| Refinement | Form-I (synchrotron) | Form-II (synchrotron) | ||
| Resolution (Å) | 100–1.65 (1.69–1.65) | 100–1.90 (1.95–1.90) | ||
| Number of reflections | 19,430 | 31,030 | ||
| Number of amino acids | 103 | 315 | ||
| Number of solvent atoms | 105 | 165 | ||
| Number of Ni2+ ions | – | 8 | ||
| Number of SO4−2 ions | 2 | – | ||
| Total number of atoms | 968 | 2,668 | ||
| Average B (all atoms) (Å2) | 28 | 45 | ||
| Rcryst (%)d | 15.7 (21.6) | 18.3 (24.5) | ||
| Rfree (%)d | 18.3 (26.3) | 22.6 (31.3) | ||
| RMSD bonds (Å) | 0.012 | 0.008 | ||
| RMSD angles (degrees) | 1.435 | 1.097 | ||
| φ,ψ Core region (%)e | 100 | 98 |
Numbers in parentheses correspond to values in the highest resolution shell.
Rmeas is the multiplicity weighted merging R-factor, and Rmrgd-F is an indicator of the quality of reduced data (Diederichs and Karplus, 1997).
Figure of merit (FOM): average absolute phase difference between final refined phases and experimental phases both before (MIphare) and after density modification (DM).
Rcryst, ∑|Fobs − Fcalc|/∑|Fobs|; Rfree, Rcryst calculated using 10% of the data that were excluded from the refinement.
Ramachandran plot quality as defined by Kleywegt and Jones (1996). In chain B of the form-II structure, Asn77 (φ,ψ = −111°, 73°) and Asn127 (φ,ψ = −135°, −159°) lie in the noncore region.
The majority of the main chain in both crystal forms has clear electron density (Figure 2). The exception is ∼15 residues near the N terminus that, due to disorder, have little or no density and have not been modeled (see Methods). One last feature requiring comment is the disulfide bond between Cys64 and Cys160 (Tuori et al., 2000). The electron density seen for Cys64 and Cys160 in form-II shows that the sulfurs are unexpectedly 3.5 Å apart in a nonbonded interaction (and in form-I, no electron density is seen for Cys64). A control data set collected on our in-house x-ray source (Table 1) reveals an intact disulfide, so the cleavage is an artifact of synchrotron data collection as has been seen for other proteins (Burmeister, 2000; Dunlop et al., 2005). For this reason, we will treat it in this article as a disulfide.
Figure 2.

Electron Density Map Quality and the RGD Loop Structure.
A stereodiagram of the 2Fo–Fc electron density map contoured at 1.0 ρrms shows clear density for the main chain atoms and most of the side chain atoms of the RGD loop of chain B in the form-II crystals. The residues are labeled, and four water sites observed in all four molecules of ToxA are shown. Hydrogen bonds are indicated by dashed lines. This figure was prepared using BobScript (Esnouf, 1999) and Raster3D (Merritt and Bacon, 1997).
Overall Structure
ToxA is a single domain protein having a β-sandwich fold with two antiparallel β-sheets composed of four strands each enclosing the hydrophobic core (Figure 3A). At the N-terminal region of the mature protein that includes pyroglutamate-61 (Pca61) (Tuori et al., 2000), only the first two residues in form-I and the first four in form-II show interpretable density (see Supplemental Figure 1 online) and then come 15 to 16 disordered residues before the first β-strand. The strands are numbered sequentially from β1 to β8 with sheet I composed of strands β1, β8, β5, and β6 and sheet II containing strands β2, β3, β4, and β7. A single one-turn α-helix (α1) is present between β1 and β2. The topologies of the sheets are shown in Figures 3A and 3B. As seen in Figure 4, the β-strands form a rather rigid protein core (low B-factors) and the loops are more mobile (high B-factors).
Figure 3.

Tertiary Structure of ToxA.
(A) The overall structure of the ToxA monomer. A stereoribbon diagram of ToxA monomer emphasizing the β-sandwich fold, with the secondary structural elements labeled and colored (β-strands in green and α-helix in blue). The Cα positions of the RGD residues are denoted by semitransparent spheres, and the four ordered N-terminal residues (including Pca61) are shown as ball-and-stick models. The separation of the Sγ atoms of Cys64 and Cys160, actually disulfide bonded in the native protein, is indicated by a dotted yellow line. The possible path of the unmodeled residues is drawn as dashed lines. The figure was prepared using Molscript (Kraulis, 1991) and Raster3D (Merritt and Bacon, 1997).
(B) The topology and main chain hydrogen bonding of ToxA. A schematic representation of the ToxA fold is shown, with the secondary structural elements labeled. The two β-sheets are shaded green and labeled, while the residues of the α-helix are shaded blue and boxed. Amino acids are numbered and indicated by standard three-letter codes. The residues not visible in one or more chains of ToxA are shown as dashed circles. Main chain hydrogen bonds are indicated by arrows drawn pointing from the amide nitrogen to the carbonyl oxygen. A β-bulge present in strand β6 involves Phe147, which has unusual β-sheet torsion angles (φ = −86°, ψ = 47°).
Figure 4.

Backbone Mobilities of ToxA.
The average main chain B-factors of form-I (thick line) and form-II chains A (thin line), B (dashed line), and C (dashed-dotted line) are plotted against residue numbers. Locations of the secondary structure elements and the RGD tripeptide are shown below the plot. As expected, loops and regions not stabilized by crystallographic packing interactions have B-factors higher than average, while β-strands forming the protein core have lower B-factors. For the loops with B-factors approaching 90 Å2, the most mobile residues have weak main chain density (<1 ρrms), but the chain path is still easily interpretable.
Among the seven loops connecting the secondary structural elements, three are tight turns (three to four residues) connecting adjacent antiparallel strands (loops β2-β3, β3-β4, and β6-β7), and the other four are longer (four to six residues), bridging strands and helices on opposite sides of the sandwich. The RGD residues (140 to 142) hypothesized to be functionally important are located in the β5-β6 loop (Figure 3A). In form-I, the loop conformation is influenced by the binding of a sulfate ion to the side chain of Arg140 and main chain amides, but it is nevertheless highly mobile (Figure 4). In form-II, Arg140 interacts with another chain in the trimer (see below), resulting in lower mobility when compared with the cubic form (Figure 4).
Trimer Structure
Although ToxA is present as a strongly interacting trimer in both the crystal forms (Figure 5A), during gel filtration it runs at an apparent Mr of 13 kD (see Methods and Supplemental Figure 2 online), suggesting that it is a monomer in solution (Tuori et al., 1995; Meinhardt et al., 1998). Sedimentation equilibrium results were consistent with the existence of a monomer-trimer equilibrium in solution with an association constant (Ka) ≈109 M−2 (see Methods and Supplemental Figure 3 online). This Ka implies that at ToxA concentrations showing toxicity during infusion experiments (∼1 μM) (Tuori et al., 2000), pure ToxA would be >99% in the monomeric form. Furthermore, the recombinant proToxA molecule that is fully active behaves as a stable monomer according to both gel filtration and sedimentation equilibrium (see Supplemental Figures 2 and 4 online). Because ToxA would appear to act as a monomer, it is important to describe the trimer interactions in order to understand how the monomer structure may differ from the trimer that is seen in the crystal. Also, since the interaction of ToxA with other proteins may enhance trimer formation, it is still possible that ToxA acts as a trimer sometime during its function.
Figure 5.

The Crystallographic Trimer of ToxA.
(A) A ribbon diagram of the ToxA trimer as seen in the asymmetric unit of the form-II structure looking down the threefold axis is shown. The three chains are labeled and shown in green, blue, and purple. The four N-terminal residues and the RGD residues are shown as stick models.
(B) The two trimerization surfaces of ToxA. For this image, the green molecule from (A) is separated from the others and rotated 90° around the vertical. The narrow spine-like interface interacting with the purple molecule is facing the reader. The broad vise-shaped interface interacting with the blue molecule faces down. For trimer assembly, the blue surface of one molecule meshes with the purple surface of another. Residues having ≥40-Å2 surface area buried at the interface are labeled. The threefold axis is indicated and labeled. This figure was generated using Pymol (www.pymol.org).
The overall shape of the trimer is that of a three-blade pinwheel (Figure 5A). The trimer interface buries ∼1200 Å2 of surface area per monomer and involves a concave broad surface of ToxA binding like a vise around a narrow spine of another monomer that is created largely by strand β6 (Figure 5B). In all, 37 residues participate to create a network of salt bridges near the threefold (involving Arg128, Asp149, and Glu177 from all three chains), a β-sheet interaction between strand β6 (residues Val143 through Leu146) of one chain and strand β7 (Arg156 through Phe159) of a neighboring chain, and the burial of many nonpolar side chains (see Supplemental Figure 5 online for details). In the form-II structure, hydrogen bonds involving the side chains of Arg140 and Arg156 further tie down the tip of the RGD-containing loop (Asn136 through Val143).
What are the implications of this for the monomer structure? First, because the β-ribbon involving the ends of the strands β5 and β6 (Trp134 to Asn136 and Asp142 to Tyr144) extend beyond the main β-sandwich core (see Figures 3A and 3B), we predict that in the absence of the interchain vise-like interactions stabilizing this conformation, these residues will form a much more mobile and larger (up to 11 residues) loop. A second expectation is that the N-terminal region (residues 61 to 64) will also be much less ordered in a monomer.
Rationalization of Existing Mutant Data
Combining the mature ToxA structure with existing mutagenesis data allows us to gain insight into ToxA structure–function relationships. To date, published mutation analyses of ToxA include 20 single mutations (Tuori et al., 2000; Meinhardt et al., 2002; Manning et al., 2004) that targeted the residues in the RGD-containing segment (Asn136 through Phe147) and residues that represented potential phophorylation sites (Thr residues 115, 123, 126, 132, 139, and 167) or myristoylation sites (Gly residues 62 and 93) (Table 2). In addition to these mutants, we present here data for a further three mutated residues (see Table 2 and Methods). Of all the mutants, eight are active, two are partially active, and 13 are inactive. All of the mutation sites have unambiguous density in one or both crystal forms, and Figure 6 shows how these mutation sites map onto the structure.
Table 2.
Correlation of ToxA Mutations with Structurea
| Mutation | Structural Location | Accessible Side Chain Area (Å2) | Reference |
|---|---|---|---|
| Active | |||
| S86G | α1 | 60 | This studyb |
| G96A | β2 | 11 | Meinhardt et al. (2002) |
| T115A | β5 | 32 | Manning et al. (2004) |
| T123A | β4-β5 loop | 65 | Manning et al. (2004) |
| T126A | β4-β5 loop | 61 | Manning et al. (2004) |
| V138A | β5-β6 loop | 124 | Manning et al. (2004) |
| T167A | β7-β8 loop | 15 | Manning et al. (2004) |
| G168A | β7-β8 loop | 34 | Manning et al. (2004) |
| Impairedc | |||
| Structurally disruptive | |||
| G93A | β2 | 25 | This studyb |
| T132A | β5 | 3 | Manning et al. (2004) |
| F147A | β6 | 33 | Manning et al. (2004) |
| Structurally nondisruptive | |||
| G62A | N terminus loop | 26 | This studyb |
| C64G | N terminus loop | 15 | Tuori et al. (2000) |
| N136A | β5 | 73 | Manning et al. (2004) |
| T137A | β5 | 45 | Tuori et al. (2000) |
| T139A | β5-β6 loop | 92 | Manning et al. (2004) |
| R140A | β5-β6 loop | 137 | Manning et al. (2004) |
| G141A | β5-β6 loop | 21 | Meinhardt et al. (2002); Manning et al. (2004) |
| D142E | β6 | 83 | Meinhardt et al. (2002); Manning et al. (2004) |
| V143A | β6 | 25 | Manning et al. (2004) |
| Y144A | β6 | 109 | Manning et al. (2004) |
| E145A | β6 | 91 | Manning et al. (2004) |
| L146A | β6 | 66 | Manning et al. (2004) |
All reported mutants were created and tested in the context of proToxA and behaved well during expression and purification.
Residues Gly62 and Gly93 are potential myristoylation sites; S86G was a PCR-induced mutation.
T132A and L146A are partially active; all other mutants in this category were scored as inactive.
Figure 6.

Mapping of Site-Directed Mutagenesis Results onto the ToxA Structure.
The molecular surface of ToxA is colored to highlight the sites of fully active mutants (green), partially active or inactive mutants that are expected to disrupt the structure (yellow), and partially active or inactive mutants that are expected to be nondisruptive (purple). All residues except Thr132, Gly141, and Val143 are visible in these views. The surface on the left is in the same orientation as Figure 3A, while the surface on the right is rotated 180° around the vertical to show the other side of the protein. The figure was generated using Pymol (www.pymol.org).
Eight residues (Ser86, Gly96, Thr115, Thr123, Thr126, Val138, Thr167, and Gly168) when mutated to Ala or Gly resulted in variants that retained toxicity. The side chain of each of these residues is solvent exposed, where the mutation would not be expected to disrupt ToxA folding or stability. Their unperturbed activity indicates that these surface regions (green in Figure 6) are not crucially involved in receptor recognition or other interactions required for ToxA function.
In the case of partially and fully inactive variants, the location of each mutated residue allows us to distinguish whether that mutation would be expected to destabilize the protein (yellow in Figure 6) or not (purple in Figure 6). If destabilization is unlikely, then that site is implicated as a potential point of direct involvement in receptor recognition or another interaction required for ToxA function. Among the partially and completely inactive mutants, three (Gly93, Thr132, and Phe147) are in environments where the mutation would be expected to disrupt the structure. The structure reveals that Gly93, located at the start of strand β2, adopts main chain torsion angles (φ, ψ = 105°, −22°) that are unfavorable for non-Gly residues, so the mutation to Ala would destabilize the local conformation. Thr132, one of the potential phosphorylation sites, is mostly buried in the ToxA monomer by nearby side chains of Trp134 and Gln175, and we expect that mutation to Ala would disrupt these interactions and destabilize and/or alter ToxA structure. We conclude that Thr132 plays a structural role, but since it is partially exposed, we cannot rule out that it may play a direct role, such as to be phosphorylated in planta. For Phe147, the side chain is buried in the core of the monomer where mutation would likely disturb the structure.
The remaining 12 residues have partly or fully exposed side chains where, based on the folded protein structure, the mutations would not be expected to disrupt the structure. As seen in Figure 6, these sites are mostly located on one protrusion of the fold, which is the RGD-containing loop between β5 and β6. The only exceptions are Gly62 and Cys64. Interestingly, it is possible that these two residues represent a special case where the mutations would be compatible with the folded conformation, but they alter the folding process so that the native fold is never reached. Evidence that Cys64 is an important player in the folding process is that the disulfide involving Cys64 is properly formed during in vivo folding of proToxA but does not properly reform during in vitro refolding of reduced ToxA (Tuori et al., 2000). Thus, it is plausible that mutations of Cys64 and its neighbors (like Gly62) would interfere with folding.
The clustering of the inactive, nondisruptive mutations on the RGD-containing loop is consistent with the original hypothesis (Ciuffetti et al., 1997; Zhang et al., 1997; Meinhardt et al., 2002; Manning et al., 2004) that ToxA may interact with plant cell integrin-like receptors in a manner analogous to mammalian proteins such as vitronectin and fibronectin. In mammals, recognition of RGD residues is highly specific and exquisite in a variety of contexts (Xiong et al., 2002; Takagi et al., 2003; Springer and Wang, 2004; Xiao et al., 2004). ToxA is similar in that even a subtle Asp142Glu mutation results in loss of recognition, but it is different in that not just the RGD but also many surrounding residues are also required for recognition. The interest of the RGD residues for ToxA function is further highlighted by the fact that interaction in animal cells of some RGD-containing proteins with integrins results in their internalization. In particular, this route is used by certain viruses as a cell entry mechanism (Wickham et al., 1993; Memmo and McKeown-Longo, 1998; Hynes, 2002; Marjomaki et al., 2002; Zubieta et al., 2005). While this phenomenon has not yet been seen in plants, that RGD-containing peptides are known to disrupt the plasma membrane–cell wall continuum (Canut et al., 1998; Mellersh and Heath, 2001; Senchou et al., 2004) provides circumstantial evidence for the existence of integrin-like proteins in plants.
Comparison with Mammalian RGD Proteins: A Possible Evolutionary Relationship
In order to gain further insight from the ToxA structure, a search for structurally similar proteins was performed using the program DALI (Holm and Sander, 1998). The top matches were all proteins with β-sandwich folds, but the Z-scores (highest 4.2) were well below the cutoff of 6.0 suggested by DALI as indicative of a reliable structural homolog. Interestingly, among the top scores were known RGD-containing mammalian proteins that are based on a fibronectin type III (FnIII) fold (also a β-sandwich structure). Therefore, the structure FnIII was compared with that of ToxA. A study of the topology diagrams revealed that the proteins could be made to have a similar topology through a simple circular permutation of ToxA (Figure 7A). The circular permutation event connects the N and C termini of ToxA, and new termini are formed by the cleavage of the β6-β7 loop. In this comparison, strands β2 and β3 of ToxA are insertions relative to FnIII, and strand A of FnIII is an insertion relative to ToxA (Figure 7A). Thus, after circular permutation, ToxA and FnIII can be aligned using a common six-stranded core of the same topology.
Figure 7.

Circular Permutation of ToxA.
(A) Topological comparison of ToxA and the tenth domain of fibronectin (FnIII10) shown as a representative for the FnIII domain using the strand nomenclature proposed by Leahy et al. (1992). Open arrows and rectangles represent elements that are common to both of the structures, and striped arrows represent elements unique to each structure. The positions of the conserved RGD residues are also indicated.
(B) Stereoview of the ToxA (pink)/FnIII10 (blue) comparison, with the unique elements of each chain indicated (striped). The Cα positions of RGD residues are shown as semitransparent spheres. The view is identical to that of Figure 3A. The secondary structural elements are labeled in both panels. The connection of the N and C termini (dashed line) and the cleaving of the β6-β7 loop (arrowhead) define the changes involved in the circular permutation.
A new DALI search with a circularly permuted ToxA yielded the RGD-containing structures of the tenth domain of fibronectin (FnIII10; Dickinson et al., 1994) and the third domain of tenascin (FnIII3; Leahy et al., 1992; Dickinson et al., 1994) among the top matches (Z-scores ≈ 7.5). Since the structures of FnIII10 and FnIII3 are highly similar (RMSD of 1.1 Å for 73 Cα atoms), the former is used as a representative for comparisons with ToxA. The structural overlay of ToxA with FnIII10 is shown in Figure 7B, and a particularly striking feature of the overlay is that the RGD-containing loops are at a common position in the structure (in the β5-β6 loop) (Figure 7).
Structural similarity after circular permutation combined with the spatial conservation of key functional residues is a well-documented phenomenon (Murzin et al., 1995; Jung and Lee, 2001) that generally leads to the proposal that the proteins in question are homologs even in the face of no significant overall sequence similarity (e.g., Murzin, 1998). The match of the position of the RGD-containing loop could easily be a result of convergent evolution, but nevertheless, the similar fold and positional conservation of the RGD-containing loop in the six-stranded circularly permuted ToxA and FnIII plus their similar functions in terms of binding to a cell surface receptor provide an attractive case for the existence of a common ancestor, especially given the evidence that the plant cell wall is the functional equivalent of the mammalian extracellular matrix (Kohorn, 2000; Baluska et al., 2003). Isolation of the plant protein that serves as a ToxA receptor and structural and functional characterization of fibronectin-like proteins from the cell wall, such as the putative one recently isolated (Pellenc et al., 2004), may provide clues to the evolutionary origins and mode of action of ToxA.
METHODS
Purification and Crystallization
ToxA was purified from culture filtrates as previously described (Tuori et al., 1995). A procedural modification involved dialyzing the protein against Epure water (Barnstead) instead of 30 mM TRIS, pH 9.0, and the concentration was determined using an extinction coefficient ɛ280 = 18 mM−1 cm−1 (Zhang et al., 1997). Prior to crystallization, the protein was diluted to 1.5 mg/mL in 0.01 M HEPES, pH 7.0, and stored at 4°C.
Two crystal forms of ToxA were grown at room temperature using the hanging-drop vapor diffusion method. Form-I crystals exhibited cubic morphology and grew from a 1:1 drop using a reservoir solution containing 0.5 M (NH4)2SO4, 15% dioxane, and 0.1 M MES, pH 6.5. Crystals grew over 2 weeks to a final size of ∼(0.15 mm)3. For data collection, the cubic crystals were flash-frozen in liquid nitrogen after a 2-min incubation in a cryoprotectant consisting of the reservoir plus 15% glycerol. Form-II crystals were obtained by mixing equal volumes of the protein stock with a reservoir of 7.5% polyethylene glycol 400 (v/v), 0.2 M NiCl2, and 0.1 M HEPES-Na, pH 7.0. These tetragonal-shaped crystals appeared within 24 h and grew in 1 week to a size of ∼0.15 × 0.15 × 0.10 mm3. Divalent cations were essential for crystallization with Co2+, Ca2+, and Cd2+ ions able to substitute for Ni2+. For data collection, the form-II crystals were progressively soaked for 5 min each in a stepwise manner through solutions of 15, 22.5, and 30% (v/v; final concentration) polyethylene glycol 400 plus reservoir and then flash-frozen in liquid nitrogen.
Data Collection
For structure determination, highly redundant SAD data were collected using a form-I crystal and in-house Cu-Kα radiation (Rigaku RU-H3R rotating anode operating at 50 kV and 100 mA and an R-Axis IV image plate detector; λ = 1.54 Å, Δφ = 1°, 540 15-min images) (Table 1). For structure refinements, 1.65-Å resolution native data were collected at beamline 8.2.1 of the Advanced Light Source (ALS; Berkeley National Laboratory; high-resolution pass, λ = 1.0 Å, Δφ = 1°, 40 20-s images; low-resolution pass, λ = 1.0 Å, Δφ = 1°, 40 5-s images) for the form-I crystals, and 1.90-Å data (λ = 1.0 Å, Δφ = 1°, 160 15-s images) were collected for the form-II crystals. A low-resolution, in-house data set extending to 3 Å (λ = 1.54 Å, Δφ = 1°, 99 15-min images) was also collected on a form-II crystal to confirm the presence of a disulfide bond. All data sets were processed using the HKL suite of programs (Otwinowski and Minor, 1997) (Table 1).
The form-I crystals belong to the cubic space group P213 with unit cell dimensions a = b = c = 78.2 Å, with one molecule in the asymmetric unit and a solvent content of 60%. Form-II crystals belong to the tetragonal space group P4122 with unit cell dimensions of a = b = 74.5 Å and c = 137.3 Å and have three molecules in the asymmetric unit with a solvent content of 50%.
Structure Determination and Refinement
The 13.2-kD ToxA structure was determined from form-I crystals at 3.0-Å resolution using the weak anomalous signal arising from inherently present sulfur atoms. The expected Bijvoet ratio (Hendrickson and Teeter, 1981) from the four sulfur atoms (two Met and two Cys) present in the 13.2-kD protein at 1.54-Å wavelength is ∼0.8%. It was later observed that two of the four sulfurs (one Cys and one Met) were disordered, but the presence of a single well-ordered sulfate ion in the asymmetric unit led to three sulfurs contributing to the phasing of the 13.2-kD protein.
In order to determine the low-resolution cutoff for structure solution, the 540-image data set was split into two consecutive 270-image data sets (images 1 through 270 and 271 through 540), and the anomalous correlation coefficients between the two sets were calculated using the program XPREP (Bruker Analytical X-ray Systems). At 3-Å resolution, the correlation coefficients fell below 20%, and this was chosen as a cutoff. The program SHELXD (Schneider and Sheldrick, 2002) was used to locate the positions of the sulfurs. The 100 search trials resulted in a clear solution (∼50% success rate) with a correlation coefficient of 39% (all data) (Debreczeni et al., 2003). Heavy atom refinement (positions and occupancies) and phasing were performed using the program MIphare (Otwinowski, 1991). Density modification by DM (Cowtan and Zhang, 1999) resulted in experimental maps that were of superior quality. A more detailed analysis assessing how much diffraction data were required to solve the structure will be presented elsewhere (G.N. Sarma and P.A. Karplus, unpublished data).
Prior to model building and refinement, 10% of the data were set aside for cross-validation. The automated model building program ARP/wARP (Perrakis et al., 1999) was used to extend the 3-Å phases to 1.65 Å and to build ∼90% of the model. Furthermore, the program was used to pick waters using the following criteria: (1) a peak of ≥3 ρrms (RMSD electron density of map often reported as σ) in the Fo–Fc map and a peak of ≥1 ρrms in the 2Fo–Fc map and (2) a distance of ≥2.5 and ≤3.5 Å to nearby hydrogen bond donor or acceptor. Manual rebuilding was performed using O (Jones et al., 1991). Anisotropic (TLS) refinement as incorporated in REFMAC (Murshudov et al., 1997) followed by positional and individual B-factor refinements resulted in a final R and Rfree of 15.7 and 18.3%, respectively. The final model has 103 residues (61 to 62 and 78 to 178), 105 waters, and 2 sulfates, with alternate conformations seen for Ser86, Ile95, Arg117, Ile131, Gln154, Arg173, and Glu177, and for waters 28, 35, 37, 40, 55, 62, 64, and 65. Residues 63 through 77 did not have any visible density and were not modeled.
For form-II structure solution, a crystallographic trimer generated using the form-I monomer (without waters) was used as a search model for molecular replacement at 4 Å using the direct Patterson search as implemented in the program CNS (Brunger et al., 1998). Cross-rotation and translation searches yielded a clear solution with a correlation coefficient of 0.550 versus 0.114 for the next best solution. The trimer was refined to 1.9 Å using REFMAC (Murshudov et al., 1997), with 10% of the data set aside for cross-validation. No noncrystallographic symmetry restraints were used during refinement. Waters were picked (using the criteria reported above), and alternate conformations were modeled for Ile95 in chain A, Arg113 in chain B, and waters 94 and 126. In one of the chains (chain B), a six-residue stretch (residues 74 to 79) forms an additional β-strand that interestingly lies on a crystallographic twofold axis and shows weak but clear main chain electron density. Thus, in the crystal, this loop shares the space with the exact same segment from another trimer in the crystal. Accordingly, it was modeled with half occupancy (see Supplemental Figure 6 online). The weak density for the loop is consistent with the high temperature factors for this region of the protein (Figure 4). Strong electron density peaks for Ni2+ ions were seen on the crystallographic twofold axes. Additional Ni2+ ions were located using anomalous difference maps calculated from another data set optimized for Ni anomalous signal (λ = 1.487 Å; data not shown). Occupancies for the Ni ions not on special positions were estimated by carrying out test refinement runs with occupancies of 0.2, 0.4, 0.6, and 0.8, and for each Ni, the occupancy that yielded a B-factor most similar to the surrounding protein atoms was chosen. The eight Ni2+ ions ranged in occupancy from 0.2 to 0.5. Unsuccessful attempts to solve the structure of the form-II crystal using Ni multiple wavelength anomalous dispersion (data not shown) could be explained by the low occupancies and high temperature factors of the Ni2+ ions.
Iterative cycles of model building and refinement yielded an R and Rfree of 20.8 and 26.4%. TLS refinement, with each monomer as a rigid body, lowered the R and Rfree to 18.3 and 22.6%, respectively. The final model has 315 amino acids (103 chain A, 109 chain B, and 103 chain C), 165 waters, and 8 Ni2+ ions, with residues 65 to 79 (chains A and C) and residues 65 to 73 (chain B) not modeled due to weak electron density.
Since discretely ordered solvent molecules are an integral part of the structure and function of the protein, the preferred hydration sites (Karplus and Faerman, 1994) in each crystal form were numbered according to their electron density strength (water 1 being the highest) from 1 to 105 in form-I and to 165 in form-II. In form-I and -II crystals, 84 and 141 of the sites, respectively, are present in the first solvent shell (making at least one hydrogen bond with the protein).
Structural Comparison and Analyses
Secondary structure assignments were made using DSSP (Kabsch and Sander, 1983) and also by visual inspection. Hydrogen bonding geometries were calculated using HBPLUS (McDonald and Thornton, 1994). Structure-based sequence alignments were done using HCORE (P.A. Karplus, unpublished data) with a distance cutoff of 3.0 Å.
Site-Directed Mutagenesis
Of the three mutants newly reported in this study, G62A and G93A were generated by site-directed mutagenesis using the following primers (one of the complementary pair): G62A, 5′-CTACAGGAGCGGCAGGCAAGCTGCATGTCAATC-3′; G93A, 5′-CTCGGACGACTTGCTGCTATAGGCTCGTGG-3′. The S86G mutation was generated inadvertently during PCR cloning of the proToxA into pTRC99-HPro (Tuori et al., 2000). All mutant proteins were expressed in Escherichia coli and assayed for bioactivity as described by Manning et al. (2004).
Gel Filtration
The existence of the ToxA monomer in solution (0.5 mg/mL in 100 mM NaCl and 10 mM sodium phosphate, pH 7.0) was confirmed by gel-filtration chromatography using a Superdex-75 10/300 GL size-exclusion column (Amersham Biosciences) at a flow rate of 0.5 mL/min. Using identical conditions, proToxA at 0.17 mg/mL was also chromatographed. Fractions were collected every minute, and activity was assayed by infiltrating peak fractions into the sensitive wheat (Triticum aestivum) cultivar Katepwa. For ToxA, the major active fraction and >80% of the A230 absorbing material ran at an elution volume corresponding to a molecular mass of ∼13 kD, and for proToxA, >95% of the absorbing material ran at an elution volume corresponding to a molecular mass of ∼19 kD (see Supplemental Figure 2 online).
Analytical Ultracentrifugation
Sedimentation equilibrium analytical ultracentrifugation experiments were performed with a Beckman Optima XL-A analytical ultracentrifuge at 20°C using a four-hole AN-60Ti rotor and double sector charcoal/Epon-filled centerpieces. Buffer densities and viscosity corrections were made according to data published by Laue et al. (1992). The partial specific volume of ToxA was estimated from the protein sequence to be 0.727 cm3/g, using the method of Perkins (1986).
The centrifugation experiments were performed according to the protocol described by Ausio et al. (1992) in a solution containing 100 mM NaCl and 50 mM sodium phosphate, pH 7.0. Four 120-μL samples of ToxA were sedimented to equilibrium: 3.4 and 10.1 μM samples were run at 22,000 and 30,000 rpm, and 7.8 and 23.4 μM were run at 22,000, 26,000, and 30,000 rpm. Scans were collected with absorbance optics at wavelengths between 230 and 280 nm. The radial step size was 0.001 cm, and each c versus r data point was the average of 15 independent measurements. Wavelengths were chosen so that no points exceeded an absorbance of 1. Equilibrium data spanning this concentration range were examined by global fitting using UltraScan software for the Linux operating system (www.ultrascan.uthscsa.edu). Equilibrium data were fit to multiple models using global fitting of all data (Russell et al., 2004). The monomer-trimer equilibrium fit resulted in a monomer of molecular mass of ∼13.4 kD, which is in good agreement with the molecular mass of 13.2 kD calculated from the ToxA sequence. Fitting the data to monomer-dimer and monomer-dimer-trimer models also resulted in reasonable fits giving monomer molecular masses of 12.9 and 13.6 kD, respectively. The monomer-trimer model had the best statistics and the lowest systematic errors based on inspection of the residual patterns, and the monomer molecular weight is closest to the true value and is consistent with the formation of trimer in the crystal.
For proToxA, one sample at a concentration of 33.8 μM was analyzed. The speeds and scans were done as for ToxA. The data fit well to a single-component ideal model that yielded a molecular mass of 19.7 kD, exactly matching the calculated molecular mass of a monomer.
Accession Numbers
The coordinates and the structure factors have been deposited in the Protein Data Bank (www.rcsb.org/pdb/) as entries 1ZLD (form-I) and 1ZLE (form-II).
Supplemental Data
The following materials are available in the online version of this article.
Supplemental Figure 1. N-terminal Residues of ToxA.
Supplemental Figure 2. Gel Filtration Analysis.
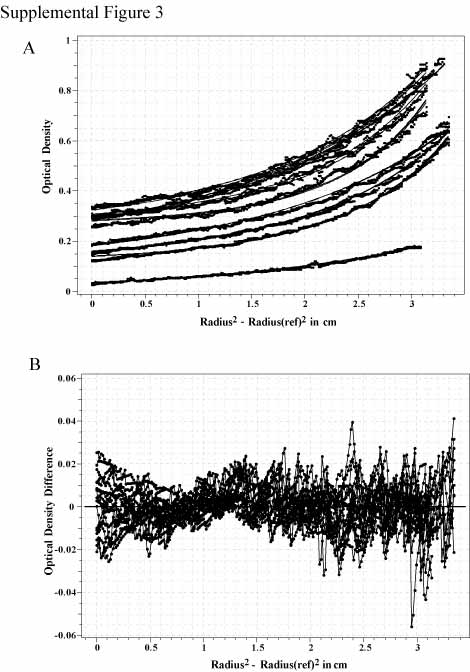
Supplemental Figure 3. Sedimentation Equilibrium Analysis of ToxA.
Supplemental Figure 4. Sedimentation Equilibrium Analysis of proToxA.
Supplemental Figure 5. The Trimerization Interface of ToxA.
Supplemental Figure 6. Residues on a Crystallographic Twofold Axis.
Supplementary Material
Acknowledgments
We would like to thank Rick Faber for help in data collection and useful discussions and Sonia Anderson and Dean Malencik (Oregon State University) for performing the analytical ultracentrifugation experiments. The invaluable help rendered by the staff at the ALS (beamline 8.2.1), particularly Christine Trame, is also appreciated. The ALS is supported by the Director, Office of Science, Office of Basic Energy Sciences, Materials Sciences Division of the U.S. Department of Energy under Contract DE-AC03-76SF00098 at Lawrence Berkeley National Laboratory. This work was supported by a National Science Foundation grant (MCB-0488665) to L.M.C. and P.A.K. and in part by the National Research Initiative of the USDA Cooperative State Research, Education, and Extension Service (Grant 2001-35319-10017 to L.M.C.). This work was made possible in part by the Proteins and Nucleic Acids Core Facility of the Environmental Health Sciences Center at Oregon State University (National Institute of Environmental Health Science Grant P30 ES00210).
The author responsible for distribution of materials integral to the findings presented in this article in accordance with the policy described in the Instructions for Authors (www.plantcell.org) is: P. Andrew Karplus (karplusp@science.oregonstate.edu).
Online version contains Web-only data.
Article, publication date, and citation information can be found at www.plantcell.org/cgi/doi/10.1105/tpc.105.034918.
References
- Anderson, J.A., Effertz, R.J., Faris, J.D., Francl, L.J., Meinhardt, S.W., and Gill, B.S. (1999). Genetic analysis of sensitivity to a Pyrenophora tritici-repentis necrosis-inducing toxin in durum and common wheat. Phytopathology 89, 293–297. [DOI] [PubMed] [Google Scholar]
- Ausio, J., Malencik, D.A., and Anderson, S.R. (1992). Analytical sedimentation studies of turkey gizzard myosin light chain kinase and telokin. Biophys. J. 61, 1656–1663. [DOI] [PMC free article] [PubMed] [Google Scholar]
- Ballance, G.M., Lamari, L., and Bernier, C.C. (1989). Purification and characterization of a host-selective necrosis toxin from Pyrenophora tritici-repentis. Physiol. Mol. Plant Pathol. 35, 203–213. [Google Scholar]
- Ballance, G.M., Lamari, L., Kowatsch, R., and Bernier, C.C. (1996). Cloning, expression and occurrence of the gene encoding the Ptr necrosis toxin from Pyrenophora tritici-repentis. Mol. Plant Pathol., http://www.bspp.org.uk/mppol/1996/1209ballance/.
- Baluška, F., Šamaj, J., Wojtaszek, P., Volkmann, D., and Menzel, D. (2003). Cytoskeleton-plasma membrane-cell wall continuum in plants. Emerging links revisited. Plant Physiol. 133, 482–491. [DOI] [PMC free article] [PubMed] [Google Scholar]
- Brunger, A.T., et al. (1998). Crystallography & NMR system: A new software suite for macromolecular structure determination. Acta Crystallogr. D Biol. Crystallogr. 54, 905–921. [DOI] [PubMed] [Google Scholar]
- Burmeister, W.P. (2000). Structural changes in a cryo-cooled protein crystal owing to radiation damage. Acta Crystallogr. D Biol. Crystallogr. 56, 328–341. [DOI] [PubMed] [Google Scholar]
- Canut, H., Carrasco, A., Galaud, J.P., Cassan, C., Bouyssou, H., Vita, N., Ferrara, P., and Pont-Lezica, R. (1998). High affinity RGD-binding sites at the plasma membrane of Arabidopsis thaliana links the cell wall. Plant J. 16, 63–71. [DOI] [PubMed] [Google Scholar]
- Ciuffetti, L.M., and Tuori, R.P. (1999). Advances in the characterization of the Pyrenophora tritici-repentis-wheat interaction. Phytopathology 89, 444–449. [DOI] [PubMed] [Google Scholar]
- Ciuffetti, L.M., Tuori, R.P., and Gaventa, J.M. (1997). A single gene encodes a selective toxin causal to the development of tan spot of wheat. Plant Cell 9, 135–144. [DOI] [PMC free article] [PubMed] [Google Scholar]
- Cowtan, K.D., and Zhang, K.Y. (1999). Density modification for macromolecular phase improvement. Prog. Biophys. Mol. Biol. 72, 245–270. [DOI] [PubMed] [Google Scholar]
- Debreczeni, J.E., Bunkoczi, G., Ma, Q., Blaser, H., and Sheldrick, G.M. (2003). In-house measurement of the sulfur anomalous signal and its use for phasing. Acta Crystallogr. D Biol. Crystallogr. 59, 688–696. [DOI] [PubMed] [Google Scholar]
- De Wolf, E.D., Effertz, R.J., and Francl, L.J. (1998). Vistas of tan spot research. Can. J. Plant Pathol. 20, 349–444. [Google Scholar]
- Dickinson, C.D., Veerapandian, B., Dai, X.P., Hamlin, R.C., Xuong, N.H., Ruoslahti, E., and Ely, K.R. (1994). Crystal structure of the tenth type III cell adhesion module of human fibronectin. J. Mol. Biol. 236, 1079–1092. [DOI] [PubMed] [Google Scholar]
- Diederichs, K., and Karplus, P.A. (1997). Improved R-factors for diffraction data analysis in macromolecular crystallography. Nat. Struct. Biol. 4, 269–275. [DOI] [PubMed] [Google Scholar]
- Dunlop, K.V., Irvin, R.T., and Hazes, B. (2005). Pros and cons of cryocrystallography: Should we also collect a room-temperature data set? Acta Crystallogr. D Biol. Crystallogr. 61, 80–87. [DOI] [PubMed] [Google Scholar]
- Effertz, R.J., Meinhardt, S.W., Anderson, J.A., Jordahl, J.G., and Francl, L.J. (2002). Identification of a chlorosis-inducing toxin from Pyrenophora tritici-repentis and the chromosomal location of an insensitivity locus in wheat. Phytopathology 92, 527–533. [DOI] [PubMed] [Google Scholar]
- Esnouf, R.M. (1999). Further additions to MolScript version 1.4, including reading and contouring of electron-density maps. Acta Crystallogr. D Biol. Crystallogr. 55, 938–940. [DOI] [PubMed] [Google Scholar]
- Faris, J.D., Anderson, J.A., Francl, L.J., and Jordahl, J.G. (1996). Chromosomal location of a gene conditioning insensitivity in wheat to a necrosis-inducing culture filtrate from Pyrenophora tritici-repentis. Phytopathology 86, 459–463. [Google Scholar]
- Gamba, F.M., Lamari, L., and Brûlé-Babel, A.L. (1998). Inheritance of race-specific necrotic and chlorotic reactions induced by Pyrenophora tritici-repentis in hexaploid wheats. Can. J. Plant Pathol. 20, 401–407. [Google Scholar]
- Hendrickson, W.A., and Teeter, M.M. (1981). Structure of the hydrophobic protein crambin determined directly from the anomalous scattering of sulphur. Nature 290, 107–113. [DOI] [PMC free article] [PubMed] [Google Scholar]
- Holm, L., and Sander, C. (1998). Touring protein fold space with Dali/FSSP. Nucleic Acids Res. 26, 316–319. [DOI] [PMC free article] [PubMed] [Google Scholar]
- Hynes, R.O. (2002). Integrins: Bidirectional, allosteric signaling machines. Cell 110, 673–687. [DOI] [PubMed] [Google Scholar]
- Jones, T.A., Zou, J.Y., Cowan, S.W., and Kjeldgaard, M. (1991). Improved methods for building protein models in electron density maps and the location of errors in these models. Acta Crystallogr. A 47 (Pt 2), 110–119. [DOI] [PubMed] [Google Scholar]
- Jung, J., and Lee, B. (2001). Circularly permuted proteins in the protein structure database. Protein Sci. 10, 1881–1886. [DOI] [PMC free article] [PubMed] [Google Scholar]
- Kabsch, W., and Sander, C. (1983). Dictionary of protein secondary structure: Pattern recognition of hydrogen-bonded and geometrical features. Biopolymers 22, 2577–2637. [DOI] [PubMed] [Google Scholar]
- Karplus, P.A., and Faerman, C. (1994). Ordered water in macromolecular structure. Curr. Opin. Struct. Biol. 4, 770–776. [Google Scholar]
- Kleywegt, G.J., and Brunger, A.T. (1996). Checking your imagination: Applications of the free R value. Structure 4, 897–904. [DOI] [PubMed] [Google Scholar]
- Kleywegt, G.J., and Jones, T.A. (1996). Phi/psi-chology: Ramachandran revisited. Structure 4, 1395–1400. [DOI] [PubMed] [Google Scholar]
- Kohorn, B.D. (2000). Plasma membrane-cell wall contacts. Plant Physiol. 124, 31–38. [DOI] [PMC free article] [PubMed] [Google Scholar]
- Kraulis, P.J. (1991). MOLSCRIPT: A program to produce both detailed and schematic plots of protein structure. J. Appl. Crystallogr. 24, 946–950. [Google Scholar]
- Laue, T.M., Shah, B.D., Ridgeway, T.M., and Pelletier, S.L. (1992). Computer-aided interpretation of analytical sedimentation data for proteins. In Analytical Ultracentrifugation in Biochemistry and Polymer Science, S.E. Harding, A.J. Rowe, and J.C. Horton, eds (Cambridge, UK: Royal Society of Chemistry), pp. 90–125.
- Leahy, D.J., Hendrickson, W.A., Aukhil, I., and Erickson, H.P. (1992). Structure of a fibronectin type III domain from tenascin phased by MAD analysis of the selenomethionyl protein. Science 258, 987–991. [DOI] [PubMed] [Google Scholar]
- Luzzati, V. (1952). Traitement statistique des erreurs dans la determination des structures cristallines. Acta Crystallogr. 5, 802–810. [Google Scholar]
- Manning, V.A., Andrie, R.M., Trippe, A.F., and Ciuffetti, L.M. (2004). Ptr ToxA requires multiple motifs for complete activity. Mol. Plant Microbe Interact. 17, 491–501. [DOI] [PubMed] [Google Scholar]
- Manning, V.A., and Ciuffetti, L.M. (2005). Localization of Ptr ToxA produced by Pyrenophora tritici-repentis reveals protein import into wheat mesophyll cells. Plant Cell 17, 3203–3212. [DOI] [PMC free article] [PubMed] [Google Scholar]
- Marjomäki, V., Pietiainen, V., Matilainen, H., Upla, P., Ivaska, J., Nissinen, L., Reunanen, H., Huttunen, P., Hyypiä, T., and Heino, J. (2002). Internalization of echovirus 1 in caveolae. J. Virol. 76, 1856–1865. [DOI] [PMC free article] [PubMed] [Google Scholar]
- McDonald, I.K., and Thornton, J.M. (1994). Satisfying hydrogen bonding potential in proteins. J. Mol. Biol. 238, 777–793. [DOI] [PubMed] [Google Scholar]
- Meinhardt, S.W., Cheng, W., Kwon, C.Y., Donohue, C.M., and Rasmussen, J.B. (2002). Role of the arginyl-glycyl-aspartic motif in the action of Ptr ToxA produced by Pyrenophora tritici-repentis. Plant Physiol. 130, 1545–1551. [DOI] [PMC free article] [PubMed] [Google Scholar]
- Meinhardt, S.W., Zhang, H., Effertz, R.J., and Francl, L.J. (1998). Characterization of additional peaks of necrosis activity from Pyrenophora tritici-repentis. Can. J. Plant Pathol. 20, 436–437. [Google Scholar]
- Mellersh, D.G., and Heath, M.C. (2001). Plasma membrane-cell wall adhesion is required for expression of plant defense responses during fungal penetration. Plant Cell 13, 413–424. [DOI] [PMC free article] [PubMed] [Google Scholar]
- Memmo, L.M., and McKeown-Longo, P. (1998). The alphavbeta5 integrin functions as an endocytic receptor for vitronectin. J. Cell Sci. 111, 425–433. [DOI] [PubMed] [Google Scholar]
- Merritt, E.A., and Bacon, D.J. (1997). Raster3D: Photorealistic molecular graphics. Methods Enzymol. 277, 505–524. [DOI] [PubMed] [Google Scholar]
- Murshudov, G.N., Vagin, A.A., and Dodson, E.J. (1997). Refinement of macromolecular structures by the maximum-likelihood method. Acta Crystallogr. D Biol. Crystallogr. 53, 240–255. [DOI] [PubMed] [Google Scholar]
- Murzin, A.G. (1998). Probable circular permutation in the flavin-binding domain. Nat. Struct. Biol. 5, 101. [DOI] [PubMed] [Google Scholar]
- Murzin, A.G., Brenner, S.E., Hubbard, T., and Chothia, C. (1995). SCOP: A structural classification of proteins database for the investigation of sequences and structures. J. Mol. Biol. 247, 536–540. [DOI] [PubMed] [Google Scholar]
- Otwinowski, Z. (1991). Maximum likelihood refinement of heavy atom parameters. In Proceedings of the CCP4 Study Weekend, W. Wolf, P.R. Evans, and A.G.W. Leslie, eds (Warrington, UK: Daresbury Laboratory), pp. 80–86.
- Otwinowski, Z., and Minor, W. (1997). Processing of X-ray diffraction data collected in oscillation mode. Methods Enzymol. 276, 307–326. [DOI] [PubMed] [Google Scholar]
- Pellenc, D., Schmitt, E., and Gallet, O. (2004). Purification of a plant cell wall fibronectin-like adhesion protein involved in plant response to salt stress. Protein Expr. Purif. 34, 208–214. [DOI] [PubMed] [Google Scholar]
- Perkins, S.J. (1986). Protein volumes and hydration effects. The calculations of partial specific volumes, neutron scattering matchpoints and 280-nm absorption coefficients for proteins and glycoproteins from amino acid sequences. Eur. J. Biochem. 157, 169–180. [DOI] [PubMed] [Google Scholar]
- Perrakis, A., Morris, R., and Lamzin, V.S. (1999). Automated protein model building combined with iterative structure refinement. Nat. Struct. Biol. 6, 458–463. [DOI] [PubMed] [Google Scholar]
- Russell, T.R., Demeler, B., and Tu, S.C. (2004). Kinetic mechanism and quaternary structure of Aminobacter aminovorans NADH:flavin oxidoreductase: An unusual flavin reductase with bound flavin. Biochemistry 43, 1580–1590. [DOI] [PubMed] [Google Scholar]
- Schneider, T.R., and Sheldrick, G.M. (2002). Substructure solution with SHELXD. Acta Crystallogr. D Biol. Crystallogr. 58, 1772–1779. [DOI] [PubMed] [Google Scholar]
- Senchou, V., Weide, R., Carrasco, A., Bouyssou, H., Pont-Lezica, R., Govers, F., and Canut, H. (2004). High affinity recognition of a Phytophthora protein by Arabidopsis via an RGD motif. Cell. Mol. Life Sci. 61, 502–509. [DOI] [PMC free article] [PubMed] [Google Scholar]
- Springer, T.A., and Wang, J.H. (2004). The three-dimensional structure of integrins and their ligands, and conformational regulation of cell adhesion. Adv. Protein Chem. 68, 29–63. [DOI] [PubMed] [Google Scholar]
- Stock, W.S., Brûlé-Babel, A.L., and Penner, G.A. (1996). A gene for resistance to a necrosis-inducing isolate of Pyrenophora tritici-repentis located on 5BL of Triticum aestivum cv. Chinese spring. Genome 39, 598–604. [DOI] [PubMed] [Google Scholar]
- Strelkov, S., Lamari, L., Ballance, G.M., and Orolaza, N.P. (1998). Isolation and mode of action of PTR chlorosis toxin from Pyrenophora tritici-repentis. In Molecular Genetics of Host-Specific Toxins in Plant Disease, K. Kohmoto and O.C. Yoder, eds (Dordrecht, The Netherlands: Kluwer Academic Publishers), pp. 137–138.
- Strelkov, S.E., and Lamari, L. (2003). Host-parasite interaction in tan spot [Pyrenophora tritici-repentis] of wheat. Can. J. Plant Pathol. 25, 339–349. [Google Scholar]
- Takagi, J., Strokovich, K., Springer, T.A., and Walz, T. (2003). Structure of integrin alpha5beta1 in complex with fibronectin. EMBO J. 22, 4607–4615. [DOI] [PMC free article] [PubMed] [Google Scholar]
- Tomas, A., Feng, G.H., Reeck, G.R., Bockus, W.W., and Leach, J.E. (1990). Purification of a cultivar-specific toxin from Pyrenophora tritici-repentis, causal agent of tan spot of wheat. Mol. Plant Microbe Interact. 3, 221–224. [Google Scholar]
- Tuori, R.P., Wolpert, T.J., and Ciuffetti, L.M. (1995). Purification and immunological characterization of toxic components from cultures of Pyrenophora tritici-repentis. Mol. Plant Microbe Interact. 8, 41–48. [DOI] [PubMed] [Google Scholar]
- Tuori, R.P., Wolpert, T.J., and Ciuffetti, L.M. (2000). Heterologous expression of functional Ptr ToxA. Mol. Plant Microbe Interact. 13, 456–464. [DOI] [PubMed] [Google Scholar]
- Walton, J.D. (1996). Host-selective toxins: Agents of compatibility. Plant Cell 8, 1723–1733. [DOI] [PMC free article] [PubMed] [Google Scholar]
- Wickham, T.J., Mathias, P., Cheresh, D.A., and Nemerow, G.R. (1993). Integrins αvβ3 and αvβ5 promote adenovirus internalization but not virus attachment. Cell 73, 309–319. [DOI] [PubMed] [Google Scholar]
- Wolpert, T.J., Dunkle, L.D., and Ciuffetti, L.M. (2002). Host-selective toxins and avirulence determinants: What's in a name? Annu. Rev. Phytopathol. 40, 251–285. [DOI] [PubMed] [Google Scholar]
- Xiao, T., Takagi, J., Coller, B.S., Wang, J.H., and Springer, T.A. (2004). Structural basis for allostery in integrins and binding to fibrinogen-mimetic therapeutics. Nature 432, 59–67. [DOI] [PMC free article] [PubMed] [Google Scholar]
- Xiong, J.P., Stehle, T., Zhang, R., Joachimiak, A., Frech, M., Goodman, S.L., and Arnaout, M.A. (2002). Crystal structure of the extracellular segment of integrin αvβ3 in complex with an Arg-Gly-Asp ligand. Science 296, 151–155. [DOI] [PubMed] [Google Scholar]
- Zhang, H., Francl, L.J., Jordahl, J.G., and Meinhardt, S.W. (1997). Structural and physical properties of a necrosis-inducing toxin from Pyrenophora tritici-repentis. Phytopathology 87, 154–160. [DOI] [PubMed] [Google Scholar]
- Zubieta, C., Schoehn, G., Chroboczek, J., and Cusack, S. (2005). The structure of the human adenovirus 2 penton. Mol. Cell 17, 121–135. [DOI] [PubMed] [Google Scholar]
Associated Data
This section collects any data citations, data availability statements, or supplementary materials included in this article.