Abstract
Testing molecular interactions is an ubiquitous need in modern biology and molecular medicine. Here, we present a qualitative and quantitative method rooted in the basic properties of the scattering of light, enabling detailed measurement of ligand-receptor interactions occurring on the surface of colloids. The key factor is the use of receptor-coated nanospheres matched in refractive index with water and therefore optically undetectable (“phantom”) when not involved in adhesion processes. At the occurrence of ligand binding at the receptor sites, optically unmatched material adsorbs on the nanoparticle surface, giving rise to an increment in their scattering cross section up to a maximum corresponding to saturated binding sites. The analysis of the scattering growth pattern enables extracting the binding affinity. This label-free method has been assessed through the determination of the binding constant of the antibiotic vancomycin with the tripeptide l-Lys-d-Ala-d-Ala and of the vancomycin dimerization constant. We shed light on the role of chelate effect and molecular hindrance in the activity of this glycopeptide.
Keywords: binding affinity, nanoparticles, vancomycin, ligand-receptor recognition
The formation of supramolecular complexes, involving interactions between biologically relevant macromolecules through noncovalent reversible bindings, is one of the most intensely investigated interdisciplinary topics today. Specifically, the evaluation and quantification of lock-and-key molecular interactions is of paramount importance in modern biology and molecular medicine. Traditional UV, mass and NMR spectroscopies, microcalorimetry, and several surface-sensitive techniques (e.g., evanescent wave spectroscopies, ellipsometry, and quartz crystal microbalance technique) allow the investigation of these complex and often cooperative binding events. As each of these techniques provides information on different aspects of the interactions, but not a complete description of the phenomena at play (refs. 1-3 and references therein), there is a continuous exploration for new methodologies capable of detecting and measuring binding affinities. Recent examples exploit the dispersion of colloids, either by detecting the adhesion of sedimented microspheres (4) or inducing interactions or spectral changes in suspensions of nanoparticles (ref. 5 and references therein). Here, we present a tool based on the high sensitivity offered by the measurement of scattered light intensity (I) when the binding occurs on the surface of index-matched colloids.
Although broadly used in a large variety of contexts, light scattering has never been applied to measure binding affinities in biomolecular interactions (6). As a matter of fact, binding of insulated ligands and receptors in dilute solutions produces a negligible increment of scattered light, and the use of mesoscopic particles hosting multiple receptors or ligands, including real bacteria, is typically of little help because particles generally scatter too much light compared with the contributions caused by molecular adhesion on their surface. We have found that this difficulty can be overcome by supporting the receptors on nanoscale latex spheres whose refractive index closely matches the one of water, a feature that makes them hard to detect with commercial light-scattering particle sizers. To this aim, we used highly hydrophobic nanocolloids, easily covered, by lipophilic interaction, with suitable ligands and/or receptors for the study of reversible interactions and adhesion processes. The dispersed phantom scatterer (DPS) technique we describe allows very sensitive quantitative measurements, so far accessible only with surface sensing techniques, such as the widespread technology based on surface plasmon resonance (SPR).
Methods
Phantom Nanoparticles (PnP) Dispersion. PnP are, in the experiment reported here, monodisperse spherical fluoroelastomer colloids kindly provided by Solvay-Solexis (Bollate, Italy), having radius R = 39 ± 1 nm, as determined by dynamic light scattering. Before any use and characterization, we thoroughly dialyzed the particles to remove physisorbed molecules from the surface. The refractive index of the particles, determined by measurements at the Abbe refractometer in dispersion having various volume fraction φ of colloids, is, at our working temperature (T = 30°C) and wavelength (λ = 633 nm), np0 = 1.3248. Despite their hydrophobicity, the particles are stable against aggregation, because they bear electric charges. By adsorbing cationic surfactants, and detecting the aggregation threshold, we estimated the charge to be ≈103 e- per particle. The particles have been dispersed, in a concentration of φ = 10-3 vol, in a 5-mmol phosphate buffer, pH 7.2. Determination of PnP concentrations was performed through density measurements by exploiting the high density (ρ ≈ 2.1 g/cm3) of the material.
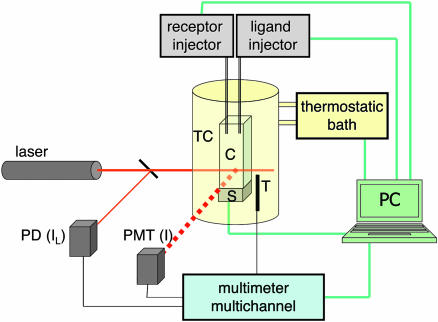
Static Light Scattering. Ninety-degree angle polarized scattered light from a 5-mW HeNe laser beam was collected and measured with a RCA 931B photomultiplier. We used conventional spectrophotometer cuvettes held in a suitably designed cell holder provided by a ministirrer, the necessary tubing holding, and water flow to control the temperature, in turn measured by a thermistor. Measurements were performed at 30°C. Surfactants, receptors, and ligands were injected by motorized pumps [Kent Scientific (Torrington, CT) Genie syringe pump and Ismatec (Glattbrugg, Switzerland) Reglo piston precision pump]. Stirring, temperature, and injections were controlled by a computer, through a suitable interface designed ad hoc to program DPS experiments. Experiments were taken by a programmed sequence of injection, stirring, and data acquisition. Typically, each data point is referred to an addition of a few microliters of a surfactant, ligand, or receptor solution to the cuvette initially containing 1.5 cm3 of bare PnP dispersion. Any injection was typically followed by 10 min of stirring. Sets of ≈100 independent I acquisitions were taken for each condition and analyzed to eliminate, in the averaging process, possible contributions caused by dust particles in the dispersion. Fig. 1 shows a scheme of the experiment set-up.
Fig. 1.
Schematic representation of the experimental set-up. The reference intensity of the laser beam (IL) is detected by a photodiode (PD), and the scattered I is detected by a photomultiplier (PMT). The cell (C) is placed, at contact with a magnetic stirrer (S), into a thermostatic chamber (TC), whose temperature is measured by a thermistor (T). Interfaces connect a computer (PC) with the receptor and ligand injectors, with the thermostatic bath and a multimeter, in turn measuring IL, I, and T.
Material for PnP Coverage. Inert intercalating surfactants, C12E5, dodecyl β-maltoside (DβM), Triton X-114, Brij 56, and palmitoyl sulfobetaine were purchased from Fluka, and lysophosphatidylcholine was purchased from Sigma. Receptor compounds were synthesized. In compound αN-acetyl-l-Lys-d-Ala-d-Ala (KdAdA)-1, the peptide KdAdA was linked to the amphiphilic ω-carboxyl-modified commercial surfactant Brij 56 through an amidic bond involving the ε-amino group of the αN-acetyl-Lys residue, whereas in compound KdAdA-2 the same tripeptide was connected to the shorter surfactant triethylene glycol dodecyl ether. A αN-acetyl-Lys-l-Ala-l-Ala (KlAlA) linked to the triethylene glycol dodecyl ether was also prepared. Details on the preparation of compounds involved in the recognition phenomena, namely KdAdA-1, KdAdA-2, and the short-chain-linked KlAlA, are described in Supporting Text, which is published as supporting information on the PNAS web site. Vancomycin (Van) was purchased from Aldrich.
Dynamic Light Scattering. Measurements of the I autocorrelation functions were nonroutinely but periodically taken to ensure that the PnP were monomerically dispersed in various stages of the adsorption curves. The data were taken by using a frequency-doubled 532-nm, 150-mW NdYag laser and through a single mode fiber collection of the scattered light. Cross-correlations were calculated with a BI-9000 digital correlator (BI, Holtsville, NY), after the collected I was divided by a 50/50 fiber beam splitter.
Results
PnP as Probes of Molecular Interactions. The method relies primarily on the physical and chemical properties of the nanocolloids used as probes. We have used hydrophobic spherical fluoroelastomer colloids having radius R ≈ 40 nm and refractive index, at our working temperature and wavelength, np0 = 1.3248. Because, under the same conditions, the refractive index of water is nw = 1.3319, such colloids act as PnP, their scattering cross section being at least 3 orders of magnitude less than ordinary commercial polystyrene latex spheres. These PnP are charge-stabilized because of a low density of ionizable anionic terminal groups of the polymeric chains.
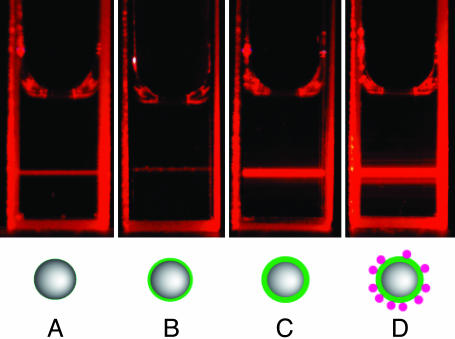
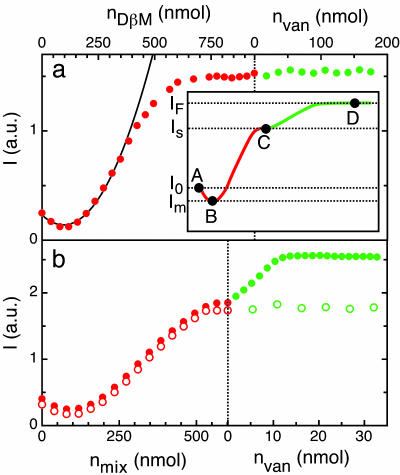
Surfactants added to a PnP dispersion readily adsorb on their hydrophobic surfaces, generating a self-assembled monolayer, and effectively increase the optical polarizability of these particles, inducing a large change, typically of 1 order of magnitude, in the amount of scattered light (7, 8). Figs. 2 and 3a (red dots) show the amplitude of the light I scattered at 90° by a suspension of PnP having volume fraction φ = 10-3, upon adding a surfactant, namely the simple alkyl glycoside DβM. The progressive growth of the adsorbed surfactant monolayer results in a decrease of I from the initial value I0 (state A in Figs. 2 and 3) to a minimum Im (state B) corresponding to a perfect optical matching of the partially coated particles with water, followed by a remarkable increase of the signal saturating at a value Is (state C) corresponding to full coverage. In general, we found that when different molecular species were added to a dispersion of bare PnP, the scattered I varies along a similar pattern as a function of the total amount of molecules either adsorbed on the PnP surface or bound to adsorbed molecules. These observations can be accounted for in the weak scattering Rayleigh-Gans regime (9). Accordingly, the scattered I of PnP particles coated by layers of various molecular species (A1, A2, and A3) is given by
 |
[1] |
where a is a constant related to the experiment design, vP the volume of the particle, and ΔnP,w the difference between particle's and water squared refractive indices. Analogously, vx and Δnx,w, with x = A1, A2, and A3, are the adsorbed volumes and the difference of the squared refractive indices of each specie that adsorb on the particle and water, respectively. The appropriateness of this description is confirmed by the parabolic behavior of I (line in Fig. 3a, with A1 = DβM, and no A2 and A3). Analysis of the data in terms of Eq. 1 allowed an extremely precise detection of the growth of the adsorbed monolayer. This methodology to detect surfactant coating was tested with a number of commercial or synthetic amphiphiles (see Fig. 6, which is published as supporting information on the PNAS web site).
Fig. 2.
Naked-eye observation of the I of scattered light when different amounts of material are adsorbed on the PnP, as depicted in the schematic representations. (A) Bare nanoparticles. (B) Adsorption of the specific amount of surfactant necessary for perfect optical matching of particles with water (residual scattering comes from dust). (C) Complete coverage of the nanoparticles with a surfactant monolayer, part of which functionalized with receptors. (D) Adhesion of ligands on the monolayer caused by the specific binding to receptors.
Fig. 3.
Light-scattering measurements of interaction between Van and functionalized PnP. Scattered light I of a PnP dispersion as a function of the added amount of surfactant, receptors, and ligands. nVan, nDβM, and nmix indicate the molar content of, respectively, Van, DβM, and two different 98.2/1.8 (mol ratio) mixtures of DβM with compound KdAdA or compound KlAlA. (a) Data obtained by adding increasing volumes of 10 mM solution of DβM (full red dots) and 5 mM Van solution (full green dots). Black line represents a parabolic fit to I at low coverage. (b) Data obtained by adding increasing volumes of 10 mM mixture of DβM and KdAdA-1 (full red dots) or 10 mM mixture of DβM and KlAlA (open red dots). The addition of Van to KdAdA ligand results in an increase of I up to a saturated value (full green dots), whereas KlAlA ligand prevents the Van recognition (open green dots). (Inset) Schematic representation of I as a function of the concentration of added surfactant (red line) and Van (green line); the positions A, B, C, and D, together with the corresponding I values (I0, Im, IS, and IF), match the sequence of pictures in Fig. 2.
The self-assembling of amphiphilic monolayers at the particle hydrophobic surface has been exploited to provide the PnP with various categories of receptors (compound A2 in Eq. 1), by synthesizing new amphiphilic molecules bearing suitable reactive groups at their hydrophilic ends. PnP coated by mixtures of receptor-acting amphiphiles and nonbinding amphiphiles (causing a scattered IS, see Fig. 3a Inset), are then used as dispersed nanoprobes of molecular interactions. Indeed, addition of partner ligands (compound A3) to a receptor-coated PnP solution yielded, after a transient, to an equilibrium condition of partly associated ligand-receptor pairs. The binding of ligands on the receptors anchored on the PnP surface corresponded to an additional adsorption of mass on top of the surfactant monolayer and consequently gave rise to a further increase of the scattered I (state D in Fig. 2), which proceeds up to a saturated value (IF). The saturation indicates the lack of available empty binding sites on the PnP. The volume of bound ligand can be easily obtained from the I measurements by computing the ratio R
 |
[2] |
In turn, the dependence of R on cA3, the total amount of ligand added to the dispersion, can be compared with the expected Langmuir isotherm for first- or higher-order binding process to extract the binding constant Kb, the valence of the receptor, and the total adsorbed mass. This is the essence of the DPS technique.
Interaction Between Van and Peptide Receptors. To assess this method we investigated the interactions between the glycopeptidic antibiotic Van and its peptidic receptor, measuring the binding constants and determining the role of the molecular environment neighboring the ligands in the formation of monomeric vs. dimeric complexes.
The mechanism of action of Van and a number of Van-like antibiotics against the cell wall of Gram-positive bacteria has been thoroughly investigated (10-12). The binding site of Van recognizes peptidoglycans terminating in the tripeptide KdAdA), establishing a specific interaction. It has also been demonstrated that Van tends to generate weak back-to-back dimers and that both the binding and the dimerization constants are reciprocally affected by cooperative interactions (13). Consequently, it has been proposed that dimers' divalency is important in the antibiotic action of Van (14-16).
To investigate the interaction of Van with models of bacterial cell walls, three different tripeptide-surfactants (KdAdA-1, KdAdA-2, and KlAlA) were synthesized as described in Methods. PnP were coated by a monolayer in the largest part made of DβM (A1), with a small fraction (0.5-2%) of amphiphilic molecules (A2) bearing the C-terminal tripeptide. PnP thus prepared, each carrying from 1,000 to 3,000 receptor moieties, were used as model nanobacteria to evaluate antibiotic specificity and binding strength of Van (A3).
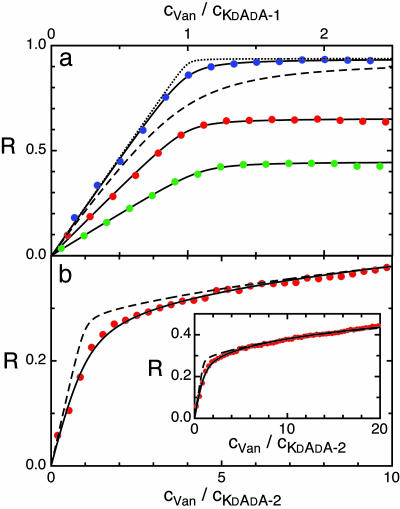
In Fig. 3a (green dots), the constancy of I during the addition of Van to the dispersion of PnP previously coated with DβM indicates that no aspecific binding occurred. Fig. 3b shows I measured after adding Van (full green dots) to a PnP dispersion previously coated with a 98.2/1.8 mixture of DβM with KdAdA-1 (full red dots). Careful determination of the hydrodynamic radius by dynamic light scattering confirmed that here, as in all of the data presented in this article, PnP were monomerically dispersed. Fig. 4a shows the growth of R calculated from the data in Fig. 3 as the Van concentration cVan is increased, in solutions differing in the amount of peptidic receptors on the PnP surface, and thus in the overall concentration cKdAdA-1. In all curves R displays an initial linear increase followed by a roll-off as cVan/cKdAdA-1 ≈ 1, indicating monovalent interaction. R(cKdAdA-1) is very well represented by a simple first-order binding process characterized by a single binding constant Kb. The lines in Fig. 4a are the best-fit to a Langmuir isotherm (17) in which Kb and the asymptotic value of R at large cVan are the only fitting parameters. The quality of the fits clearly indicates that our description is adequate. The values of the binding constant, Kb = 1.0 ± 0.2 × 10⁷ M-1, obtained from DPS with the different surface density of ligands, are larger than previous determinations of the same quantity by other techniques, such as UV difference spectroscopy (Kb = 1.5 × 10⁶ M-1) (18), affinity capillary electrophoresis (Kb = 4.1 × 10⁵ M-1) (19), and SPR technology (Kb = 1.4 × 10⁶ M-1) (20). Two isotherms with Kb = 106 M-1 and Kb = 108 M-1 are also shown in Fig. 4a. Comparison of the data demonstrates that the large Kb cannot be attributed to experimental uncertainty.
Fig. 4.
Binding isotherms of Van on PnP with various monolayer coatings. (a) R values plotted as a function of the ratio between the concentration of Van (cVan) and the compound KdAdA(cKdAdA-1). The three continuous lines are the best-fit with first-order Langmuir isotherms on data corresponding to different numbers of peptide receptor: ≈1,200 (green dots), 1,800 (red dots), and 2,400 (blue dots) per particle. The obtained values of Kb are 12.3, 9.91, and 8.37 × 10⁶ M-1, respectively. Dashed and dotted lines represent Langmuir isotherms with Kb = 106 and 108, respectively. (b) R values plotted as a function of the ratio between the concentrations of Van and of the compound KdAdA-2 (cKdAdA-2). The continuous line represents the best-fit with a second-order binding process (dimeric adhesion) on PnP, each carrying ≈1,800 KdAdA-2 molecules, yielding Kb = 7.46 × 10⁵ M-1 and KD = 7,180 M-1. The dashed line represents a second-order process with Kb = 107 and KD = 7,180 M-1. (Inset) The same figure on a larger cVan/cKdAdA-2 scale.
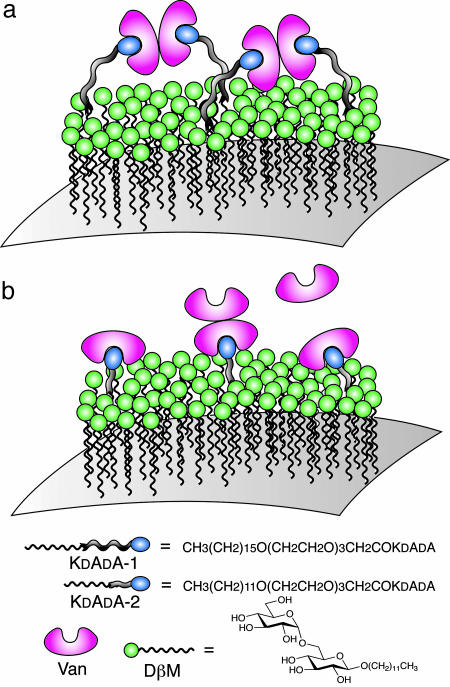
Role of Van Dimerization Affinity. The unexpectedly high value of Kb reported here can be understood in the light of the tendency of Van to dimerize and the resulting binding strengthening. The tendency of Van to dimerize was actually manifest in our measurement, because when Van was added to suspensions in which the surface density of KdAdA was >4%, PnP showed a tendency to aggregate. The absence of PnP aggregation in our working condition, together with the fact that the bound Van was 1:1 with respect to the PnP-receptor sites, suggests a dimerization of pairs of bound Van on PnP surface caused by back-to-back interactions (21), allowed by the long stems bearing the receptors (Fig. 5a). This process, although undetected by adsorbed mass measurements, is relevant in the binding process, because the binding of dimerizing glycopeptides to a transglycosylation site displays a binding constant significantly larger than the related monomeric adhesion, a situation reminiscent of the chelate effect (15). This mechanism is compatible with the geometry of KdAdA-1 and the intrinsic mobility of receptors in the self-assembled monolayer on the PnP. However, the chelate effect is intrinsically unachievable either in experiments where ligands and receptors are in solution (e.g., UV methods) (14) or when the surface constraints do not allow for dimerization as in the case of receptors covalently linked on sensor chips (22, 23). Indeed, the Van-KdAdA interaction remarkably changes its apparent properties when KdAdA-1 is replaced with KdAdA-2, in which the receptors are connected to a shorter spacer length, thus constraining ligand-receptor interaction to take place in the proximity of the DβM layer (Fig. 5b). The results, reported in Fig. 4b (full dots), show a marked change of slope as Van was added to the dispersion when cVan/cKdAdA-2 ≈ 1. This observation can be interpreted in terms of weak Van tendency to dimerize through an adhesion between a surface-bound Van molecule and a second Van free in solution (Fig. 5b). The data have been fitted with a second-order Langmuir expected by combining Van-KdAdA-2 binding (Kb) and Van-Van dimerization (KD). Because the receptor's concentration is known from the preparation, the fitting procedure involves Kb, KD, and one coefficient for the amplitude of the signal. The best-fit is in close agreement with the data and yields Kb = 7.5 ± 1.5 × 10⁵ M-1 and KD = 7,200 M-1. The value of KD, larger than the very loose binding constant of ≈700 M-1 for the back-to-back Van-Van dimer in solution (24), is a further indication of cooperative binding. We interpret this Kb value, in a much better agreement with the literature data, as the “true” binding coefficient for the monomeric adhesion of Van to KdAdA. Noteworthy, the shape of the curve relative to the Van-KdAdA binding kinetics reported in SPR experiments using self-assembled monolayers on the sensor chip (25) shows a change of slope analogous to our data. Indeed, this analogy reflects the physical properties of the surfaces: in both cases receptors and inactive surfactant molecules have roughly the same length. The remarkable difference between the Kb values obtained in the measurements with KdAdA-1 and KdAdA-2 offers compelling evidence that the formation of tetramolecular clusters strongly enhances the affinity of Van to bacteria wall-like surfaces, thus confirming previous observations (26).
Fig. 5.
Schematic representation of the molecular arrangement on the PnP surface. The self-assembled monolayer is composed of DβM (as inert component) and KdAdA-1 (a) or KdAdA-2 (b). (a) The long molecular linker between the receptor and the hydrophobic anchor allows bidentate dimerization (chelation) of bound Van, thus accounting for a 1:1 ratio between Van and receptor numbers on the surface. (b) When a short stem connects hydrophobic tail and receptor, the Van internal dimerization is hampered by steric constrains, thus yielding a final ratio of Van/receptor >1:1.
Discussion
The DPS technique introduced here makes use of dispersed nanoparticles in a way that is radically different from other nanoparticle-based detection methods described in the literature (5). Nanoparticles in DPS are not meant to provide the signal to detect molecular interaction, as is the case for colorimetric and fluorescent probes, but rather they act instead as a nano-finely dispersed substrate.
Although DPS shares some basic physics with the most used surface-sensitive optical techniques for the measurement of reversible recognition processes, all detecting molecular interactions through dielectric constant variations in the proximity of the sensor surface, many of its features introduce several novelties. Because of the finely dispersed surfaces (there are ≈800 cm2 of surface in 1 ml of PnP suspension with φ = 10-3) and the well controlled geometry of the nanoparticles, DPS enables the quantitative measurement of binding processes, allowing the detection of ≈3 μg of matter per ml. This sensitivity, when expressed as adsorbated mass per surface, corresponds to 0.04 ng/mm2, on the same level of the best techniques available so far. The insight offered from the study of Van binding demonstrates the effectiveness of this technique. By exploiting the potential of light scattering for the precise quantitative determination of the adsorbed ligand mass, DPS appears particularly suitable for the study of adhesion processes in which significant clustering effects are involved, as when cooperative phenomena are at play. Concomitant dynamic light scattering detects undesired supramolecular aggregates or nonspecific interactions through the determination of the size of the particulate in suspension.
In comparison with the broadly used SPR technology, DPS has important differences in its basic approach. Whereas SPR relies on the detection of kinetic coefficients, whose ratio equals the affinity parameter, in the DPS technique every measurement is obtained when equilibrium is reached. Whereas SPR detects the binding at a surface limiting the experimental cell, DPS uses surfaces pervading the whole sample. The limiting factor in SPR is not the sensitivity of the method in detecting the molecular mass binding the sensor, which is indeed excellent, but rather the insurgence of artifacts. This fact appears clearly from the SPR association/dissociation curves, which normally are quite noiseless, but remarkably vary in shape. Examples are easily found in literature, even in the specific case of Van binding to peptidic moieties (27). Indeed, despite the specific interest in directly accessing kinetic processes, it is now clear that various artifacts affect the determination of adsorption and desorption kinetic coefficients, such as mass transport efficiency (strongly depending on the cell design), hindrance, and distribution of the binding sites on the substrate covering the sensor (“bulk effect”) (3). Although these effects delay both association and dissociation processes, it is not at all clear how much of the artifacts transfer in the determination of the binding coefficients. By working in equilibrium conditions, the DPS technique, while missing potentially interesting kinetic data, is, however, less affected by artifacts' sources. The detailed analysis of the binding curves enables us to distinguish between specific interactions, plateauing when the binding sites are saturated, and the formation of aspecific complexes. On the other hand, DPS is also affected by limitations. Extracting binding coefficients from DPS requires careful optimization of reaction conditions, such as PnP concentration, surface density of receptors, and buffer concentration, to prevent undesired aggregation phenomena, which would spoil the possibility of interpreting the data through the simple model yielding Eqs. 1 and 2.
For these reasons, DPS technique appears to have characteristics complementary to SPR as a modern tool for the study of specific reversible interactions in a variety of biological processes. We believe that this static light-scattering methodology will find applications well beyond the analysis of antibiotic or related interactions, branching into cell biology, drug discovery, or use as a powerful sensor for the precise characterization of drug delivery systems.
Supplementary Material
Acknowledgments
We thank Solvay Solexis for the generous gift of the perfluorinated colloids, M. Bassi for the crucial help in selecting the best polymer composition in the colloid formulation, and C. Marinzi and E. Valsecchi for help in the preparation of the receptor compounds. This work was supported by Fondo per gli Investimenti della Ricerca di Base, the Cariplo Foundation, and Regione Lombardia Misura D4.
Author contributions: D.P., L.P., and T.B. designed research; A.G. performed research; D.P., L.P., and S.R. contributed new products/analytic tools; F.M. and T.B. analyzed data; and D.P., L.P., and T.B. wrote the paper.
Conflict of interest statement: No conflicts declared.
This paper was submitted directly (Track II) to the PNAS office.
Abbreviations: DPS, dispersed phantom scatterer; SPR, surface plasmon resonance; PnP, phantom nanoparticles; DβM, dodecyl-β-maltoside; KdAdA, αN-acetyl-l-Lys-d-Ala-d-Ala; KlAlA, αN-acetyl-Lys-l-Ala-l-Ala; Van, vancomycin; I, scattered light intensity.
References
- 1.Cooper, M. A. (2003) Anal. Bioanal. Chem. 377, 834-842. [DOI] [PubMed] [Google Scholar]
- 2.Cooper, M. A. (2002) Nat. Rev. Drug Discov. 1, 515-528. [DOI] [PubMed] [Google Scholar]
- 3.Schuck, P. (1997) Annu. Rev. Biophys. Biomol. Struct. 26, 541-566. [DOI] [PubMed] [Google Scholar]
- 4.Baksh, M. M., Jaros, M. & Groves, J. T. (2004) Nature 427, 139-141. [DOI] [PubMed] [Google Scholar]
- 5.Rosi, N. L. & Mirkin, C. A. (2005) Chem. Rev. 105, 1547-1562. [DOI] [PubMed] [Google Scholar]
- 6.Mammen, M., Choi, S.-K. & Whitesides, G. M. (1998) Angew. Chem. Int. Ed. 37, 2754-2794. [DOI] [PubMed] [Google Scholar]
- 7.Piazza, R. & Degiorgio, V. (1992) Opt. Commun. 92, 45-49. [Google Scholar]
- 8.Bellini, T., Degiorgio, V., Mantegazza, F., Ajmone Marsan, F. & Scarnecchia, C. (1995) J. Chem. Phys. 107, 8228-8237. [Google Scholar]
- 9.van de Hulst, H. C. (1981) Light Scattering by Small Particles (Dover, New York).
- 10.Hubbard, B. K. & Walsh, C. T. (2003) Angew. Chem. Int. Ed. 42, 730-765. [DOI] [PubMed] [Google Scholar]
- 11.Nicolaou, K. C., Boddy, C. N., Bräse, S. & Winssinger, N. (1999) Angew. Chem. Int. Ed. 38, 2096-2152. [DOI] [PubMed] [Google Scholar]
- 12.Loll, P. J. & Axelsen, P. H. (2000) Annu. Rev. Biophys. Biomol. Struct. 29, 265-289. [DOI] [PubMed] [Google Scholar]
- 13.Rao, J., Yan, L., Xu, B. & Whitesides, G. M. (1999) J. Am. Chem. Soc. 121, 2629-2630. [Google Scholar]
- 14.Mackay, J. P., Gerhard, U., Beauregard, D. A., Maplestone, R. A. & Williams, D. H. (1994) J. Am. Chem. Soc. 116, 4573-4580. [Google Scholar]
- 15.Mackay, J. P., Gerhard, U., Beauregard, D. A., Westwell, M. S., Searle, M. S. & Williams, D. H. (1994) J. Am. Chem. Soc. 116, 4581-4590. [Google Scholar]
- 16.Loll, P. J., Bevivino, A. E., Korty, B. D. & Axelsen, P. H. (1997) J. Am. Chem. Soc. 119, 1516-1522. [Google Scholar]
- 17.Lyklema, J. (1995) Fundamentals of Interface and Colloid Science (Academic, London), Vol. II, pp. 2.1-2.91. [Google Scholar]
- 18.Nieto, M. & Perkins, H. R. (1971) Biochem. J. 123, 789-803. [DOI] [PMC free article] [PubMed] [Google Scholar]
- 19.Allen, N. E., LeTourneau, D. L. & Hobbs, J. N. (1997) J. Antibiot. 50, 677-684. [DOI] [PubMed] [Google Scholar]
- 20.Williams, D. H., Bardsley, B. & O'Brien, D. P. (2000) J. Chem. Soc. Perkin Trans. 2, 1681-1684. [Google Scholar]
- 21.Williams, D. H., Maguire, A. J., Tsuzuki, W. & Westwell, M. S. (1998) Science 280, 711-714. [DOI] [PubMed] [Google Scholar]
- 22.Cooper, M. A., Fiorini, M. T., Abell, C. & Williams, D. H. (2000) Bioorg. Med. Chem. 8, 2609-2616. [DOI] [PubMed] [Google Scholar]
- 23.O'Brien, D. P., Entress, R. M. H., Cooper, M. A., O'Brien, S. W., Hopkinson, A. & Williams, D. H. (1999) J. Am. Chem. Soc. 121, 5259-5265. [Google Scholar]
- 24.Gerhard, U., Mackay, J. P., Maplestone, R. A. & Williams, D. H. (1993) J. Am. Chem. Soc. 115, 232-237. [Google Scholar]
- 25.Cooper, M. A., Williams, D. H. & Cho, Y. R. (1997) Chem. Commun., 1625-1626.
- 26.O'Brien, S. W., Shiozawa, H., Zerella, R., O'Brien, D. P. & Williams, D. H. (2003) Org. Biomol. Chem. 1, 472-477. [DOI] [PubMed] [Google Scholar]
- 27.Cooper, M. A. & Williams, D. H. (1999) Chem. Biol. 6, 891-899. [DOI] [PubMed] [Google Scholar]
Associated Data
This section collects any data citations, data availability statements, or supplementary materials included in this article.


