

Abstract
Background
In publicly funded health care systems, the utilization of health care services should be equitable, irrespective of socioeconomic status (SES). Although the association between SES and health care utilization has been examined in Canada relative to surgical, cardiac and preventive health care services, no published studies have specifically explored the association between SES and diagnostic imaging.
Methods
We examined over 300 000 diagnostic imaging claims made in the Winnipeg Regional Health Authority between Apr. 1, 2001, and Mar. 31, 2002. Using patient postal codes, we assigned SES on the basis of average household incomes in Canada's 1996 census. Using multiple regression, we examined the association between income quintile, patient age group (≤16, 17–64, ≥ 65 years), patient morbidity level according to the Johns Hopkins University Adjusted Clinical Group method (high, moderate, low), and imaging modality (general radiology, vascular, computed tomography, magnetic resonance, and general and obstetric ultrasound).
Results
Relative rates (RR) of diagnostic imaging utilization (highest v. lowest income quintile) were significantly increased in pediatric and adult patient groups at all morbidity levels receiving general radiology (highest RR 2.47, 95% confidence interval [CI] 2.07–2.93); pediatric and adult patient groups at high and low morbidity levels and elderly patient groups at low morbidity levels receiving general ultrasound (highest RR 2.26, 95% CI 1.20–4.26); pediatric and adult patient groups at all morbidity levels and elderly patients at high and moderate morbidity levels receiving magnetic resonance imaging (highest RR 2.51, 95% CI 1.78– 3.52); and adult patient groups at all morbidity levels receiving computed tomography (highest RR 1.46, 95% CI 1.35– 1.59). A lower RR of diagnostic imaging utilization in the highest income quintile was found only among patients receiving obstetric ultrasound (RR 0.80, 95% CI 0.73–0.87). No significant associations were found among elderly patients receiving general radiology or computed tomography or adult patients receiving vascular imaging.
Interpretation
We found a pattern of increased diagnostic imaging utilization in patient groups with a higher SES. Further research is needed to better understand the nature of this finding and how it contributes to health outcomes.
The pillars of the Canada Health Act1 are that health care should be comprehensive, universal, accessible and publicly administered and that coverage should be portable between provinces. Acknowledging that health care is under provincial jurisdiction, the federal government provides provinces with financial incentives to realize these goals. As such, income level should have no effect on utilization of insured medical services. Despite this, Alter and colleagues2 have published Canadian data demonstrating that higher socioeconomic status (SES) was a significant predictor of angiography use in the first 90 days after acute myocardial infarction in a large cohort (n = 47 036). In contrast, Shortt and colleague3 reviewed over 39 000 elective surgeries conducted in 2 Ontario hospitals and found no difference in wait times between SES tertiles.
In Sweden in 1997 Olsson4 conducted a national survey of private and public hospitals that demonstrated large, unexpected variations in per capita utilization of CT and MRI that were not easy to explain in a country with a relatively homogenous, publicly funded health care system. Olsson postulated that these findings may have been due to regional variation in use, patient demographic characteristics, physician reimbursement patterns, physician research interests and “other sociodemographic factors.”
Frohlich and colleagues5 published Manitoba data demonstrating that the per capita utilization of CT was positively correlated (r = 0.61, p = 0.001) with premature mortality rates, which is the rate of death among people under the age of 70. The premature mortality rate is an indicator of morbidity and expected health care needs. However, an inverse relation was demonstrated for MRI (r = –0.45, p = 0.024), which indicated that factors other than expected health care needs may drive MRI utilization.
Apart from the studies cited above, a literature search (Ovid MEDLINE 1966 to June 4, 2003) found few studies on SES and specific diagnostic imaging modalities. Published studies tend to concentrate on diagnostic imaging screening programs such as mammography.6,7,8,9
We sought to explore the association between utilization of selected diagnostic imaging modalities and SES. We postulated that population groups with higher SES may demonstrate greater utilization of more sophisticated technologies such as CT and MRI, with the converse being true for less sophisticated diagnostic imaging modalities such as routine radiography or ultrasound. The rationale is that people in higher SES groups may be more likely to have a regular family physician, to be better educated about sophisticated imaging technologies and more assertive health care consumers, and to have better access to specialists who would refer them for imaging studies. The rationale for the converse relation is that poorer health status in lower SES groups may disproportionately affect the utilization of routine radiography and ultrasound procedures.
Methods
Manitoba Health maintains computerized records of physician services for persons eligible to receive health services in Manitoba. The Manitoba Centre for Health Policy houses these administrative data in the Population Health Research Data Repository. A unique anonymized personal health identification number allows for the creation of a longitudinal record of health service utilization and linkage of this record with the population registry. Health insurance registrants with a Winnipeg Regional Health Authority residential postal code were identified from the population registry, and their physician claims between Apr. 1, 2001, and Mar. 31, 2002, were extracted from the Repository. Rates of diagnostic imaging utilization were stratified by age: 16 years and younger (pediatric), 17–64 years (adult), and 65 years and older (elderly) for all modalities except for obstetric ultrasound, where a single age category of 12–59 years of age was selected (i.e., the reproductive age span).
Diagnostic imaging claims data demonstrating at least 90% concordance with institutional databases were included. A preliminary analysis indicated that only data from the Winnipeg Regional Health Authority, the major referral centre for Manitoba, met this criterion (population of about 618 475 in the 1996 Canada census). Nuclear medicine data from the Health Authority did not meet this validity criterion and were excluded. The claims for pediatric CT, MRI and vascular imaging were too few for analysis.
Diagnostic imaging tariffs were aggregated into general radiology, including radiographic and fluoroscopy procedures; vascular imaging, including diagnostic and therapeutic procedures performed by radiologists; CT, including diagnostic and related procedures (e.g., guided biopsy); MRI; general ultrasound, including all diagnostic and related procedures; and obstetric ultrasound, including dedicated fetal ultrasound exams, routine and diagnostic. General radiology and ultrasound served as indicators of less sophisticated diagnostic imaging services. CT and MRI procedures served as indicators of more sophisticated diagnostic imaging services.
Some diagnostic imaging services may entail multiple billable procedures (i.e., tariffs). Therefore only diagnostic imaging episodes were counted within each modality. An episode was defined as a single person receiving modality-related services on a single day. For example, if a person received multiple ultrasound procedures on a single day, the associated tariffs were counted only once.
Statistics Canada census data (20% sample) in the Repository were used to develop an income-based SES indicator. Income quintiles were derived from average household income for Manitoba enumeration areas from the 1996 census. Under this methodology, an individual's residential postal code was linked to an enumeration area. The areas were then ranked from poorest to wealthiest (as measured by mean household income of the population living in the area) and assigned to quintiles so that about 20% of the population was represented in each quintile. The income quintile for that enumeration area was then assigned to the individual registrant.
The Johns Hopkins University Adjusted Clinical Group method10,11 was used to develop an index of morbidity based on Ambulatory Diagnostic Groups. With this methodology, codes from the ICD-9-CM (International Classification of Diseases, 9th revision, clinical modification) are grouped into 32 Ambulatory Diagnostic Groups. Patients were stratified into 1 of 3 categories of morbidity on the basis of the number of Ambulatory Diagnostic Groups assigned to them from hospital separations and physician claims in the study year: low (0–2), moderate (3–5) and high (6 or more). The Ambulatory Diagnostic Group categories were developed using previous research and to ensure sufficient population counts in each group for the inferential analyses. A previous validation analysis12 demonstrated a strong linear relation between the number of Ambulatory Diagnostic Groups and premature mortality, an accepted indicator of community health service needs.
Regression analyses were used to model the relation between SES and diagnostic imaging utilization for population strata defined by age, morbidity level and income quintiles. For higher-frequency modalities the dependent variable was the natural logarithm of the stratum-specific episode rate for a given modality. Preliminary descriptive analyses revealed that the logarithm of the rate approximately followed a normal distribution for these modalities. A Poisson distribution13 was selected to model stratum-specific counts of the number of diagnostic imaging episodes for low-frequency modalities, which included obstetric ultrasound, MRI and vascular imaging. The natural logarithm of the population count for a stratum was used as an offset in these models. Separate models were defined for each age group.
All regression models included the main effects of sex, morbidity level and income quintile. With the exception of the model for obstetric ultrasound, all models also included the 2-way interaction of morbidity level and income quintile. The interaction term was included where descriptive plots of the data revealed that the effect of SES on use of diagnostic imaging services was not always constant across morbidity categories. For the modality for which the interaction was not included, there were too few episodes in some morbidity categories to permit this analysis. The ratio of the deviance to its degrees of freedom was used to assess model fit, and plots of residuals were used as diagnostic tools.
A single degree of freedom pairwise contrast was used to test for a significant difference in the rate of diagnostic imaging utilization between the lowest and highest income quintile. A linear trend contrast was also used to test for a monotonically increasing or decreasing rate of utilization across the income quintiles.
Relative rate (RR) estimates and 95% confidence intervals (CI) are presented for the pairwise contrasts, and p values are reported for the linear trends.
Ethics approval was obtained from the University of Manitoba Research Ethics Board and access to the data was granted by the Manitoba Health Information Privacy Committee.
Results
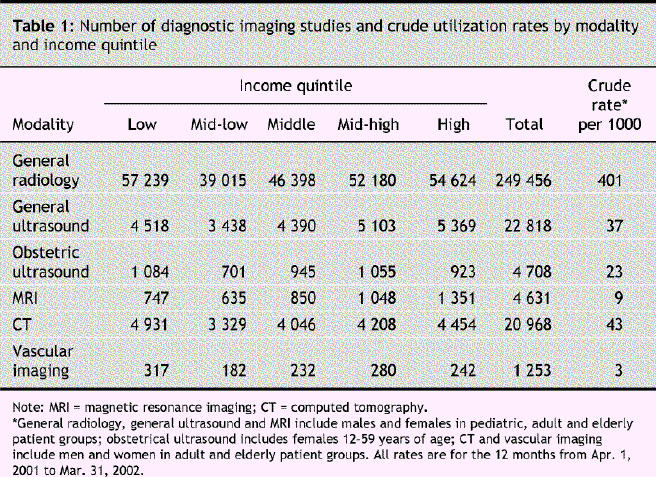
A total of 303 834 diagnostic imaging episodes were captured for the 12 months between Apr. 1, 2001, and Mar. 31, 2002 (Table 1). Most (82%) of these episodes were in general radiology. General ultrasound (7.5%), CT (7%), MRI (1.5%), obstetric ultrasound (1.5%) and vascular imaging (< 1%) comprised the remainder.
Table 1
RR estimates for each diagnostic imaging modality, stratified by age group and morbidity, are reported in Table 2. Of RR estimates, diagnostic imaging utilization was significantly higher in the highest income quintile than in the lowest income quintile for 20 of the analyses. This relation was weakest for vascular imaging. The converse was true for obstetric ultrasound. The linear trend concorded with these results. In some instances the association between SES and diagnostic imaging utilization rates was stronger as morbidity level increased (e.g., MRI and CT among adult patients).
Table 2
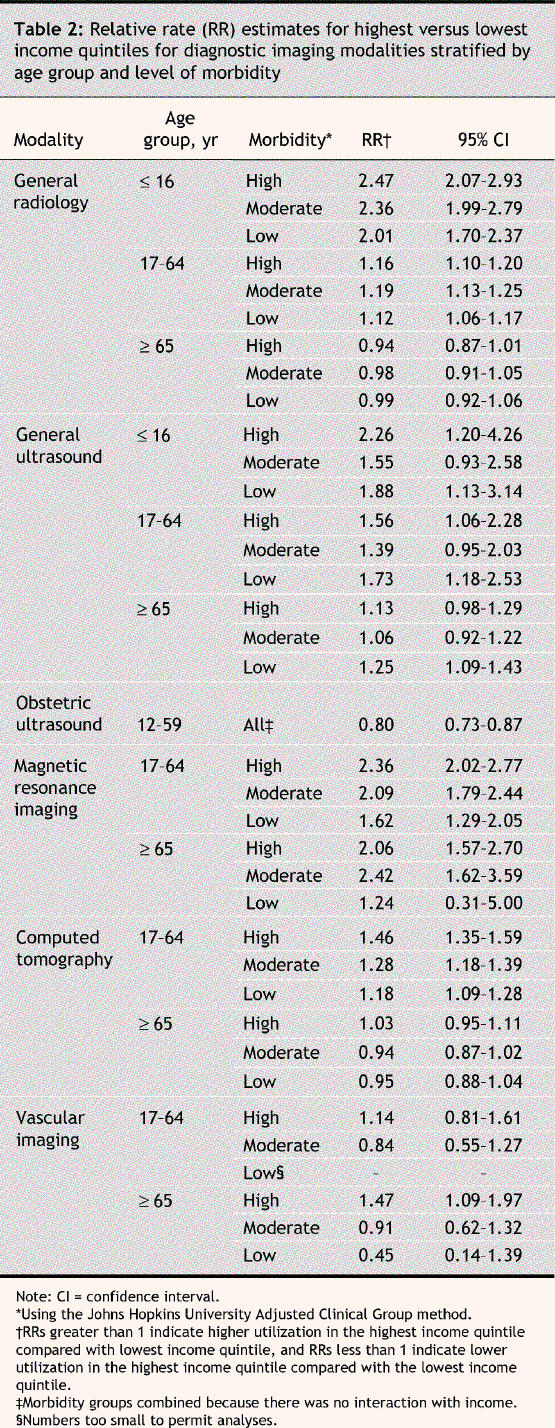
Significantly higher RRs of diagnostic imaging utilization in the highest income quintile were found in pediatric and adult patient groups at all morbidity levels receiving general radiology (RR range 1.12–2.47); pediatric patients at high and low morbidity levels, adult patients at high and low morbidity levels and elderly patients at low morbidity levels receiving general ultrasound (RR range 1.25–2.26); adult and elderly patients at all morbidity levels (except elderly patients at low morbidity levels) receiving MRI (RR range 1.62–2.36); adult patients at all morbidity levels receiving CT (RR range 1.18– 1.46); and elderly patients with high morbidity levels receiving vascular imaging (RR = 1.14). A lower RR of utilization in the highest income quintile was found in obstetric ultrasound (RR = 0.80). No significant associations were found among elderly patients receiving general radiology or CT, nor among any patient group receiving vascular imaging other than elderly patients at high morbidity levels.
Interpretation
In contrast to our original hypothesis, higher diagnostic imaging utilization rates were associated with higher SES groups for all levels of diagnostic imaging sophistication. In addition, and counterintuitively, the association between SES and diagnostic imaging utilization rates increased as morbidity level increased (e.g., adult patients receiving MRI and CT). It is of some concern that our findings are strongest for those most ill. Obstetric ultrasound was associated with increased utilization in lower SES groups. Obstetric ultrasound is a routine part of antenatal care, which may explain this exception. Except for elderly patients at high morbidity levels, vascular imaging did not demonstrate significant associations in either direction. This may be because numbers were insufficient to achieve statistical significance or because the utilization of vascular imaging, being a more invasive and prescribed procedure, is less dependent on SES status.
For CT and MRI, both increased utilization and the effect of morbidity are in keeping with the literature.4,5 The associations between SES and general radiology and between SES and ultrasound were unexpected. Although the cause of the higher utilization rates for these 2 modalities among higher SES groups has not been determined, the finding is important in light of increasing demands for heath care funding, access to technology and shorter wait lists. Diagnostic imaging was identified as a key component in the recent appointment of a Federal Advisor on Wait Times14 as part of the federal, provincial and territorial governments' 10-year plan to strengthen the health care system.15
SES has classically been defined by income, education and occupation. Income is considered to be a strong predictor of morbidity and mortality.16 It is reassuring that we obtained similar results using different regression methods (main effect and linear trend) and another SES indicator, the socioeconomic factor index (data not presented). The socioeconomic factor index is a composite indicator (age, dependency ratio, single parent household, unemployment rate and highest education level achieved) developed and validated in Manitoba.17,18
The major strengths of our study include utilization data linkage at the individual level, data validation and a large data set. Our population was derived from a single city (Winnipeg), which significantly reduced regional variation. Because there is relatively high demand, exemplified by long waiting lists, for some elective procedures in Manitoba (e.g., an average of 11 weeks for CT and 17 weeks for MRI in April 2005),19 it is unlikely that individual physician research interests would bias utilization.
There are limitations to our study. First, only data from one large urban centre met our validity thresholds. The relation between SES and diagnostic imaging utilization in rural or smaller urban centres within Manitoba has not been explored and may be different than what we observed. Second, although health care in Canada is publicly funded and guided by the Canada Health Act,1 variations in service delivery exist between provinces since health care is a provincial responsibility. For example, there are significant variations in the per capita number of imaging devices, as illustrated by the range of MRI scanners per population from 1 per 151 415 population in New Brunswick to 1 per 533 761 in Newfoundland, with Manitoba sitting at 1 per 383 345.20 International comparisons may also be influenced by variations in per capita diagnostic imaging utilization. For example, our crude CT utilization rate of 43 per 1000 in 2001 is almost 10 times less than US Medicare enrolee utilization rates of 391 per 1000.21 These issues may reduce the generalizability of our findings to other provinces or other publicly funded health care systems.
This research adds to the current body of knowledge about the relation between SES and utilization of health care services and may help inform health analysis and subsequent policy with respect to diagnostic imaging utilization. In a publicly funded system the possibility of SES influencing diagnostic imaging utilization is of concern. Further research as to the potential influence of SES on diagnostic imaging utilization is needed.
Acknowledgments
This study occurred as part of a Manitoba Centre for Health Policy database development project. We are indebted to Health Information Services of Manitoba Health for providing the data used in this study. The results and conclusions are those of the authors, and no official endorsement by Manitoba Health is intended or should be inferred.
Footnotes
Editor's take
· Universal health care systems such as Canada's are expected to deliver care equitably across all strata of society. Although this has been studied extensively for severe acute illness, there is little evidence regarding use of diagnostic imaging.
· Using population-level data, the authors found that rates of use of a wide variety of diagnostic imaging procedures were strikingly higher (often more than 2-fold) in the highest compared with the lowest income groups, irrespective of age or level of morbidity.
Implications for practice: Causes of this serious inequity include the distribution of imaging services, physician referral practices and management of waiting lists. The study was limited to a single region and needs to be replicated more broadly.
This article has been peer reviewed.
Contributors: Sandor Demeter contributed to the initial study design, literature review, data interpretation and drafting the manuscript. Martin Reed and William Leslie contributed to the initial study conceptualization and design. Lisa Lix contributed to the statistical analysis methodology and the descriptive and analytical statistical analysis. Leonard MacWilliam contributed to the database extraction and linkages and the descriptive statistical analysis. All of the authors revised the article critically for important intellectual content and approved the final version to be published.
Competing interests: None declared for Sandor Demeter, Martin Reed, Lisa Lix and Leonard MacWilliam. William Leslie has received speaker fees and unrestricted research grants from Merck-Frosst Canada for osteoporosis-related topics.
Correspondence to: Dr. Sandor Demeter, Room GG345, Section of Nuclear Medicine, Winnipeg Regional Health Authority, 820 Sherbrook St., Winnipeg MB R3A 1R9; sdemeter@exchange.hsc.mb.ca
REFERENCES
- 1.Government of Canada, Canada Health Act. 1984, c. 6.
- 2.Alter D, Naylor C, Austin P, et al. Geography and service supply do not explain socioeconomic gradients in angiography use after acute myocardial infarction. CMAJ 2003;168(3):261-4. [PMC free article] [PubMed]
- 3.Shortt SED, Shaw RA. Equity in Canadian health care: Does socioeconomic status affect waiting times for elective surgery? CMAJ 2003;168(4):413-6. [PMC free article] [PubMed]
- 4.Olsson S. Diffusion, utilization and regional variations in the use of CT and MRI in Sweden. Comput Methods Programs Biomed 2001;66(1):129-35. [DOI] [PubMed]
- 5.Frohlich N, Fransoo R, Roos N. Health service utilization in the Winnipeg Regional Health Authority: variations across areas in relation to health and socioeconomic status. Health Care Management Forum 2000:Winter supp;9-14. [DOI] [PubMed]
- 6.Immonen-Raiha P, Kauhava L, Parvinen I, et al. Customer fee and participation in breast-cancer screening. Lancet 2001;358(9291):1425. [DOI] [PubMed]
- 7.Hyndman, Holman C, Dawes V. Effects of distance and social disadvantage on the response to invitations to attend mammography screening. J Med Screen 2000; 7(3):141-5. [DOI] [PubMed]
- 8.Johnson R, Murata P. Demographic, clinical, and financial factors relating to the completion rate of screening mammography. Cancer Detect Prev 1988;11(3-6):259-66. [PubMed]
- 9.Pinhey T, Iverson T, Workman R. The influence of ethnicity of socioeconomic status on the use of mammography by Asian and Pacific island women on Guam. Women and Health 1994;21(2-3):57-69. [DOI] [PubMed]
- 10.The Johns Hopkins University ACG Case-Mix Adjustment System [computer program]. Johns Hopkins University School of Hygiene and Public Health. Version 4.0. Baltimore, MD: Johns Hopkins University;1997.
- 11.Reid R, MacWilliam L, Roos NP, et al. Measuring morbidity in populations: performance of the Johns Hopkins Adjusted Clinical Group (ACG) Case-Mix Adjustment System in Manitoba. Manitoba Centre for Health Policy. June 1999.
- 12.Reid RJ, Roos NP, MacWilliam L, et al. Assessing population health care need using a claims-based ACG morbidity measure: a validation analysis in the Province of Manitoba. Health Serv Res 2002;37;1345-64. [DOI] [PMC free article] [PubMed]
- 13.Littell R. Stroup WW, Freund RJ. SAS for linear models, 4th edition. Cary, NC: SAS Institute;2002.
- 14.Government of Canada, Health Canada, Press Release. Government of Canada Appoints Advisor on Wait Times. 2005 Jul 21. Available: www.cnw.ca/en/releases/archive/July2005/21/c3415.html (accessed 6 Oct 2005).
- 15.Government of Canada, Health Canada. A 10-year plan to strengthen health care. 2004 Sep 16. Available: www.hc-sc.gc.ca/english/hca2003/fmm/index.html (accessed 6 Oct 2005).
- 16.Daly MC, Duncan GJ, McDonough P, et al. Optimal indicators of socioeconomic status for health research. Am J Public Health 2002;92(7):1151-7. [DOI] [PMC free article] [PubMed]
- 17.Manitoba Centre for Health Policy. Constructing the SEFI (1996) Score. Available: www.umanitoba.ca/centres/mchp/concept/dict/SEFI/sefi_1996_additional.html (accessed 6 Oct 2005).
- 18.Manitoba Centre for Health Policy. The Socioeconomic Factor Index (SEFI) for 1986, 1991, and 1996. 2000 Feb 21. Available: www.umanitoba.ca/centres/mchp/concept/dict/SEFI/sefi.html (accessed 6 Oct 2005).
- 19.Winnipeg Regional Health Authority. Diagnostic Imaging Program Waiting List Status Report for April 2005.
- 20.Canadian Coordinating Office for Health Technology Assessment. National inventory of selected imaging equipment: 1.2 Analysis by age and geographic distribution of equipment. 2002
- 21.Bhargavan M, Sunshine JH. Utilization of radiology services in the United States: levels and trends in modalities, regions and populations. Radiology 2005:234(3):824-32. [DOI] [PubMed]